SILVER Will Go Lower From Resistance! Short!
Here is our detailed technical review for SILVER.
Time Frame: 12h
Current Trend: Bearish
Sentiment: Overbought (based on 7-period RSI)
Forecast: Bearish
The market is approaching a significant resistance area 3,654.7.
Due to the fact that we see a positive bearish reaction from the underlined area, I strongly believe that sellers will manage to push the price all the way down to 3,536.0 level.
P.S
Please, note that an oversold/overbought condition can last for a long time, and therefore being oversold/overbought doesn't mean a price rally will come soon, or at all.
Disclosure: I am part of Trade Nation's Influencer program and receive a monthly fee for using their TradingView charts in my analysis.
Like and subscribe and comment my ideas if you enjoy them!
Trading

USDCHF Will Go Up From Support! Buy!
Take a look at our analysis for USDCHF.
Time Frame: 12h
Current Trend: Bullish
Sentiment: Oversold (based on 7-period RSI)
Forecast: Bullish
The market is on a crucial zone of demand 0.794.
The oversold market condition in a combination with key structure gives us a relatively strong bullish signal with goal 0.809 level.
P.S
The term oversold refers to a condition where an asset has traded lower in price and has the potential for a price bounce.
Overbought refers to market scenarios where the instrument is traded considerably higher than its fair value. Overvaluation is caused by market sentiments when there is positive news.
Disclosure: I am part of Trade Nation's Influencer program and receive a monthly fee for using their TradingView charts in my analysis.
Like and subscribe and comment my ideas if you enjoy them!

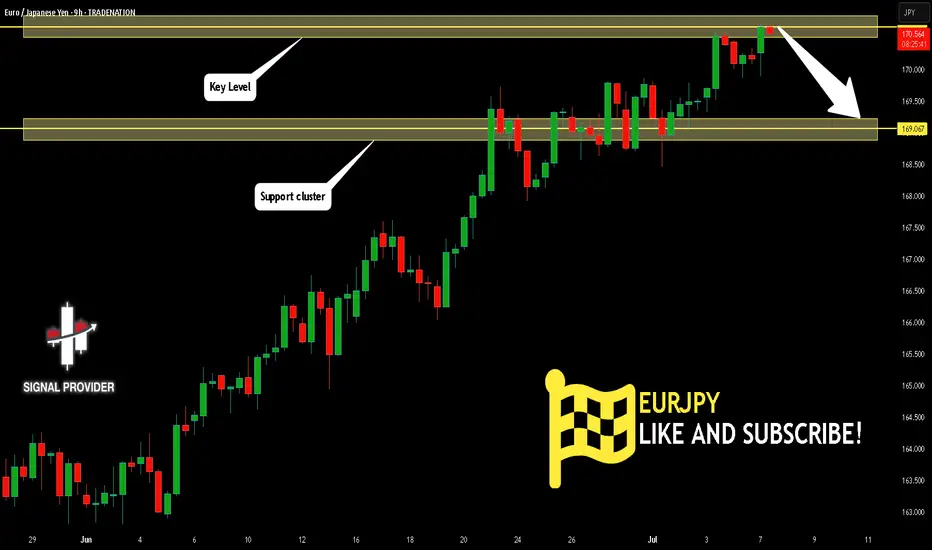
EURJPY Will Go Lower! Sell!
Please, check our technical outlook for EURJPY.
Time Frame: 9h
Current Trend: Bearish
Sentiment: Overbought (based on 7-period RSI)
Forecast: Bearish
The price is testing a key resistance 170.636.
Taking into consideration the current market trend & overbought RSI, chances will be high to see a bearish movement to the downside at least to 169.067 level.
P.S
We determine oversold/overbought condition with RSI indicator.
When it drops below 30 - the market is considered to be oversold.
When it bounces above 70 - the market is considered to be overbought.
Disclosure: I am part of Trade Nation's Influencer program and receive a monthly fee for using their TradingView charts in my analysis.
Like and subscribe and comment my ideas if you enjoy them!
GBPNZD Will Go Up! Long!
Here is our detailed technical review for GBPNZD.
Time Frame: 9h
Current Trend: Bullish
Sentiment: Oversold (based on 7-period RSI)
Forecast: Bullish
The market is trading around a solid horizontal structure 2.264.
The above observations make me that the market will inevitably achieve 2.285 level.
P.S
Overbought describes a period of time where there has been a significant and consistent upward move in price over a period of time without much pullback.
Disclosure: I am part of Trade Nation's Influencer program and receive a monthly fee for using their TradingView charts in my analysis.
Like and subscribe and comment my ideas if you enjoy them!

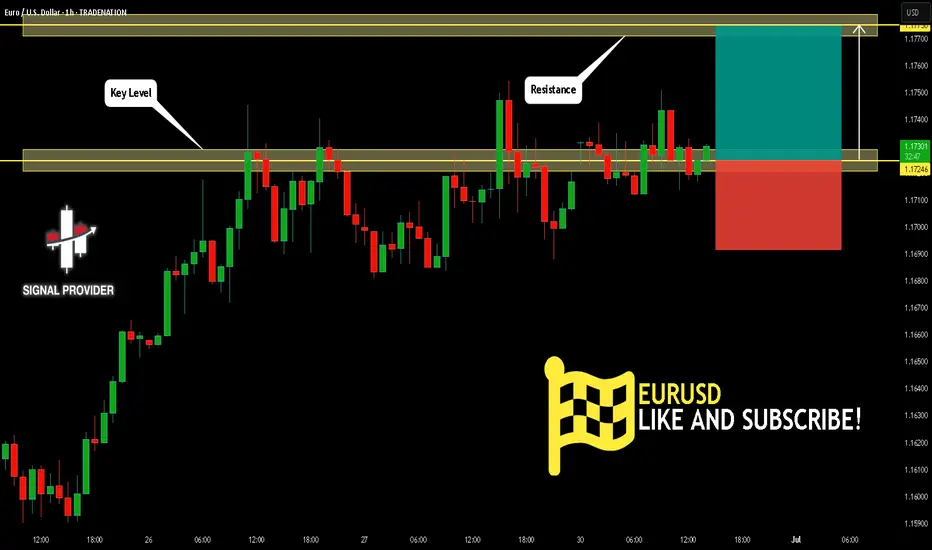
EURUSD Will Go Higher From Support! Long!
Take a look at our analysis for EURUSD.
Time Frame: 1h
Current Trend: Bullish
Sentiment: Oversold (based on 7-period RSI)
Forecast: Bullish
The market is on a crucial zone of demand 1.172.
The oversold market condition in a combination with key structure gives us a relatively strong bullish signal with goal 1.177 level.
P.S
We determine oversold/overbought condition with RSI indicator.
When it drops below 30 - the market is considered to be oversold.
When it bounces above 70 - the market is considered to be overbought.
Disclosure: I am part of Trade Nation's Influencer program and receive a monthly fee for using their TradingView charts in my analysis.
Like and subscribe and comment my ideas if you enjoy them!
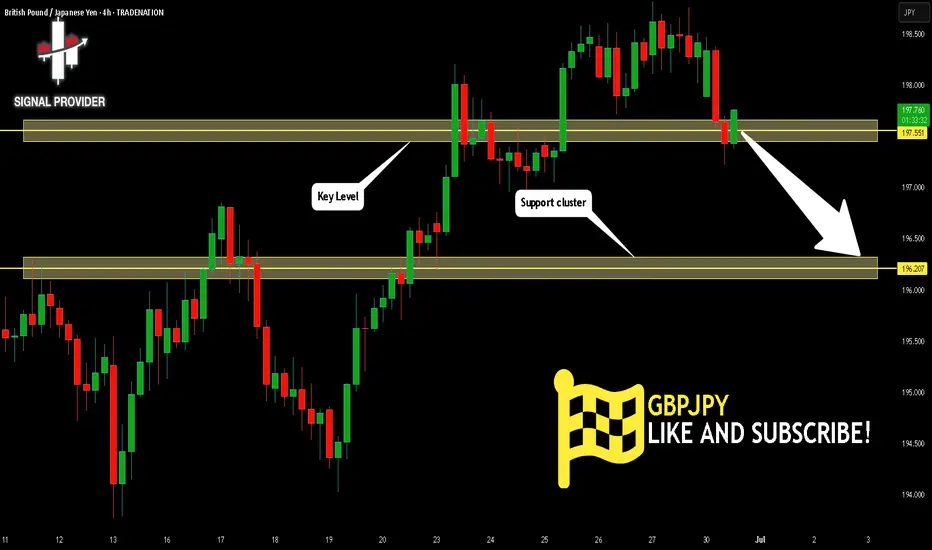
GBPJPY Will Go Down From Resistance! Sell!
Please, check our technical outlook for GBPJPY.
Time Frame: 4h
Current Trend: Bearish
Sentiment: Overbought (based on 7-period RSI)
Forecast: Bearish
The price is testing a key resistance 197.551.
Taking into consideration the current market trend & overbought RSI, chances will be high to see a bearish movement to the downside at least to 196.207 level.
P.S
Overbought describes a period of time where there has been a significant and consistent upward move in price over a period of time without much pullback.
Disclosure: I am part of Trade Nation's Influencer program and receive a monthly fee for using their TradingView charts in my analysis.
Like and subscribe and comment my ideas if you enjoy them!
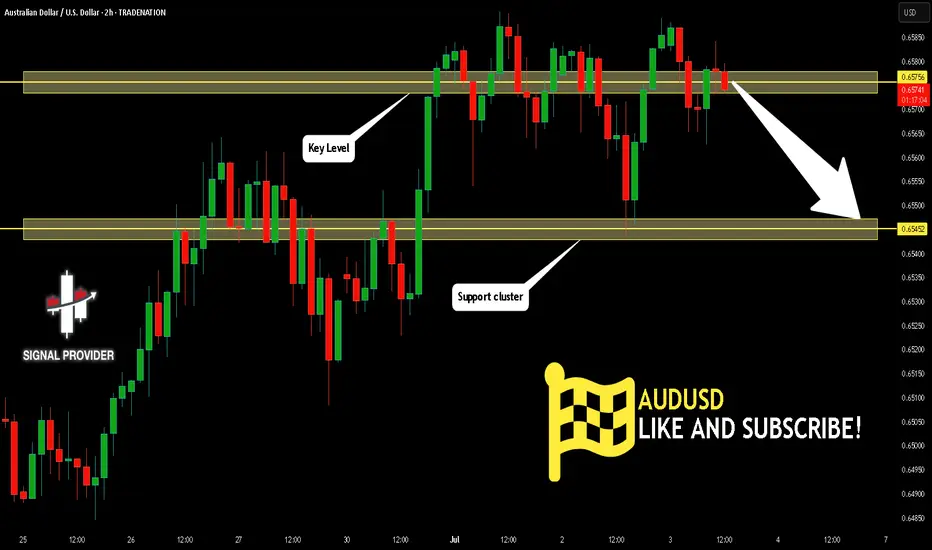
AUDUSD Is Very Bearish! Short!
Please, check our technical outlook for AUDUSD.
Time Frame: 2h
Current Trend: Bearish
Sentiment: Overbought (based on 7-period RSI)
Forecast: Bearish
The price is testing a key resistance 0.657.
Taking into consideration the current market trend & overbought RSI, chances will be high to see a bearish movement to the downside at least to 0.654 level.
P.S
Overbought describes a period of time where there has been a significant and consistent upward move in price over a period of time without much pullback.
Disclosure: I am part of Trade Nation's Influencer program and receive a monthly fee for using their TradingView charts in my analysis.
Like and subscribe and comment my ideas if you enjoy them!
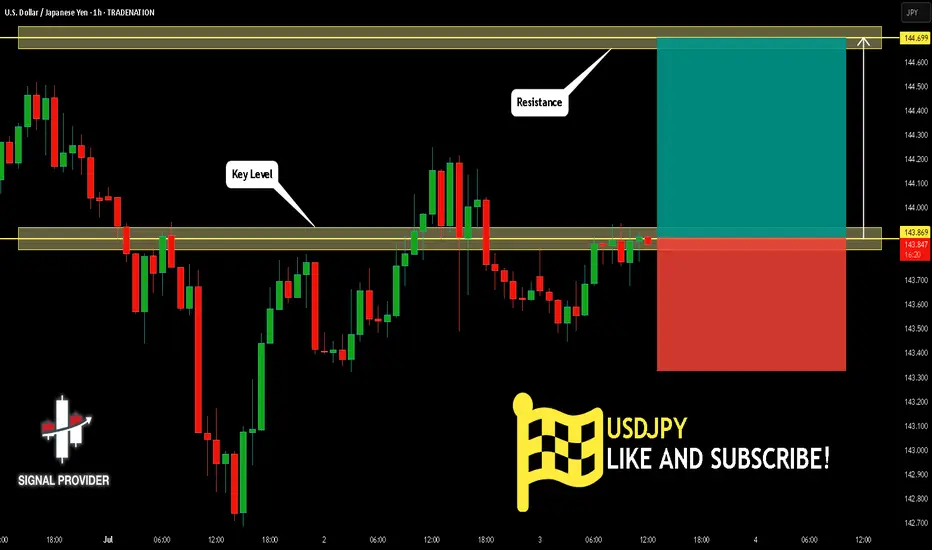
USDJPY Is Bullish! Buy!
Take a look at our analysis for USDJPY.
Time Frame: 1h
Current Trend: Bullish
Sentiment: Oversold (based on 7-period RSI)
Forecast: Bullish
The market is on a crucial zone of demand 143.869.
The oversold market condition in a combination with key structure gives us a relatively strong bullish signal with goal 144.699 level.
P.S
We determine oversold/overbought condition with RSI indicator.
When it drops below 30 - the market is considered to be oversold.
When it bounces above 70 - the market is considered to be overbought.
Disclosure: I am part of Trade Nation's Influencer program and receive a monthly fee for using their TradingView charts in my analysis.
Like and subscribe and comment my ideas if you enjoy them!
GOLD BEST PLACE TO BUY FROM|LONG
GOLD SIGNAL
Trade Direction: long
Entry Level: 3,312.57
Target Level: 3,353.45
Stop Loss: 3,285.24
RISK PROFILE
Risk level: medium
Suggested risk: 1%
Timeframe: 4h
Disclosure: I am part of Trade Nation's Influencer program and receive a monthly fee for using their TradingView charts in my analysis.
✅LIKE AND COMMENT MY IDEAS✅

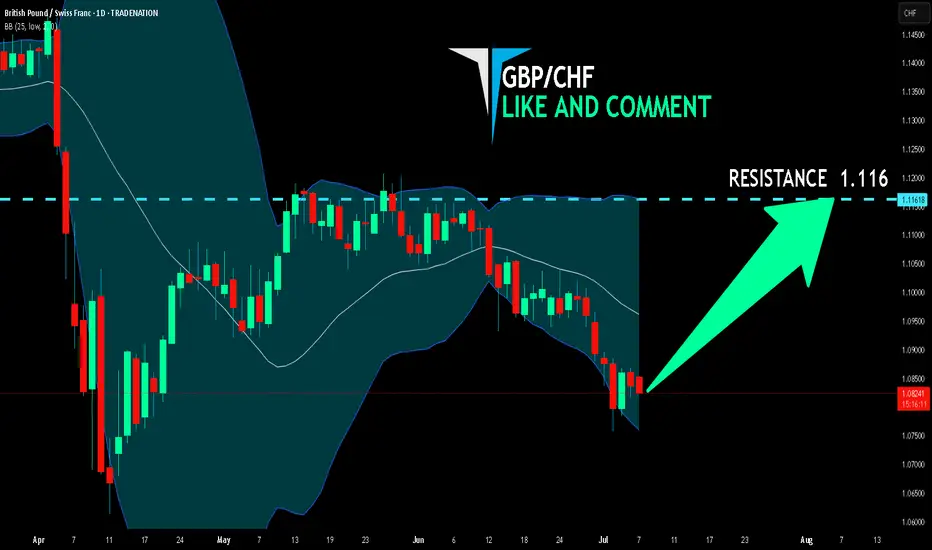
GBP/CHF LONG FROM SUPPORT
Hello, Friends!
GBP/CHF pair is in the downtrend because previous week’s candle is red, while the price is obviously falling on the 1D timeframe. And after the retest of the support line below I believe we will see a move up towards the target above at 1.116 because the pair oversold due to its proximity to the lower BB band and a bullish correction is likely.
Disclosure: I am part of Trade Nation's Influencer program and receive a monthly fee for using their TradingView charts in my analysis.
✅LIKE AND COMMENT MY IDEAS✅
GBP/USD BEARS ARE STRONG HERE|SHORT
Hello, Friends!
GBP/USD pair is in the uptrend because previous week’s candle is green, while the price is clearly rising on the 3H timeframe. And after the retest of the resistance line above I believe we will see a move down towards the target below at 1.358 because the pair overbought due to its proximity to the upper BB band and a bearish correction is likely.
Disclosure: I am part of Trade Nation's Influencer program and receive a monthly fee for using their TradingView charts in my analysis.
✅LIKE AND COMMENT MY IDEAS✅

GBP/CAD SELLERS WILL DOMINATE THE MARKET|SHORT
GBP/CAD SIGNAL
Trade Direction: short
Entry Level: 1.872
Target Level: 1.866
Stop Loss: 1.876
RISK PROFILE
Risk level: medium
Suggested risk: 1%
Timeframe: 1h
Disclosure: I am part of Trade Nation's Influencer program and receive a monthly fee for using their TradingView charts in my analysis.
✅LIKE AND COMMENT MY IDEAS✅

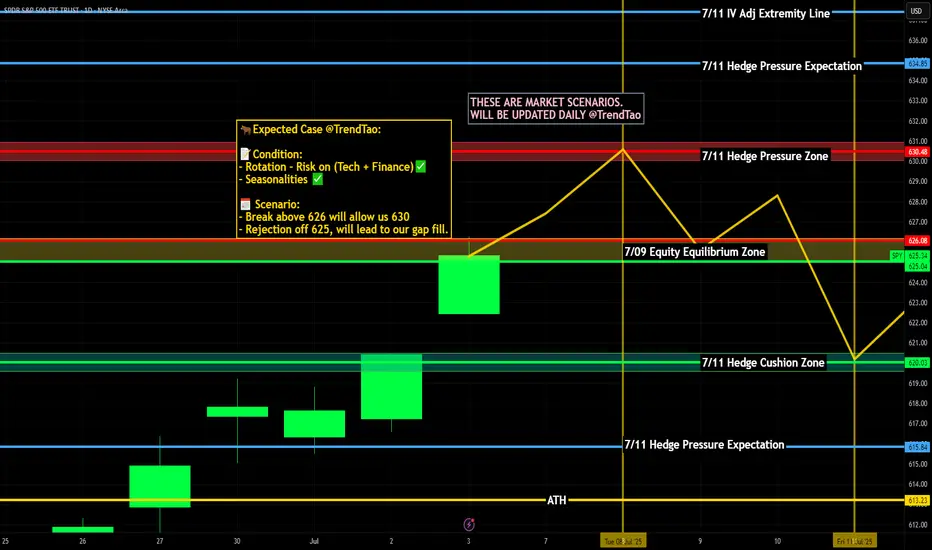
Weekly $SPY / $SPX Scenarios for July 7–11, 2025🔮 Weekly AMEX:SPY / SP:SPX Scenarios for July 7–11, 2025 🔮
🌍 Market‑Moving News 🌍
📈 From Panic to "Goldilocks" Rally
The S&P 500 and Nasdaq hit fresh record highs, surging ~20% from April lows. Markets rallied on a combination of easing Middle East tensions, the 90‑day tariff pause, a new fiscal bill in Washington, and strong June jobs data. Still, strategists caution that optimism may be ahead of fundamentals, especially if trade volatility returns
💱 Dollar Weakness & Bond Market Watch
The U.S. dollar remains near 3.5‑year lows amid rate‑cut speculation and trade progress. Treasury yields are volatile this week, impacted by concerns over escalating debt issuance, upcoming tariff deadlines (July 9), and the Federal Reserve’s stance .
🏢 Tech Leadership Shifts
With the “Magnificent Seven” tech stocks near heights, growth is spreading: cyclical sectors, small‑caps, and industrials are gaining momentum. AI remains the primary engine, but resilience across a broader stock base is signaling a potentially sustainable rally
⚠️ Tariff Truce Deadline Looms (July 9)
The April tariff pause expires mid‑week. U.S. plans to extend exemptions via trade talks with partners like UK, Vietnam, and Canada—yet any delay or failure may shock markets. Watch for headlines that may trigger spillover effects .
📊 Key Data Releases & Events 📊
📅 Monday, July 7:
Independence Day markets resume. Light trading expected ahead of data and tariff deadline.
📅 Tuesday, July 8:
10:00 AM ET – Consumer Credit (June)
Gauges borrowing trends—an indicator of household health in a low‑rate environment.
📅 Wednesday, July 9:
EIA Crude Oil Inventories & MBA Mortgage Apps & Wholesale Inventories
Key mid‑week data points; oil builds may pressure energy stocks.
Tariff Pause Deadline – Expect market volatility on news of extension or reimposition.
📅 Thursday, July 10:
8:30 AM ET – Initial & Continuing Jobless Claims
10:00 AM ET – Natural Gas Inventories
Markets focus on labor health and energy trends.
📅 Friday, July 11:
10:00 AM ET – Treasury Budget Statement
Details on government borrowing and fiscal outlook—markets sensitive to deficit risks.
⚠️ Disclaimer:
These insights are for educational purposes only—not financial advice. Consult a licensed advisor before making investing decisions.
📌 #trading #stockmarket #economy #news #tariffs #Fed #AI #technicalanalysis
AUD_USD WILL GO UP|LONG|
✅AUD_USD has retested a key support level of 0.6540
And as the pair is already making a bullish rebound
A move up to retest the supply level above at 0.6584 is likely
LONG🚀
✅Like and subscribe to never miss a new idea!✅
Disclosure: I am part of Trade Nation's Influencer program and receive a monthly fee for using their TradingView charts in my analysis.

XAUUSD 4Hour TF - July 6th, 2025XAUUSD 7/6/2025
XAUUSD 4 hour Long Idea
Monthly - Bullish
Weekly - Bullish
Daily - Bullish
4hour - Bullish
Back to bullish here on Gold but that comes as no surprise when you look at the higher timeframe trends.
I’m mainly considering long scenarios for the week ahead but let's take a look at two for the week ahead:
4hour bearish continuation - Currently we can see price action broke above 3,320.00 resistance and is currently looking to find some footing. We’re keeping an eye out for higher lows at or near this level to then consider long scenarios. 3,395.000 seems like a good target but gold has potential to go higher.
4hour trend reversal - If we are to consider short positions on gold we would need to see a break back below our 3,320.000 zone. Look for confirmed lower highs below 3,320.000 and target lower key support levels if this happens.

EURJPY 4Hour TF - July 6th, 2025EURJPY 7/6/2025
EURJPY 4hour Bullish Idea
Monthly - Bullish
Weekly - Bullish
Daily - Bullish
4hour - Bullish
EJ is doing it’s thing and sticking with it’s bullish trend for now. The only conflicting signal is this major monthly zone around the 171.000 area so we will have to be careful.
Let’s keep a look out for two potential scenarios going into this week:
Bullish Continuation - We just saw a break above the 169.750 4hour zone which is fairly significant and it is signaling new support for this currently forming higher low, which is great. From here we’re looking for this bullish trend to continue, look for strong bullish conviction coming off this 169.750 zone and look to target higher.
Trend Reversal - This is a possibility with our 171.000 looming overhead. If we start to see bearish rejection look for a lower high below 169.750 and look to target lower toward key support levels.

USDJPY Daily TF - July 6th, 2025USDJPY 7/6/2025
USDJPY Daily Neutral Idea
Monthly - Bullish
Weekly - Bearish
Daily - Bearish
We’re still on the daily timeframe with UJ as there is nothing worthwhile. We are clearly in some daily consolidation phase and price action has no clear direction from a swing perspective.
Bearish Continuation - For us to consider a bearish continuation, which is the most likely, we would like to see a retest of our 147.500 zone followed by strong bearish rejection. If we can spot rejection around the 147.500 zone it could present some decent short positions. I’d be looking to target lower toward key support levels.
Aside from this potential setup i’m not looking at any other scenarios for UJ.

AUDJPY 4Hour TF - July 6th, 2025AUDJPY 7/6/2025
AUDJPY 4hour Neutral Idea
Monthly - Bullish
Weekly - Bearish
Dailly - Bearish
4hour - Ranging
We’re getting some mixed signals here on AJ so i’ll keep this as a neutral idea as we need more info from price action. Most of the major trends seem bearish but the 4hour trend seems to have some bullish pressure. Let’s see how this could play out this week:
Bullish Breakout - We already saw a pretty significant bullish attempt to break out of this range around 94.500. If we can spot some bullish conviction, now that we're retesting what seems to be a broken range, then we can confirm a bullish 4hour trend and prepare for potential long scenarios. I’ll be looking higher toward key resistance around 96.500 if this happens.
Bearish Breakout - For us to consider comfortable bearish scenarios, we would need to see price action fall back through our 94.500 zone and form a lower high. If we see structure formed below 94.500 we can begin targeting lower for potential short positions. Look toward key support levels as targets.

AUDUSD 4hour TF - July 6th, 2025AUDUSD 7/6/2025
AUDUSD 4hour Neutral idea
Monthly - Bearish
Weekly - Bearish
Dailly - Bullish
4hour - Ranging
We are still technically bullish overall but we can see here on the 4hour that AU is ranging between 0.65800 & 0.65500. This is a fairly small range so we’re not that interested in taking trades while price action is bouncing between these two zones.
We’re looking for conviction above 0.65800 or below 0.65500 before we can comfortably make a move. Let’s see what both of those situations would look like:
Bullish Continuation - Most of the trend data is suggesting AU is still bullish but we would need to see a strong push above resistance around 0.65800 with a confirmed higher low above before getting into any trades. If we do see this play out I'm looking toward 0.66750 resistance as a target.
Reversal back into channel - Price action seems to be poking out of the bottom of this range but we are still not convinced just yet. For us to strongly consider this a bearish move we would like to see a retest of 0.65500 as resistance followed by bearish conviction. Look for price action to move lower toward key support areas if this happens.

DXY 4Hour TF - July 6th, 2025DXY 7/6/2025
DXY 4hour Bearish Idea
Monthly - Bearish
Weekly - Bearish
Dailly - Bearish
4hour - Bearish
All timeframes are suggesting we are sitll very much bearish. Going into this week we can spot two scenarios that will consider DXY either bullish or bearish.
Bearish Continuation - Ideally we can see price action stay below our 97.500 resistance zone which is also our 38.2% fib level. Look for price action to reject 97.500 with strong bearish conviction. This will most likely confirm a bearish dollar for the week ahead. Keep in mind, price action can push up to the 98.000 zone and still remain bearish.
Reversal - This is the less likely move for the week ahead but not impossible. For us to consider DXY bullish again on the 4hour timeframe we would need to see price action push above our 98.000 resistance area with a confirmed higher low above. Look for strong bullish rejection above & off of 98.000 acting as support. This is the first step for DXY in becoming bullish again.

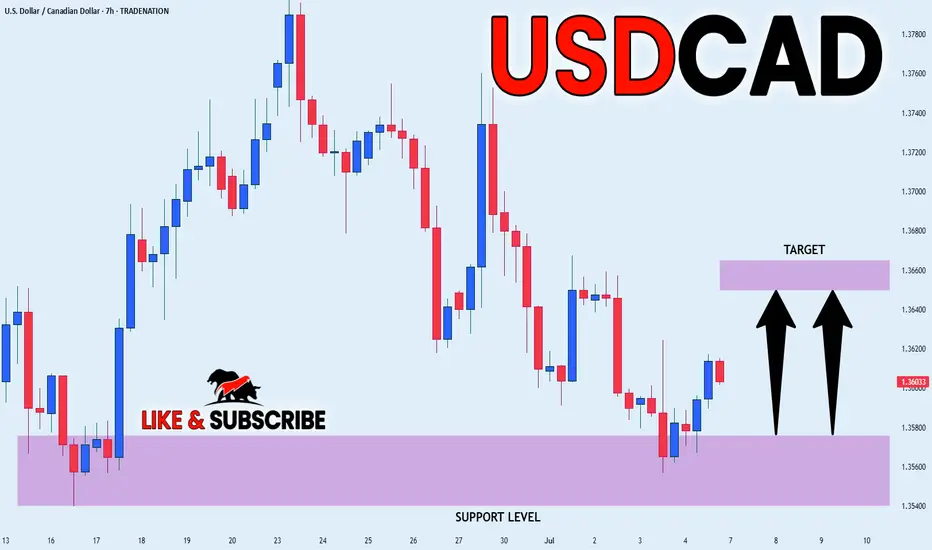
USD_CAD POTENTIAL LONG|
✅USD_CAD went down to retest
A horizontal support of 1.3560
Which makes me locally bullish biased
And I think that a move up
From the level is to be expected
Towards the target above at 1.3652
LONG🚀
✅Like and subscribe to never miss a new idea!✅
Disclosure: I am part of Trade Nation's Influencer program and receive a monthly fee for using their TradingView charts in my analysis.
EUR-AUD Will Fall! Sell!
Hello,Traders!
EUR-AUD keeps trading in
A strong uptrend and the pair
Is locally overbought so as the
Pair is retesting a horizontal
Resistance of 1.8019 from
Where we will be expecting
A local pullback on Monday
Sell!
Comment and subscribe to help us grow!
Check out other forecasts below too!
Disclosure: I am part of Trade Nation's Influencer program and receive a monthly fee for using their TradingView charts in my analysis.

EUR-NZD Risky Short! Sell!
Hello,Traders!
EUR-NZD made a retest
Of the local horizontal resistance
Of 1.9485 so despite the uptrend
We are locally bearish biased
And we will be expecting a
Local bearish correction
On Monday
Sell!
Comment and subscribe to help us grow!
Check out other forecasts below too!
Disclosure: I am part of Trade Nation's Influencer program and receive a monthly fee for using their TradingView charts in my analysis.
