Gold price analysis July 2As expected, after the D1 candle showed the return of buying power, yesterday's trading session saw the price continue its upward trend and reach 3357.
Currently, the market is in an accumulation phase with a fairly wide range, fluctuating from 3328 to 3344. This is an important price zone, acting as a "sideway box" waiting for a breakout.
The priority strategy at this time is still trend trading - activated when the price breaks out of the above accumulation zone.
BUY orders will have a high probability of success if the price adjusts and retests the Support or Resistance zones that have just been broken, then forms a confirmation signal.
Meanwhile, SELL orders around resistance should only be considered a recovery strategy in an uptrend - requiring strict risk management and short-term profit expectations.
Breakout Range: 3328 – 3344
Support: 3310 – 3298
Resistance: 3368 – 3386
Trading

GOLD: Strong Bearish Sentiment! Short!
My dear friends,
Today we will analyse GOLD together☺️
The in-trend continuation seems likely as the current long-term trend appears to be strong, and price is holding below a key level of 3,341.44 So a bearish continuation seems plausible, targeting the next low. We should enter on confirmation, and place a stop-loss beyond the recent swing level.
❤️Sending you lots of Love and Hugs❤️

AUDNZD Will Collapse! SELL!
My dear friends,
Please, find my technical outlook for AUDNZD below:
The price is coiling around a solid key level - 1.0816
Bias - Bearish
Technical Indicators: Pivot Points Low anticipates a potential price reversal.
Super trend shows a clear sell, giving a perfect indicators' convergence.
Goal - 1.0794
Safe Stop Loss - 1.0829
About Used Indicators:
The pivot point itself is simply the average of the high, low and closing prices from the previous trading day.
Disclosure: I am part of Trade Nation's Influencer program and receive a monthly fee for using their TradingView charts in my analysis.
———————————
WISH YOU ALL LUCK
GBPAUD Technical Analysis! BUY!
My dear friends,
My technical analysis for GBPAUD is below:
The market is trading on 2.0742 pivot level.
Bias - Bullish
Technical Indicators: Both Super Trend & Pivot HL indicate a highly probable Bullish continuation.
Target - 2.0862
Recommended Stop Loss - 2.0677
About Used Indicators:
A pivot point is a technical analysis indicator, or calculations, used to determine the overall trend of the market over different time frames.
Disclosure: I am part of Trade Nation's Influencer program and receive a monthly fee for using their TradingView charts in my analysis.
———————————
WISH YOU ALL LUCK

AUDNZD The Target Is DOWN! SELL!
My dear subscribers,
AUDNZD looks like it will make a good move, and here are the details:
The market is trading on 1.0817 pivot level.
Bias - Bearish
Technical Indicators: Both Super Trend & Pivot HL indicate a highly probable Bearish continuation.
Target - 1.0798
About Used Indicators:
The average true range (ATR) plays an important role in 'Supertrend' as the indicator uses ATR to calculate its value. The ATR indicator signals the degree of price volatility.
Disclosure: I am part of Trade Nation's Influencer program and receive a monthly fee for using their TradingView charts in my analysis.
———————————
WISH YOU ALL LUCK

EURUSD Expected Growth! BUY!
My dear followers,
This is my opinion on the EURUSD next move:
The asset is approaching an important pivot point 1.1774
Bias -Bullish
Technical Indicators: Supper Trend generates a clear long signal while Pivot Point HL is currently determining the overall Bullish trend of the market.
Goal - 1.1792
About Used Indicators:
For more efficient signals, super-trend is used in combination with other indicators like Pivot Points.
Disclosure: I am part of Trade Nation's Influencer program and receive a monthly fee for using their TradingView charts in my analysis.
———————————
WISH YOU ALL LUCK

Copper is gonna to complete the 2nd leg??Hi all trading lovers and copper buyers...
Seems that after BREAKOUT from Descending Triangle and Pullback to breakout level, price is going to complete the 2nd BULLISH Leg in Weekly uptrend with a round level target (5.5555)...
(Pullback could be a bit deeper...)
PLEASE NOTE THAT IS ONLY AN ANALYSIS AND COULD BE WRONG...
MARKET IS BASED ON POSSIBILITIES AND UNCERTAINTIES...
MANAGE YOUR RISK...
#Forex #Trading #Analysis #Copper #Chart #Spike #Wedge #Uptrend

$IWM is set for a Blow-Off Top - 34% UpsdieAMEX:IWM is about to have a blow-off top moment!
Catch up mode engaged...
- Breakout of downward trend
- Volume shelf launch
- Rate cuts inbound
- Suppressed for 4 years
PTs: $244/ 259/ 276 (MM)

#AN013: USD and AUD under pressure, Euro advances
1. India: New strategy on FX volatility
The Indian Respondents' Bank (RBI) is allowing more volatility on the USD/INR exchange rate, prompting many companies to hedge with forward contracts. This is the highest level of coverage since 2020.
We thank in advance our Official Broker Partner PEPPERSTONE who supported us in writing this article.
FX Impact:
Potential weakening of the rupee in the short term, but increased stability in the medium-long term.
Volatility on USD/INR, EUR/INR, JPY/INR ? opportunities for carry trades and short-term shorts if the dollar strengthens.
2. Australia hit by extreme storms
Severe storms hit New South Wales, Queensland and Victoria: 100 km/h winds, torrential rains and blackouts on over 30,000 homes.
Australian economic sentiment pressured ? AUD weak.
Opportunities on AUD/USD, AUD/JPY and AUD/NZD from a short perspective.
Monitor agricultural and insurance developments ? risk of extended downside.
3. Iran: Fordow nuclear site severely damaged
US strike hits Iranian nuclear site. In response, Iran has threatened to mine the Strait of Hormuz, a critical point for global oil transport.
Geopolitical volatility expected to rise.
Increased flows to safe haven currencies: JPY, CHF and USD.
Also impacting CAD and AUD due to oil ? risk of short-term upside but corrections if stalemate persists.
4. US $3.3 trillion fiscal package under discussion
Senate considering mega stimulus plan. This fuels fears of new debt ? dollar falls to 4-year low against euro.
EUR/USD long strengthened (break above 1.17 already underway).
GBP/USD and NZD/USD potentially in push.
Risk of FED rate cut? increased volatility on dollar and bonds.
Strategic Conclusion
Recommended operations: long on EUR/USD, short on AUD/USD, long on USD/INR (only with confirmation).
Watch out for the next 48 hours: possible spike on CHF, JPY and CAD.
Institutional timing: probable fund inflows on EUR and USD in case of confirmed breakouts; stay ready but avoid front-running.
Stay updated for other news.

The Power of Setting SL and TP: Secret to Mastering Your TradeThe Power of Setting SL and TP: The Secret to Mastering Your Trade
Hey there, traders! 👋 Let’s talk about something that can make a world of difference in your trading journey – Stop Loss (SL) and Take Profit (TP). These simple tools may look basic, but they are essential for every trader to stay consistent and profitable in the long run.
In today’s post, we’ll dive into the importance of setting SL and TP for each trade and how these two tools can change your trading game. Whether you’re new to trading or have been in the game for a while, understanding and applying SL and TP correctly is key to building a solid and profitable trading strategy. Let’s get started!
1. What Exactly Are SL and TP?
Stop Loss (SL):
A Stop Loss is the level where you decide to cut your losses if the market moves against your trade. It's your safety net, ensuring that your losses stay manageable. For example, if you’re trading XAU/USD at $1800 and don’t want to lose more than $50, you’d set your SL at $1750.
Take Profit (TP):
Take Profit is the level at which you’ll close your trade once the price reaches your desired profit. This helps you lock in profits automatically, without the temptation to stay in the market too long. For example, if you think gold will rise to $1850, you’d set your TP at that level to secure the profit.
2. Why Are SL and TP Crucial?
A. Eliminating Emotion from Your Trades
One of the hardest challenges in trading is keeping emotions out of the equation. Fear and greed can cause you to hold onto losing positions for too long or exit too soon. SL and TP automate your exits, allowing you to trade with a clear plan and reduce emotional decision-making.
B. Managing Risk Like a Pro
Risk management is the backbone of any successful trading strategy. SL limits your losses by setting a predefined level where your trade will automatically close. Without SLs, you could risk losing more than you intended, which can damage your trading account.
C. Securing Consistent Profits
TP helps you to capture profits at the right time. Without it, you might let your profits slip away as the market moves against you. A TP ensures you don’t miss out on locking in gains when the market reaches your target.
D. Building Consistency
By setting SL and TP, you create a consistent and structured approach to your trading. If you trade with a 1:2 risk-to-reward ratio, where you risk $1 to make $2, you can build long-term profitability, even if you lose some trades along the way. Consistency is the key to success in trading.
3. How to Set SL and TP Like a Pro
A. Start with Proper Analysis
Before entering any trade, always analyze the market context. Use technical analysis (like support and resistance levels, Fibonacci, and trendlines) to place your SL and TP at logical levels. For example, set your SL slightly below support for a buy trade, or slightly above resistance for a sell trade.
B. Risk-to-Reward Ratio
A good rule of thumb is to have a 1:2 risk-to-reward ratio. This means if you risk $50 on a trade, you aim to make at least $100. This allows you to lose half of your trades but still come out ahead in the long run. Always set your TP in relation to your risk tolerance.
C. Use Indicators to Help
Use indicators like EMA, RSI, Fibonacci retracements, and pivot points to determine the best levels for your SL and TP. For example, if you see a strong bullish trend and are entering a buy position, placing your TP near the next Fibonacci extension level is a great strategy.
D. Keep Volatility in Mind
Market volatility plays a big role in where you place your SL and TP. In highly volatile markets, tight SL might get hit too early. Adjust your SL to reflect the market’s movement. Similarly, your TP should be flexible enough to account for volatility.
4. Benefits of Setting SL and TP
A. Reducing Emotional Trading
Emotional trading is the quickest way to lose money. SL and TP take emotion out of the equation, making trading more objective and disciplined. You know exactly when you’re getting in, and when to get out – no guessing!
B. Avoiding Overtrading
Without clear SL and TP levels, you might overtrade, holding positions for too long or exiting too early. This lack of structure leads to emotional decisions and bad habits. Having SL and TP in place ensures that you trade only when it makes sense.
C. Gaining Confidence
By setting clear SL and TP levels, you gain confidence in your trading strategy. You know that your risk is limited and your profits are protected. This allows you to trade with a calm mindset, focusing on quality trades instead of rushing into everything.
5. Conclusion
Setting SL and TP is one of the most important skills for any trader, whether you're new to the market or experienced. They help you manage risk, capture profits, and build a disciplined approach to trading. By incorporating SL and TP into your trading plan, you can protect your capital, lock in profits, and ensure consistent growth in your trading journey.
So remember, Plan your trade and trade your plan – and always set your SL and TP before entering any trade.
Happy Trading! Stay disciplined, stay profitable! 💰🚀

USDJPY: Strong Bullish Price Action 🇺🇸🇯🇵
I see 2 strong bullish confirmation on USDJPY after a test of a key daily
support cluster.
The price violated a trend line of a falling channel and a neckline of
an inverted head & shoulders pattern with one single strong bullish candle.
The pair may rise more and reach 144.45 level soon.
❤️Please, support my work with like, thank you!❤️
I am part of Trade Nation's Influencer program and receive a monthly fee for using their TradingView charts in my analysis.

Will Gold Continue Its Strong Rally or Face a Pullback?XAUUSD 02/07: Will Gold Continue Its Strong Rally or Face a Pullback?
📉 Technical Analysis – Gold Faces Short-Term Pullback After Strong Rally
Gold has been experiencing a clear rally in recent days, but it’s currently undergoing a brief correction. The price has recently dropped slightly, prompting traders to keep a close eye on key levels for potential reversal or continuation of the bullish move.
🌍 Macroeconomic Context – Factors Impacting Gold's Price
USD Fluctuation: The weakness in the US Dollar continues to affect gold prices, creating opportunities for the precious metal to maintain its upward movement.
Geopolitical Tensions: Ongoing global tensions, including the US-Iran conflict, act as a safe-haven factor, supporting gold demand.
Interest Rate Expectations: The market is closely watching for any changes in interest rate policies. Any future rate cuts by the Fed could further bolster gold's price.
📊 Technical Outlook (H1 – H4 – D1)
Short-Term Trend: On the H1 timeframe, the price of gold touched a key level near 3340. From there, the price began to experience a pullback. However, the upward momentum remains strong on higher timeframes.
Key Support Levels: The 3300 level remains a crucial support. If the price stays above this, there’s a chance for gold to continue rising towards higher levels.
Key Resistance Levels: 3360 and 3380 are critical resistance levels. If breached, gold could move towards new highs.
📍 Important Support and Resistance Levels:
🔺 Resistance: 3345 – 3360 – 3380 – 3400
🔻 Support: 3300 – 3290 – 3270 – 3250
💡 Trading Plan for Today, 02/07:
🔵 BUY ZONE:
📈 Entry: 3305 – 3303
📉 SL: 3297
💰 TP: 3315 → 3325 → 3340 → 3360
🔴 SELL ZONE:
📉 Entry: 3360 – 3362
📈 SL: 3368
💰 TP: 3350 → 3340 → 3320
📣 Conclusion:
Gold is showing signs of short-term correction but remains a strong asset due to geopolitical factors and monetary policies. Buying opportunities continue to be attractive at support levels, while key resistances will play a crucial role for any breakout. Keep an eye on the mentioned levels to capitalize on market movements.
Happy trading and best of luck to all traders!

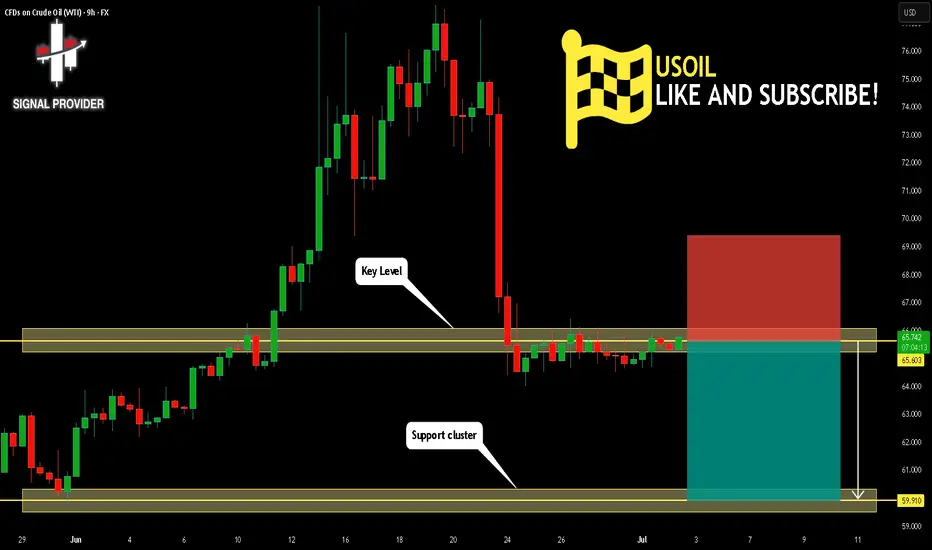
USOIL Will Fall! Sell!
Take a look at our analysis for USOIL.
Time Frame: 9h
Current Trend: Bearish
Sentiment: Overbought (based on 7-period RSI)
Forecast: Bearish
The market is testing a major horizontal structure 65.603.
Taking into consideration the structure & trend analysis, I believe that the market will reach 59.910 level soon.
P.S
The term oversold refers to a condition where an asset has traded lower in price and has the potential for a price bounce.
Overbought refers to market scenarios where the instrument is traded considerably higher than its fair value. Overvaluation is caused by market sentiments when there is positive news.
Disclosure: I am part of Trade Nation's Influencer program and receive a monthly fee for using their TradingView charts in my analysis.
Like and subscribe and comment my ideas if you enjoy them!
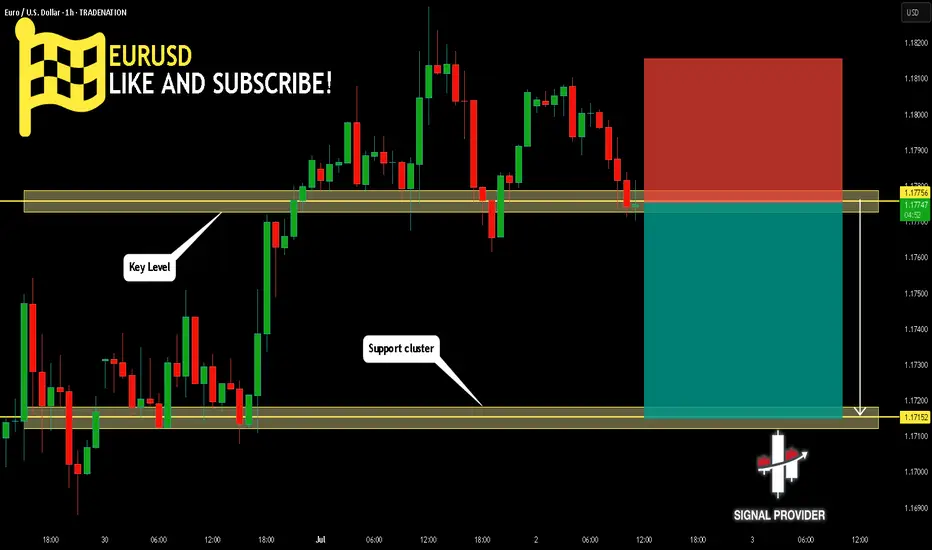
EURUSD Will Go Down From Resistance! Short!
Please, check our technical outlook for EURUSD.
Time Frame: 1h
Current Trend: Bearish
Sentiment: Overbought (based on 7-period RSI)
Forecast: Bearish
The market is approaching a key horizontal level 1.177.
Considering the today's price action, probabilities will be high to see a movement to 1.171.
P.S
We determine oversold/overbought condition with RSI indicator.
When it drops below 30 - the market is considered to be oversold.
When it bounces above 70 - the market is considered to be overbought.
Disclosure: I am part of Trade Nation's Influencer program and receive a monthly fee for using their TradingView charts in my analysis.
Like and subscribe and comment my ideas if you enjoy them!
USDCHF Will Go Lower! Sell!
Here is our detailed technical review for USDCHF.
Time Frame: 2h
Current Trend: Bearish
Sentiment: Overbought (based on 7-period RSI)
Forecast: Bearish
The market is approaching a significant resistance area 0.792.
Due to the fact that we see a positive bearish reaction from the underlined area, I strongly believe that sellers will manage to push the price all the way down to 0.785 level.
P.S
Overbought describes a period of time where there has been a significant and consistent upward move in price over a period of time without much pullback.
Disclosure: I am part of Trade Nation's Influencer program and receive a monthly fee for using their TradingView charts in my analysis.
Like and subscribe and comment my ideas if you enjoy them!

GBPUSD Will Go Up! Buy!
Take a look at our analysis for GBPUSD.
Time Frame: 8h
Current Trend: Bullish
Sentiment: Oversold (based on 7-period RSI)
Forecast: Bullish
The market is on a crucial zone of demand 1.370.
The oversold market condition in a combination with key structure gives us a relatively strong bullish signal with goal 1.378 level.
P.S
Please, note that an oversold/overbought condition can last for a long time, and therefore being oversold/overbought doesn't mean a price rally will come soon, or at all.
Disclosure: I am part of Trade Nation's Influencer program and receive a monthly fee for using their TradingView charts in my analysis.
Like and subscribe and comment my ideas if you enjoy them!

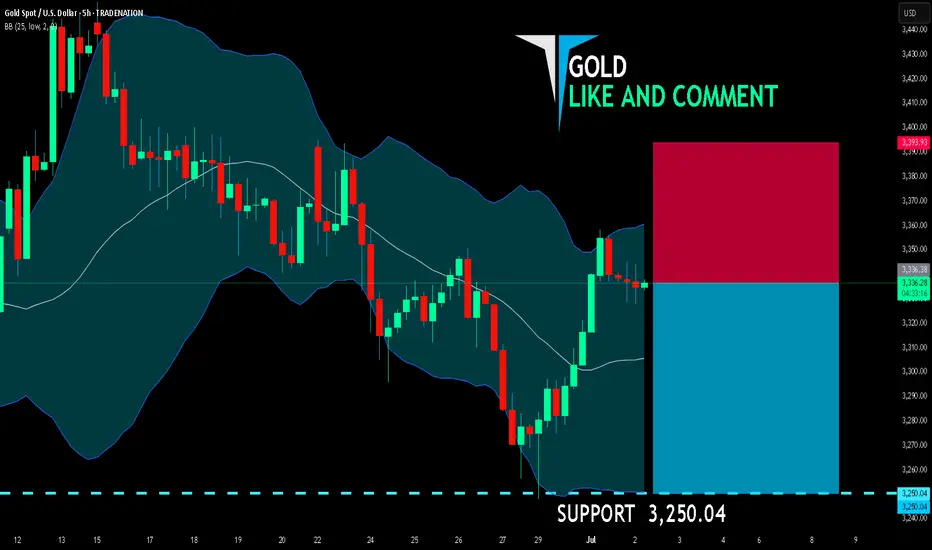
GOLD BEARS ARE STRONG HERE|SHORT
GOLD SIGNAL
Trade Direction: short
Entry Level: 3,336.38
Target Level: 3,250.04
Stop Loss: 3,393.93
RISK PROFILE
Risk level: medium
Suggested risk: 1%
Timeframe: 5h
Disclosure: I am part of Trade Nation's Influencer program and receive a monthly fee for using their TradingView charts in my analysis.
✅LIKE AND COMMENT MY IDEAS✅
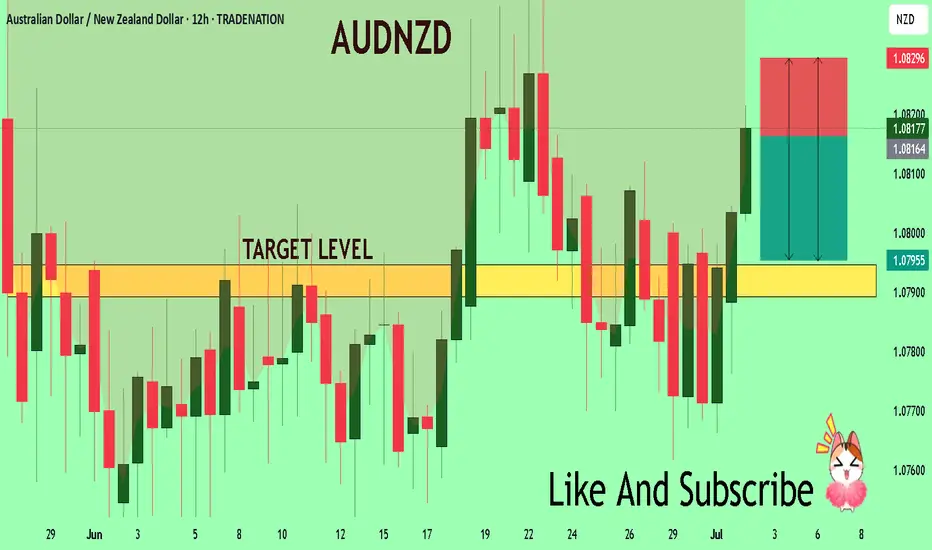
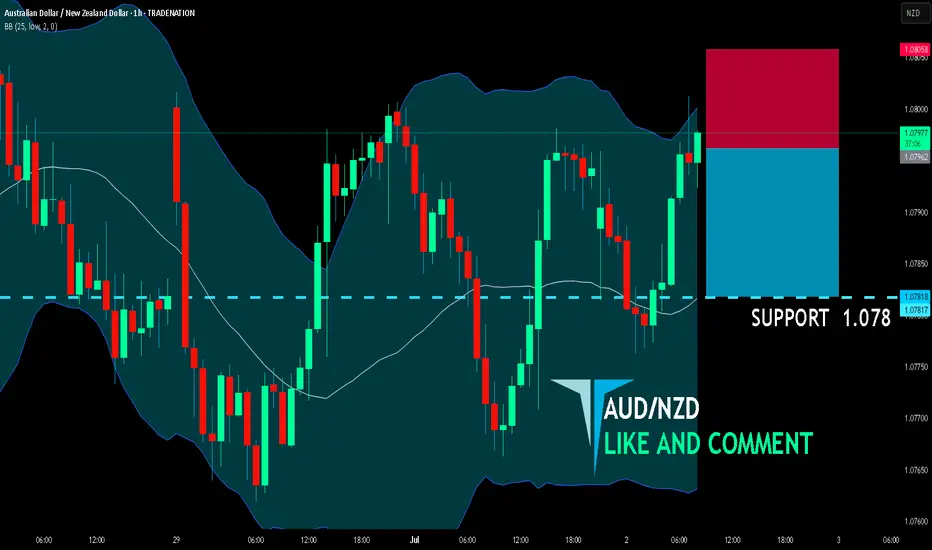
AUD/NZD SHORT FROM RESISTANCE
AUD/NZD SIGNAL
Trade Direction: short
Entry Level: 1.079
Target Level: 1.078
Stop Loss: 1.080
RISK PROFILE
Risk level: medium
Suggested risk: 1%
Timeframe: 1h
Disclosure: I am part of Trade Nation's Influencer program and receive a monthly fee for using their TradingView charts in my analysis.
✅LIKE AND COMMENT MY IDEAS✅
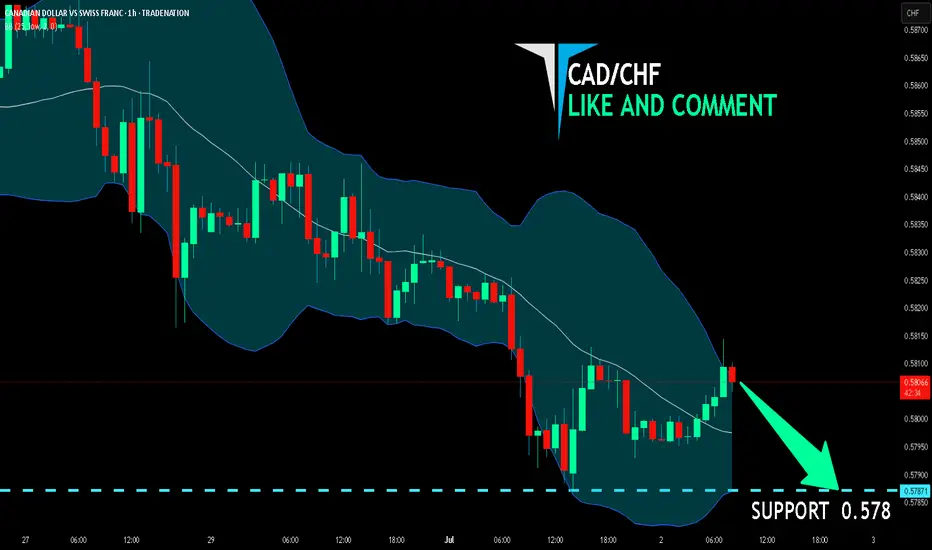
CAD/CHF BEARS WILL DOMINATE THE MARKET|SHORT
Hello, Friends!
We are targeting the 0.578 level area with our short trade on CAD/CHF which is based on the fact that the pair is overbought on the BB band scale and is also approaching a resistance line above thus going us a good entry option.
Disclosure: I am part of Trade Nation's Influencer program and receive a monthly fee for using their TradingView charts in my analysis.
✅LIKE AND COMMENT MY IDEAS✅
AUD/JPY SENDS CLEAR BEARISH SIGNALS|SHORT
Hello, Friends!
We are now examining the AUD/JPY pair and we can see that the pair is going up locally while also being in a uptrend on the 1W TF. But there is also a powerful signal from the BB upper band being nearby, indicating that the pair is overbought so we can go short from the resistance line above and a target at 93.578 level.
Disclosure: I am part of Trade Nation's Influencer program and receive a monthly fee for using their TradingView charts in my analysis.
✅LIKE AND COMMENT MY IDEAS✅

Kalyan Jewellers is going to touch the target soon.kalyan jewellers stock is on bullish structure now and our next target is marked with green line ,just waiting for the target.

Gold Trading Strategy June 27✏️The price reaction at 3348 forms a sustainable bearish structure. 3296 is an important zone when broken, it will continue to fall deeply without any recovery on Friday.
Today the downtrend will encounter less resistance than the uptrend. Therefore, it is not difficult to touch the support zones of 3278 and 3255.
Any recovery in the price in the European session is considered a good opportunity for a Sell signal towards the target of 3278 and 3255.
As analyzed, the SELL zone today is noted at many resistance zones and consider the price reaction for the SELL signals.
📈 Key Levels
Break out: 3296
Support: 3278-3255
Resistance: 3300-3312-3325-3336-3348-3363
📊 Recommended Trade Setups
BUY 3278-3276 SL 3272
SELL 3325-3327 SL 3330

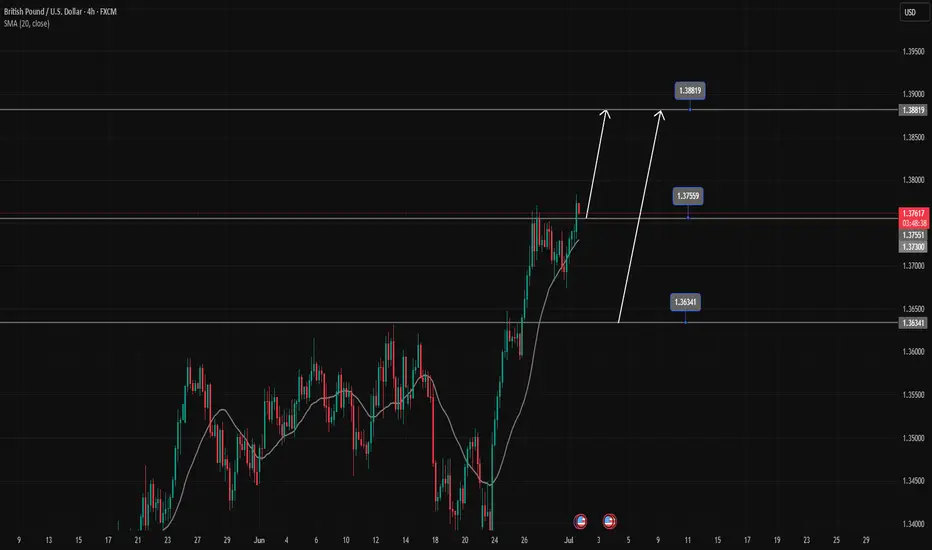
GBPUSD's strong uptrend continuesGBPUSD is in a strong uptrend, Price has just broken the resistance zone of 1.37500.
All the bullish momentum is heading towards the resistance zone of 1.388.
If there is a close of the h4 candle below the resistance zone of 1.375, there will likely be a Pullback to 1.363 to find more buying momentum towards the target at the resistance zone of 1.388
📈 Key Levels
Support: 1.375-1.363
Resistance: 1.388
📊 Recommended Trade Setups
BUY GBPUSD 1.375-1.373 Stoploss 1.37000
BUY GBPUSD 1.363-1.361 Stoploss 1.35800
SELL GBPUSD 1.388-1.390 Stoploss 1.39300