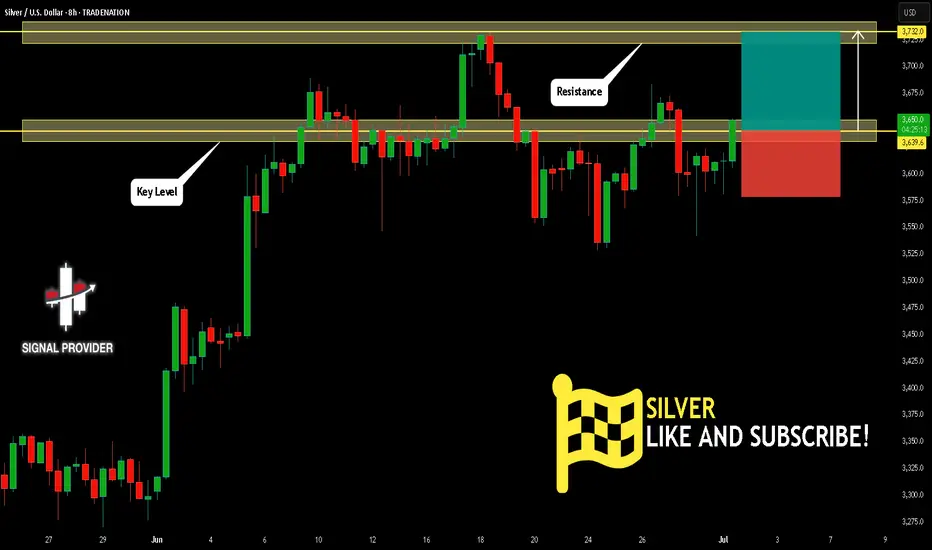
SILVER Will Move Higher! Long!
Please, check our technical outlook for SILVER.
Time Frame: 8h
Current Trend: Bullish
Sentiment: Oversold (based on 7-period RSI)
Forecast: Bullish
The price is testing a key support 3,639.6.
Current market trend & oversold RSI makes me think that buyers will push the price. I will anticipate a bullish movement at least to 3,732.0 level.
P.S
The term oversold refers to a condition where an asset has traded lower in price and has the potential for a price bounce.
Overbought refers to market scenarios where the instrument is traded considerably higher than its fair value. Overvaluation is caused by market sentiments when there is positive news.
Disclosure: I am part of Trade Nation's Influencer program and receive a monthly fee for using their TradingView charts in my analysis.
Like and subscribe and comment my ideas if you enjoy them!
Trading
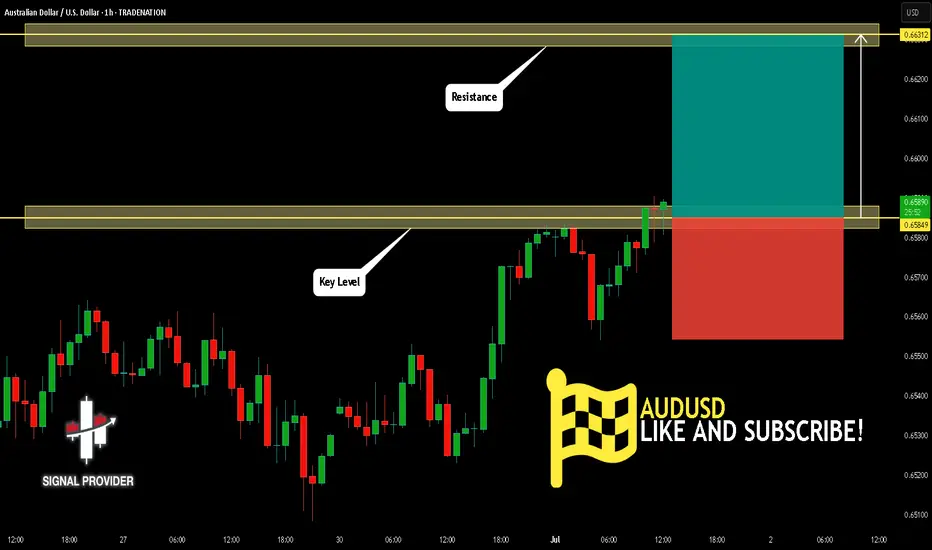
AUDUSD Is Bullish! Buy!
Here is our detailed technical review for AUDUSD.
Time Frame: 1h
Current Trend: Bullish
Sentiment: Oversold (based on 7-period RSI)
Forecast: Bullish
The market is trading around a solid horizontal structure 0.658.
The above observations make me that the market will inevitably achieve 0.663 level.
P.S
We determine oversold/overbought condition with RSI indicator.
When it drops below 30 - the market is considered to be oversold.
When it bounces above 70 - the market is considered to be overbought.
Disclosure: I am part of Trade Nation's Influencer program and receive a monthly fee for using their TradingView charts in my analysis.
Like and subscribe and comment my ideas if you enjoy them!
CADJPY Is Very Bearish! Short!
Take a look at our analysis for CADJPY.
Time Frame: 4h
Current Trend: Bearish
Sentiment: Overbought (based on 7-period RSI)
Forecast: Bearish
The market is testing a major horizontal structure 105.190.
Taking into consideration the structure & trend analysis, I believe that the market will reach 104.340 level soon.
P.S
Overbought describes a period of time where there has been a significant and consistent upward move in price over a period of time without much pullback.
Disclosure: I am part of Trade Nation's Influencer program and receive a monthly fee for using their TradingView charts in my analysis.
Like and subscribe and comment my ideas if you enjoy them!

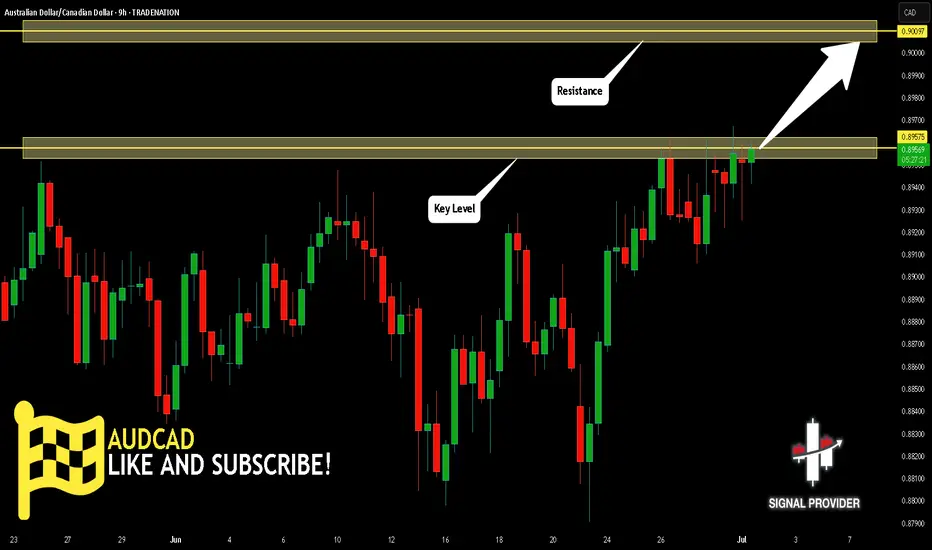
AUDCAD Is Going Up! Long!
Please, check our technical outlook for AUDCAD.
Time Frame: 9h
Current Trend: Bullish
Sentiment: Oversold (based on 7-period RSI)
Forecast: Bullish
The market is approaching a key horizontal level 0.895.
Considering the today's price action, probabilities will be high to see a movement to 0.900.
P.S
Please, note that an oversold/overbought condition can last for a long time, and therefore being oversold/overbought doesn't mean a price rally will come soon, or at all.
Disclosure: I am part of Trade Nation's Influencer program and receive a monthly fee for using their TradingView charts in my analysis.
Like and subscribe and comment my ideas if you enjoy them!
AUDUSD: Bullish Continuation After Breakout 🇦🇺🇺🇸
AUDUSD is going to rise more following a bullish breakout
of a key daily/intraday horizontal resistance.
Next goal - 0.66
❤️Please, support my work with like, thank you!❤️
I am part of Trade Nation's Influencer program and receive a monthly fee for using their TradingView charts in my analysis.

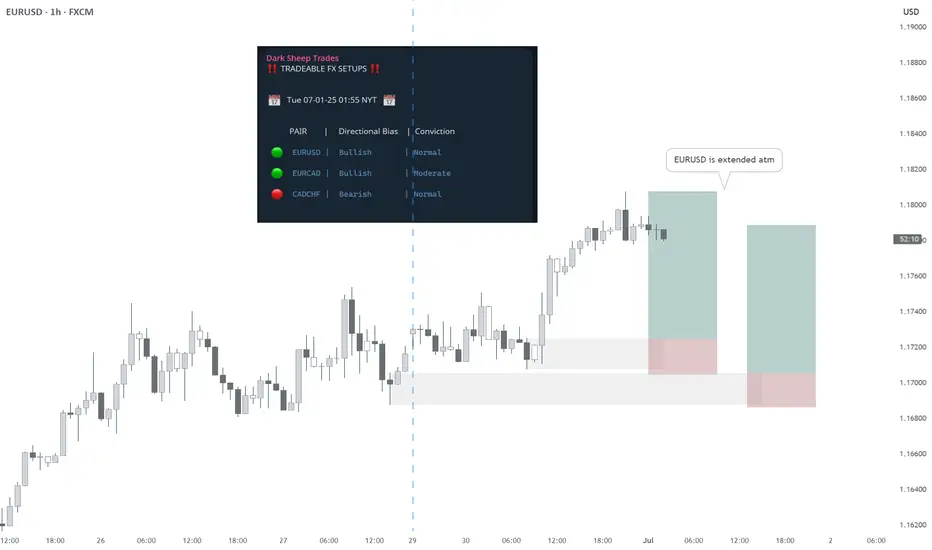
EURUSD BUY - Statistically-backed FX shortlistEURUSD BUY
Daily Outlook: Statistically-backed FX shortlist
@darksheeptrades
BITCOIN BEARS ARE GAINING STRENGTH|SHORT
BITCOIN SIGNAL
Trade Direction: short
Entry Level: 106,743.04
Target Level: 99,806.18
Stop Loss: 111,349.12
RISK PROFILE
Risk level: medium
Suggested risk: 1%
Timeframe: 1D
Disclosure: I am part of Trade Nation's Influencer program and receive a monthly fee for using their TradingView charts in my analysis.
✅LIKE AND COMMENT MY IDEAS✅

XAUUSD Analysis – 01/07: Gold Sees a Rebound Amid USD WeaknessXAUUSD Analysis – 01/07: Gold Sees a Rebound Amid USD Weakness – Is a Recovery on the Cards?
As we enter the new month, gold prices are showing signs of recovery after a significant drop, primarily driven by the weakening of the US Dollar. However, despite some positive momentum, the path to sustained growth remains uncertain.
💵 USD Weakness Fuels Gold's Potential Rebound
Recent US economic data shows a slight decrease in consumer spending, which has led to speculation that the Federal Reserve may ease interest rate hikes in the near future.
This, in turn, has contributed to a weaker USD, providing an opportunity for gold to recover slightly.
⚖️ The Federal Reserve's Role Remains Critical
The markets are awaiting further clues on the Federal Reserve's next moves, especially with the ongoing debate about the potential direction of interest rates.
While the recent economic data isn't weak enough to force a policy reversal, it hasn't been strong enough to give the Fed the confidence to continue its hawkish stance either.
🧠 What Does This Mean for Traders?
Gold is responding to macroeconomic factors but still lacks a clear, strong trend.
Volatility remains high, with sharp price fluctuations occurring after key economic and political announcements. This uncertainty suggests gold might not yet have the momentum for a definitive break-out or trend reversal.
🔶 Summary:
Gold is starting to recover after a tough month but the outlook remains cautious.
Buyers are hoping for a Fed rate cut, while sellers are banking on the USD's strength.
Traders should stay vigilant, waiting for clear confirmation before making major moves.
📊 Key Levels to Watch:
Resistance Levels: 3358 – 3360 – 3364 – 3375 – 3380
Support Levels: 3300 – 3290 – 3280 – 3275
🎯 Trading Strategy:
🔵 Buy Zone:
Entry: 3310 – 3315
SL: 3300
TP: 3320 – 3330 – 3340 – 3350 – 3360
🔴 Sell Zone:
Entry: 3370 – 3375
SL: 3380
TP: 3360 – 3350 – 3340 – 3325
⚠️ Final Thoughts:
With USD weakness persisting, gold may continue its rebound, but the market remains uncertain.
Keep an eye on macroeconomic data and geopolitical events, as they will likely shape gold's next move.

Critical Channel Watch Begins on the 1-Hour Chart of USDJPY.Hey everyone,
📉 My Latest USDJPY Analysis:
USDJPY is currently moving within a downtrend. If the price breaks below the lower boundary of the parallel channel, our first target level will be 142.910. The most crucial factor here is the downward breakout of that channel—don’t overlook it.
Also, keep a close eye on key economic data releases on the fundamental side, as they could significantly influence your strategy.
I meticulously prepare these analyses for you, and I sincerely appreciate your support through likes. Every like from you is my biggest motivation to continue sharing my analyses.
I’m truly grateful for each of you—love to all my followers💙💙💙

GBP/NZD BEST PLACE TO BUY FROM|LONG
Hello, Friends!
Bullish trend on GBP/NZD, defined by the green colour of the last week candle combined with the fact the pair is oversold based on the BB lower band proximity, makes me expect a bullish rebound from the support line below and a retest of the local target above at 2.267.
Disclosure: I am part of Trade Nation's Influencer program and receive a monthly fee for using their TradingView charts in my analysis.
✅LIKE AND COMMENT MY IDEAS✅

EURGBP: Strong Bullish Confirmation 🇪🇺🇬🇧
EURGBP is going to continue rising in an uptrend
that the pair established at the end of May.
A completion of a consolidation and a formation of a new local Higher High
indicate a highly probable bullish continuation soon.
Next resistance - 0.8605
❤️Please, support my work with like, thank you!❤️
I am part of Trade Nation's Influencer program and receive a monthly fee for using their TradingView charts in my analysis.

Gold price analysis July 1On the D1 chart, the price has recovered positively when the candle closed above 50% of the decrease range of last Friday's session. This shows that buying power is returning and a new uptrend is forming, with the target heading towards the GAP zone around 3363.
Today's trading strategy:
Prioritize buying (BUY) if the price has a correction to the support zone of 3300.
Sell strategy should only be implemented at important resistance zones, with short-term profit expectations because the main trend is leaning towards the uptrend.
Important technical levels:
Support: 3300 - 3337 - 3360
Resistance: 3334 - 3348 - 3363

Another RR2 Position On EURUSDThesis: EUR/USD is showing signs of exhaustion near the 1.1800 psychological resistance, with price rejecting the upper band of a recent range.
Entry: 🔻 Sell at 1.17883 (current price action confirms rejection)
Stop-Loss: 🔺 1.17943 – Above recent swing high and psychological resistance
Take-Profit: ✅ 1.17767 – Targeting the lower bound of the recent range and prior support
Risk-Reward Ratio: ~1:2 – High conviction setup with tight risk and extended downside potential

July Seasonality Patterns For Index, Metals and ForexSeasonality can be a useful tool if used wisely (and in context) with current sentiment and news flows. Seasonality really is a backwards looking indicator that can easily be overpowered by key macro drivers. But its strength comes in to play when seasonality aligns with the macro landscape.
With that in mind, I share my seasonality matrix for indices, metals and USD FX pairs to highlight potential patterns for July, then wrap up with an update on my Nasdaq 100 analysis.
Matt Simpson, Market Analyst at City Index and Forex.com.

QQQ Nasdaq 100 Year-End Price Target and Technical Rebound SetupIf you haven`t bought the previous oversold area on QQQ:
Now the Nasdaq-100 ETF (QQQ), which tracks the performance of the largest non-financial companies in the Nasdaq, has recently entered oversold territory, suggesting that a technical rebound may be imminent. Similar to the Russell 2000, QQQ has experienced significant selling pressure, driving key technical indicators into oversold zones and creating favorable conditions for a bounce.
The Relative Strength Index (RSI) has dropped below 30, a level that typically signals oversold conditions and the potential for a reversal. Additionally, QQQ is trading near key support levels, with a large portion of its components underperforming their 50-day and 200-day moving averages — a classic setup for a mean reversion rally.
From a historical perspective, QQQ has shown a tendency to rebound strongly after similar oversold conditions, particularly when macroeconomic factors stabilize and buying pressure returns. Given the current technical setup, my price target for QQQ is $550 by the end of the year. This represents a recovery of approximately 8-10% from current levels, aligning with previous post-oversold rallies in the index.
While downside risks remain — including potential volatility around Federal Reserve policy and broader economic data — the technical backdrop suggests that QQQ is well-positioned for a recovery in the coming months.

GOOGL is facing resistance 181.11NASDAQ:GOOGL
Google is in uptrend . Currently it is facing the resistance 181.11.
It has slightly pull backed from the resistance.
Pattern : Ascending channel - a bullish chart pattern. To valid this pattern the price has to consistently make higher highs and higher lows. But the price is now facing the resistance 181.11 To make higher high it has to break it.
If it fails to break the resistance , sideways trend may be seen here for short period of time and bullish momentum may become weak.
Note :
If you’re interested in receiving detailed technical analysis reports on your selected stocks, feel free to reach out to me. I can provide you with customized reports covering trends, key levels, momentum, patterns, and price projections to support your trading or investment decisions.

Nightly $SPY / $SPX Scenarios for July 1, 2025 🔮 Nightly AMEX:SPY / SP:SPX Scenarios for July 1, 2025 🔮
🌍 Market-Moving News 🌍
📊 Core Inflation Edges Higher
May’s core inflation rose unexpectedly to 2.7% year-over-year, up from 2.6%, casting uncertainty over the Fed’s timeline for rate cuts. While headline CPI sits at 2.3%, the resilience in underlying prices complicates policymakers’ projections for later this year
💵 Weak Dollar, Rising Rate-Cut Bets
Markets are reacting to “summertime data”—like the core CPI uptick—with renewed optimism. Traders now see up to 75 bps in Fed rate cuts later this year, while the dollar remains near 3½-year lows on concerns about Powell’s independence and trade developments
🇨🇦 U.S.–Canada Trade Talks Resume
Trade talks between the U.S. and Canada restarted today, following Ottawa’s suspension of its digital-services tax. Progress toward a broader agreement could reduce tariff risk and offer further relief to risk assets
📊 Key Data Releases & Events 📊
📅 Tuesday, July 1:
All Day – U.S.–Canada Trade Talks
Markets will watch for updates on tariff resolution and broader trade deals. Any breakthrough could notably boost equities and improve trade sentiment.
10:00 AM ET – ISM Manufacturing PMI (June)
A below-50 reading again would reinforce the narrative of industrial weakness. A rebound could support equities and temper recession concerns
10:00 AM ET – JOLTS Job Openings (May)
Still at elevated levels (~7.39 million in April), this metric assesses labor-market resilience. A decline could shift rate-cut expectations.
⚠️ Disclaimer:
This is for educational and informational purposes only. It does not constitute financial advice. Consult a licensed financial advisor before investing.
📌 #trading #stockmarket #economy #news #trendtao #charting #technicalanalysis

NZD_JPY WAIT FOR BREAKOUT|LONG|
✅NZD_JPY is trading in an
Uptrend and the pair has formed
A bullish triangle pattern
And we are bullish biased
So IF we see a bullish breakout
It will be our signal that
A bullish continuation is
Likely and we will be
Able to enter a long trade
LONG🚀
✅Like and subscribe to never miss a new idea!✅
Disclosure: I am part of Trade Nation's Influencer program and receive a monthly fee for using their TradingView charts in my analysis.

GOLD Short From Resistance! Sell!
Hello,Traders!
GOLD made a bullish
Rebound from the support
Below just as we predicted in
Our previous analysis but
Gold is still trading in the
Downtrend as the lower lows
And higher highs are intact
And the structure is healthy
So after the price retested the
Horizontal resistance above
Around 3,310$ we are
Likely to see a further
Bearish move down
Sell!
Comment and subscribe to help us grow!
Check out other forecasts below too!
Disclosure: I am part of Trade Nation's Influencer program and receive a monthly fee for using their TradingView charts in my analysis.

CAD_CHF WILL KEEP FALLING|SHORT|
✅CAD_CHF broke the key structure level of 0.5840
While trading in a strong downtrend
Which makes me bearish
And I think that after the retest of the broken level is complete
A rebound and bearish continuation will follow
SHORT🔥
✅Like and subscribe to never miss a new idea!✅
Disclosure: I am part of Trade Nation's Influencer program and receive a monthly fee for using their TradingView charts in my analysis.

CAD-JPY Bullish Bias! Buy!
Hello,Traders!
CAD-JPY keeps trading
In an uptrend along the
Rising support line and
We are already seeing a
Bullish rebound so we are
Bullish biased and we will
Be expecting a further
Bullish move up
Buy!
Comment and subscribe to help us grow!
Check out other forecasts below too!
Disclosure: I am part of Trade Nation's Influencer program and receive a monthly fee for using their TradingView charts in my analysis.

GOLD WILL FALL|SHORT|
✅GOLD is trading in a
Downtrend and the price is
Making a typical rebound but
After the horizontal resistance
Level above around 3,300$ is
Retested we will be expecting
A further bearish move down
SHORT🔥
✅Like and subscribe to never miss a new idea!✅
Disclosure: I am part of Trade Nation's Influencer program and receive a monthly fee for using their TradingView charts in my analysis.

BTC Consolidates Above $100K — Bullish Structure Remains IntactKey Support Holding Firm:
Bitcoin is consolidating above the critical $100,000–$105,000 support zone, a former resistance area from early 2025. Holding this level preserves the broader bullish structure.
Short-Term Noise, Long-Term Strength:
While recent price action shows some lower highs and lows, the long-term uptrend that began in April remains fully intact. This is typical consolidation behavior within a strong bull market.
Wedge Formation Points to Breakout:
A six-month wedge pattern continues to develop, often a precursor to a powerful breakout. If resolved to the upside, the next leg could target the $130,000–$135,000 range.
Outlook Remains Bullish:
As long as Bitcoin holds above $100,000, there’s no technical basis for a bearish scenario. This remains a constructive pause within a dominant uptrend.
#Bitcoin #BTC #CryptoMarket #TechnicalAnalysis #Bullish #SupportAndResistance #WedgeBreakout #LongTermTrend #MarketOutlook #PriceAction
