ETH's Situation, A Comprehensive Analysis !!!As I said, and no one believed, the cup and handle pattern has completed and broken out, which could quickly drive the price above $4000.
previous Analysis
Best regards CobraVanguard.💚
Tradinganalysis

META Shares Signal Major Reversal Risk Amid Potential 2B Top PatThe shares of META, the NASDAQ-listed owner of Facebook, recently reached overbought levels as the stock price rose above its upper Bollinger Band and its Relative Strength Index climbed above 70. This suggests that META is likely to enter a period of sideways consolidation or perhaps experience a sharp decline.
However, traders should also pay close attention to a potentially larger reversal pattern known as a 2B top, which may currently be forming.
A 2B top is similar to a double top pattern, but typically the second high slightly exceeds the prior high before reversing. In this case, the high on 30 June 2025 exceeded the previous high set on 14 February 2025. The stock then fell sharply on 1 July, and if it continues to decline below support at $700, this would confirm the 2B topping reversal pattern.
Additionally, a break below support at $700 would signal the end of the uptrend that began on 1 May and also push the price below the 10-day exponential moving average, further confirming a trend reversal.
A decline below $700 could see the shares fall significantly, potentially erasing much of the gains recorded following the US-China trade negotiations held in Switzerland on May 12.
Notably, a price gap exists at $593, created by the announcement following those talks.
Alternatively, if the stock holds support at $700 and continues the uptrend, the 2b top is invalidated, and traders should look for even higher prices from this AI giant. The nice thing about the 2b topping pattern is that it provides an easy-to-identify invalidation price, which in this case would be above $748.
Written by Michael J. Kramer, founder of Mott Capital Management.
Disclaimer: CMC Markets is an execution-only service provider. The material (whether or not it states any opinions) is for general information purposes only and does not take into account your personal circumstances or objectives. Nothing in this material is (or should be considered to be) financial, investment or other advice on which reliance should be placed.
No opinion given in the material constitutes a recommendation by CMC Markets or the author that any particular investment, security, transaction, or investment strategy is suitable for any specific person. The material has not been prepared in accordance with legal requirements designed to promote the independence of investment research. Although we are not specifically prevented from dealing before providing this material, we do not seek to take advantage of the material prior to its dissemination.

Bitcoin Uptrend Momentum, Key Buy Zone at 106.3K–105.9K__________________________________________________________________________________
Technical Overview – Summary Points
__________________________________________________________________________________
Momentum : Uptrend confirmed across all timeframes ≥1H; no signs of exhaustion or overheating.
Major supports : 106,319, 99,581, 98,133 USD
Major resistances : 108,239, 108,685, 111,949 USD (ATH)
Volume : Normal on higher TFs, very high on 30min/15min (potential breakout or institutional shake-out).
Behavior : Risk On / Risk Off Indicator = Strong Buy from 1D to 1H, neutral on 15min; ISPD DIV neutral across all TFs (no extreme behaviors).
__________________________________________________________________________________
Strategic Summary
__________________________________________________________________________________
Bias : Bullish as long as 98,133 is held on daily closes; structural buying pressure confirmed.
Opportunities : Swing accumulation on pullbacks to 106,319–105,900; targeting 108,700 then 111,949 on breakouts.
Risk : Geopolitical catalyst or break below D Pivot Low 98,133.
Macro catalyst : No major events (Fed, CPI, NFP) over the next 48h. Watch Powell’s speech (2 July).
Action Plan : Long entry on pullback to 106,300–105,900, stop <105,900, targets at 108,700 then 111,900. Exit on daily close below 98,133.
__________________________________________________________________________________
Multi-Timeframe Analysis
__________________________________________________________________________________
1D – Daily : Strong uptrend; balanced volumes; supports at 98,134 / 99,581; resistance at 108,239–111,949.
12H/6H/4H : Positive confluence. Accumulate on any return to support; no behavioral excesses detected.
2H–1H : Rising volumes, no divergences; strong timing for entries on dips.
30min/15min : Very high volume (breakout/shake-out); structure remains bullish. 15min Risk On / Risk Off Indicator =Neutral → watch for short-term consolidation or traps but broader trend holds.
Clear bullish confluence on all TFs ≥1H, with no behavioral or macro warning.
Short-term risks on micro-TFs (extreme volume, possible shake-out).
Accumulation zone on 106,300–105,900 pullbacks, invalidation below 98,133.
__________________________________________________________________________________
Cross-Analysis & Strategic Synthesis
__________________________________________________________________________________
Trend : No reversal signals. All indicators (volume, price action, Risk On / Risk Off Indicator) point to trend continuation.
Macro & newsflow : Monetary status quo, no negative catalyst in the short term. Only open risk: geopolitical tensions, closely monitored.
On-chain & fund flows : Ongoing ETF inflows, stable capitals, strong HODL trend, SSR stable.
Risk management : Stop <105,900, hedge on geopolitical signals.
Summary:
All TFs ≥1H aligned in bullish cycle, corrections = structured long accumulation opportunities.
Key buy zone: 106,300 – 105,900; prudent stop <105,900; main targets 108,700 and ATH.
Closely monitor for Powell/Fed headlines.
__________________________________________________________________________________

AUD/USD Trade Zone!Firstly, we are in a news market right now and news is everything to understanding price action.
After a busy international weekend, AUD/USD opened strong to the sell side. We got the first initial push down last week when Iran attacked Israel. Then, this weekend, Trump struck Iran.
With Trump striking Iran, markets opened bearish initially. After the good news of Iran and Israel coming to peace, we are seeing markets start to rebound a bit.
Where we are currently in the markets is a good structural spot to make some moves. The market has been following a downtrend structure following the Lower-Low, Lower-High pattern and we are currently at the next lower high if the market is going to respect its current market structure.
I am preparing for sells in an overbought market, which is unsure of future international tensions. I am either waiting for a structure break where the gold line indicates or for the market to respect the current structure to play to the low side.
I will be back with future updates.

What Is T-Distribution in Trading? What Is T-Distribution in Trading?
In the financial markets, understanding T-distribution in probability is a valuable skill. This statistical concept, crucial for small sample sizes, offers insights into market trends and risks. By grasping T-distribution, traders gain a powerful tool for evaluating strategies, risks, and portfolios. Let's delve into what T-distribution is and how it's effectively used in the realm of trading.
Understanding T-Distribution
The T-distribution in probability distribution plays a crucial role in trading, especially in situations where sample sizes are small. William Sealy Gosset first introduced it under the pseudonym "Student". This distribution resembles the normal distribution with its bell-shaped curve but has thicker tails, meaning it predicts more outcomes in the extreme ends than a normal distribution would.
A key element of T-distribution is the concept of 'degrees of freedom', which essentially refers to the number of values in a calculation that are free to vary. It's usually the sample size minus one.
The degrees of freedom affect the shape of the T-distribution; with fewer degrees of freedom, the distribution has heavier tails. As the degrees of freedom increase, the distribution starts to resemble the normal distribution more closely. This is particularly significant in trading when dealing with small data sets, where the T-distribution provides a more accurate estimation of probability and risk than the normal distribution.
T-Distribution vs Normal Distribution
T-distribution and normal distribution are foundational in statistical analysis, yet they serve different purposes. While both exhibit a bell-shaped curve, the T-distribution has thicker tails, implying a higher probability of extreme values. This makes it more suitable for small sample sizes or when the standard deviation is unknown.
In contrast, the normal distribution, with its thinner tails, is ideal for larger sample sets where the standard deviation is known. Traders often use T-distribution for more accurate analysis in small-scale or uncertain data scenarios, while normal distribution is preferred for larger, more stable datasets, where extreme outcomes are less likely.
Application in Trading
In trading, T-distribution is a valuable tool for analysing financial data. It is primarily used in constructing confidence intervals and conducting hypothesis testing, which are essential for making informed trading decisions.
For instance, a trader might use T-distribution to test the effectiveness of a new trading strategy. Suppose a trader has developed a strategy using the technical analysis tools and wants to understand its potential effectiveness compared to the general market performance. They would collect a sample of returns from this strategy over a period, say, 30 days. Given the small sample size, using T-distribution is appropriate here.
The trader would then calculate the mean return of this sample and use T-distribution to create a confidence interval. This interval would provide a range within which the true mean return of the strategy is likely to lie, with a certain level of confidence. If this confidence interval shows a higher mean return than the market average, the trader might conclude that the strategy is potentially effective. However, it's important to note that this is an estimation and not a guarantee of future performance.
How to Plug Probability and Normal Distribution in Your T-Calculation
To use a T-calculator for integrating probability and normal distribution, follow these steps:
- Input Degrees of Freedom: For T-distribution, calculate the degrees of freedom (sample size minus one).
- Convert Z-Score to T-Value: If using normal distribution data, convert the Z-score (standard deviation units from the mean in a normal distribution) to a T-value using the formula: T = Z * (sqrt(n)), where 'n' is the sample size.
- Enter T-Value: Input this T-value into the calculator.
- Calculate Probability: The calculator will then output the probability, providing a statistical basis for trading decisions based on the T-distribution.
Limitations and Considerations of T-Distribution
While T-distribution is a powerful tool in trading analysis, it's important to recognise its limitations and considerations:
- Sample Size Sensitivity: T-distribution is most effective with small sample sizes. As the sample size increases, it converges to a normal distribution, reducing its distinct utility.
- Assumption of Normality: T-distribution assumes that the underlying data is approximately normally distributed. This may not hold true for all financial data sets, especially those with significant skewness or kurtosis.
- Degrees of Freedom Complications: Misestimating degrees of freedom can lead to inaccurate results. It's crucial to calculate this correctly based on the sample data.
- Outlier Sensitivity: T-distribution can be overly sensitive to outliers in the data, which can skew results.
Advanced Applications of T-Distribution in Trading
T-distribution extends beyond basic trading applications, playing a role in advanced financial analyses:
- Risk Modelling: Utilised in constructing sophisticated risk models, helping traders assess the probability of extreme losses.
- Algorithmic Trading: Integral in developing complex algorithms.
- Portfolio Optimisation: Assists in optimising portfolios by estimating returns and risks of various assets.
- Market Research: Used in advanced market research methodologies to analyse small sample behavioural studies.
The Bottom Line
The T-distribution is a powerful tool, offering nuanced insights in scenarios involving small sample sizes or uncertain standard deviations. Its ability to accommodate real-world data's quirks makes it invaluable for various trading applications, from strategy testing to risk assessment. However, understanding its limitations and proper application is crucial for accurate analysis.
This article represents the opinion of the Companies operating under the FXOpen brand only. It is not to be construed as an offer, solicitation, or recommendation with respect to products and services provided by the Companies operating under the FXOpen brand, nor is it to be considered financial advice.

Top M30 XAU/USD Trade Setups for Today – Buy & Sell Opportuniti📊📉📈 Gold (XAU/USD) is currently trading within a key support zone 🟣, retesting after a previous bullish breakout. If the price holds this zone and forms strong bullish candles, we could see a move toward the 3,366 resistance level 🔵 and potentially higher toward 3,389 📈. However, if the price breaks below this zone with strong bearish momentum, a drop toward 3,280 🔽 becomes likely. Watch the price action closely within this zone, as it could lead to a decisive move. ✅ Patience and confirmation are crucial to avoid false breakouts. 💡

"XAUUSD Double Setup After Massive Manipulation! 200+ Pips"🚨 Gold (XAUUSD) Smart Money Play Unfolding!
Here's a clean breakdown of the current structure and why this could be a high probability setup:
🔥 First, notice the manipulation zone — classic Smart Money move where liquidity was grabbed aggressively before a shift in market structure. This sets the stage for a bigger play.
📉 Change of Character (ChoCh) confirmed after the sweep, showing clear intent for price to reverse. This is the first signal that buyers are losing control and sellers are stepping in.
📍 First Key Area: Fair Value Gap (FVG)
Price is now retracing into the FVG.
This is our 1st Entry Setup opportunity.
High R/R setup if rejection happens around this level.
📍 Second Key Area: Order Block (OB)
A stronger zone for deeper mitigation.
If price pushes through the FVG, this OB becomes a prime entry spot.
This is the 2nd Setup for another potential short entry.
🏹 Targets and Pip Count:
Immediate target zone offers around 211 pips from the first setup.
Deeper target from second setup offers up to 253 pips move.
🧠 Market Structure & Psychology:
After manipulation, Smart Money always seeks to rebalance inefficiencies (FVG) and mitigate institutional orders (OB).
Weak lows created will likely be swept to fuel the bigger move down.
Multiple liquidity pools above and below current price hint at another round of liquidity hunting.
⚡ Game Plan:
Monitor price action reaction around FVG for short triggers.
If broken, reposition entries at the OB zone.
🚀 Risk Management Reminder:
Always use calculated risk per trade.
Don't chase; let price come to your zone.
Protect capital first, then maximize profits.
✍️ In summary:
This setup shows classic Smart Money Concepts in action: manipulation, structure shift, FVG, OB mitigation — all aligning for a clean bearish move. If executed with patience, this could be one of the smoothest setups of the week!
➡️ Comment "GOLD READY" if you’re stalking this setup with me!
➡️ Tag your trading buddy who needs to see this!

Trump Reassures on Trade and FedThe EUR/USD traded near 1.1350 on Friday, while the US Dollar Index rose above 99.5, recovering from earlier losses. The dollar strengthened after President Trump reassured markets that trade talks with China would continue, despite Beijing’s denials. Optimism also grew on reported progress with Japan and South Korea. Earlier, Treasury Secretary Bessent said US-China tariffs must be reduced significantly for real progress, increasing hopes for a deal. Trump also eased monetary policy concerns by stating he never planned to remove Fed Chair Powell. Although Cleveland Fed President Beth Hammack mentioned a rate cut in June if needed, renewed trade optimism lifted the dollar.
Key resistance is at 1.1460, followed by 1.1580 and 1.1680. Support lies at 1.1260, then 1.1200 and 1.1150.

Gold Stabilizes Near 3-Week LowGold steadied around $3,030 per ounce on Monday after falling over 1% to a three-week low. The drop sparked speculation that investors were taking profits or covering losses amid broader market declines driven by recession fears from escalating trade tensions. Fed Chair Jerome Powell warned that tariffs could raise inflation and slow growth, underscoring challenges for policymakers.
Key resistance is at $3,050, followed by $3,085 and $3,105. Support stands at $2,980, then $2,930 and $2830.

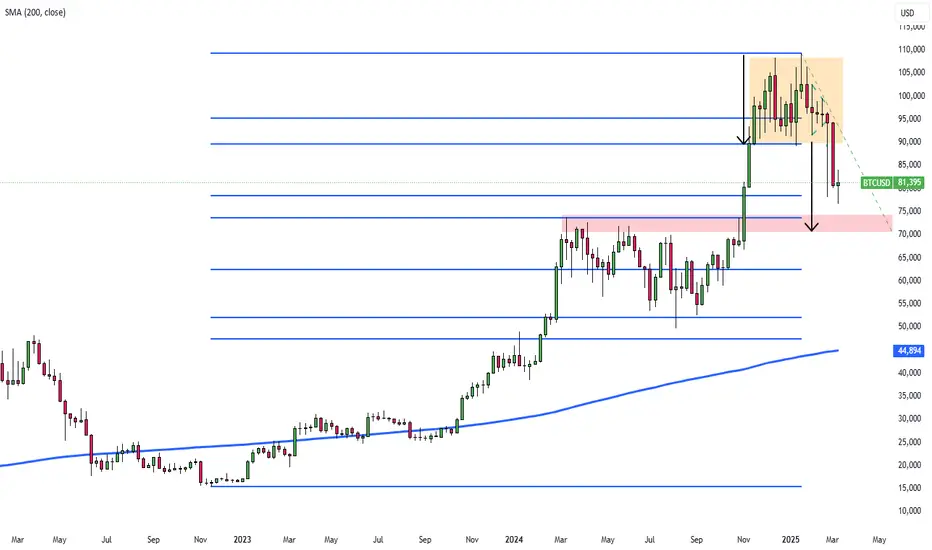
Bitcoin Drops 27% from Record High Amid Market SelloffBitcoin fell to $78,000 on Monday, down 27% from its all-time high, as crypto and stock markets lost a combined $6 trillion. Crypto market capitalization dropped 4% to $2.67 trillion, its lowest since November 9, shedding $1.2 trillion since December 17. Bitcoin hit a multi-month low, falling from its January peak of $107,000. Stocks mirrored the decline, with the S&P 500 losing $1.4 trillion—its worst single-day drop since 2022. The sharp selloff reflects a shift from risk assets, with the Fear and Greed Index plunging to 14, a two-year low, signaling extreme risk aversion. This contrasts with last year’s post-Trump election rally, where the index peaked at 92.
Technically, the first support for BTC is at $78k, with subsequent levels at FWB:73K and $65k. On the upside, the initial resistance is at GETTEX:89K , followed by $95k and $100k.
Bitcoin Outlook after the Dip. What to expect NOW?Bitcoin will break upwards at the end of this ascending triangle, and all of you will be astonished.
Give me some energy !!
✨We spend hours finding potential opportunities and writing useful ideas, we would be happy if you support us.
Best regards CobraVanguard.💚
_ _ _ _ __ _ _ _ _ _ _ _ _ _ _ _ _ _ _ _ _ _ _ _ _ _ _ _ _ _ _ _
✅Thank you, and for more ideas, hit ❤️Like❤️ and 🌟Follow🌟!
⚠️Things can change...
The markets are always changing and even with all these signals, the market changes tend to be strong and fast!!

XRP - A Quick Look at What's HappeningHave you noticed the parallel movements between Bitcoin (BTC) and XRP. It's a common phenomenon in the crypto market, while this is likely to be a short term move let's dive into why -
Given this strong correlation, here's how a drop in Bitcoin's price can influence XRP:
Direct Impact on Trading Pairs: XRP is often traded against BTC. So, if Bitcoin's value decreases, the value of XRP in relation to Bitcoin also tends to decrease.
Sentiment-Driven Selling: When Bitcoin's price drops, it can create a sense of fear and uncertainty among investors. This can lead to a widespread sell-off (herd mentality kicks in), with investors selling off their holdings of other cryptocurrencies, including XRP, to minimize potential losses OR to capitalize on profits made at the recent highs.
Algorithmic Trading: Many traders use automated trading systems that are programmed to react to Bitcoin's price movements. If Bitcoin's price drops below a certain threshold, these systems may automatically trigger sell orders for other cryptocurrencies, including XRP, which fuels the decline further,
Liquidity Cascades: Liquidity can dry up quickly, making it harder to find buyers for XRP. This means sellers might have to lower their prices to attract buyers, pushing the price down even further.
Chart Markup Explained:
While taking all these factors into consideration, we should also be mindful of the recent surge in price - this would have definitely attracted more investors and that allows us to start painting the technical picture at a more refined level. Supply and Demand dynamics are now more prevalent than ever.
Important Notes:
Just because BTC affects the way XRP moves doesn't mean that will always be the case. It's more like they're both reacting to the same underlying market forces. XRP has its own story, its own news, its own developments that can influence its price, regardless of what Bitcoin's doing. Sometimes, XRP even dances to its own tune (as explained in the previous published idea).
So, while Bitcoin's dips can definitely have a big impact on XRP, it's not the whole picture. Other factors are always at play, and it's important to look at the bigger context. Correlation doesn't equal causation, after all.

GOLD 1H CHART ROUTE MAP & TRADING PLAN FOR THE WEEKHey Everyone,
Please see our updated 1h chart levels and targets for the coming week.
We are seeing price play between two weighted levels with a gap above at 2778 and a gap below at 2768. We will need to see ema5 cross and lock on either weighted level to determine the next range.
We will see levels tested side by side until one of the weighted levels break and lock to confirm direction for the next range.
We will keep the above in mind when taking buys from dips. Our updated levels and weighted levels will allow us to track the movement down and then catch bounces up.
We will continue to buy dips using our support levels taking 30 to 40 pips. As stated before each of our level structures give 20 to 40 pip bounces, which is enough for a nice entry and exit. If you back test the levels we shared every week for the past 24 months, you can see how effectively they were used to trade with or against short/mid term swings and trends.
BULLISH TARGET
2778
EMA5 CROSS AND LOCK ABOVE 2778 WILL OPEN THE FOLLOWING BULLISH TARGET
2787
EMA5 CROSS AND LOCK ABOVE 2787 WILL OPEN THE FOLLOWING BULLISH TARGET
2797
EMA5 CROSS AND LOCK ABOVE 2797 WILL OPEN THE FOLLOWING BULLISH TARGET
2808
BEARISH TARGETS
2768
EMA5 CROSS AND LOCK BELOW 2768 WILL OPEN THE FOLLOWING BEARISH TARGET
2757
EMA5 CROSS AND LOCK BELOW 2757 WILL OPEN THE FOLLOWING BEARISH TARGET
2746
EMA5 CROSS AND LOCK BELOW 2746 WILL OPEN THE FOLLOWING BEARISH TARGET
2732
EMA5 CROSS AND LOCK BELOW 2732 WILL OPEN THE SWIG RAGE
SWING RANGE
2707 - 2697
As always, we will keep you all updated with regular updates throughout the week and how we manage the active ideas and setups. Thank you all for your likes, comments and follows, we really appreciate it!
Mr Gold
GoldViewFX

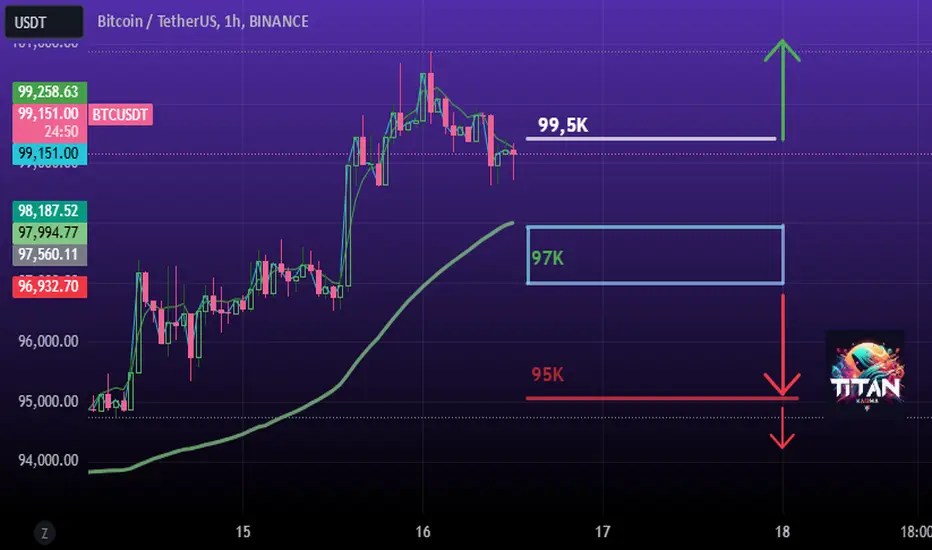
Thought about BTC chart analysisBelow is a structured, step-by-step technical analysis of the shared BTC/USDT chart (on a 30-minute timeframe) along with a possible short-term (next 12 hours) outlook. Please note this is not financial advice but rather a technical perspective for informational purposes.
1. Identify the Overall Context
Timeframe: The chart is set to the 30-minute interval, indicating short-term price action and intraday volatility.
Current Price Region: BTC appears to be trading in the mid/upper 98,000 range (as shown on the screenshot).
Recent Movement: Price fell sharply from around 102,000–103,000 down to approximately 97,000, and then recovered slightly to the 98,000–99,000 zone.
2. Key Indicators Visible
Bollinger Bands (Purple Area)
Bands are relatively wide, suggesting increased volatility.
Price is near or below the middle band, indicating slight bearish pressure in the short term.
Moving Averages
There appear to be at least two commonly used MAs:
A shorter-term MA (possibly 50-period) in yellow/orange.
A longer-term MA (possibly 200-period) in blue.
The price has fallen below the shorter-term MA, which can be a short-term bearish signal.
The price is hovering around or slightly under the longer-term MA (the 200 MA in blue), which typically acts as a stronger support or resistance.
Volume Profile (SVP HD Up/Down)
Shows volume-by-price bars on the right side.
Notable high-volume nodes around 99,000–100,000, suggesting a strong interest level where price may consolidate or reverse.
Another cluster of volume near 97,000, possibly acting as short-term support if price revisits that zone.
Volume Bars (Below the Chart)
A significant spike in volume during the sharp move downward from ~102,000 to ~97,000.
Post-drop volume appears moderate, suggesting some stabilization but not an aggressive recovery.
3. Short-Term Momentum Evaluation
Price Action Relative to Moving Averages
Trading below the 50-period MA often indicates short-term weakness.
If the price fails to reclaim the 50 MA, the market may remain under bearish pressure for the next few candles (each candle = 30 minutes).
Bollinger Band Position
If candles close near or below the lower Bollinger Band, oversold bounces are likely but not guaranteed.
If candles remain compressed below the midpoint of the bands, it tends to confirm near-term bearish or sideways sentiment.
Possible Divergence Signals
Without direct MACD/RSI data on the screenshot, we rely on the advanced divergence indicator “MIS Adv Div.” If it’s showing bullish divergence (not fully clear from the image), there could be a short-term bounce. If it’s showing bearish continuation, the downward trend may persist.
4. Support and Resistance Levels
Immediate Resistance
Around 99,000–99,500: This area aligns with the lower side of a high-volume zone and the short-term MA.
Around 100,000–101,000: A psychologically significant level and also near the previous swing highs and volume node.
Immediate Support
Around 97,000: Where price found an initial bounce on the large sell-off.
Around 95,000: The next potential zone if 97,000 breaks.
5. Short-Term (Next 12 Hours) Price Outlook
Likely Scenario (Sideways to Slight Rebound)
The price may range between 97,000 (support) and 99,500 (local resistance).
If buyers step in at 97,000 again, expect a mild recovery toward the 99,000–100,000 region.
Bullish Breakout
If BTC reclaims the 99,500–100,000 zone with strong buying volume, it could target 100,500–101,000 next.
Watch for a 30-min candle close above the 50 MA to confirm potential upside momentum.
Bearish Continuation
If price fails to hold 97,000, a deeper retracement to 95,000 or lower may occur.
Sustained trading below the 200 MA would reinforce near-term bearish momentum.
GOLD ROUTE MAP UPDATEHey Everyone,
Another great day on the charts following on from the election move that gave the drop into the lower Goldturns and our weighted levels all giving bounces inline with our plans to buy dips.
The swing range is providing the swing although the full swing range level has not been tested. We also have the swing completing the retracement range and leaving a candle body close gap above 2696 opening 2724, which will be further confirmed by ema5 lock.
Our current range is now between 2640 and 2724 to play within, until we see a ema5 lock breakout to confirm the next range.
We will now come back Sunday with our updated Multi time-frame analysis, Gold route map and trading plans for the week ahead.
Have a smashing weekend!! And once again, thank you all for your likes, comments and follows, we really appreciate it!
Mr Gold
GoldViewFX

GOLD DAILY CHART UPDATEHey Everyone,
Great day on the charts today with our swing range doing exactly what it says on the tin. We got the big drop yesterday from the election volatility, yet our levels were still respected technically, providing the reactional bounce.
Swing range bounce gave us 2690. A close above this level will see the upper levels being retested again, keeping in mind the long range gap above on this chart idea. Failure to close above this level will see a retest on the swing range again.
We will keep the above in mind when taking buys from dips. Our updated levels and weighted levels will allow us to track the movement down and then catch bounces up.
Our long term bias is Bullish and therefore we look forward to drops like this, which allows us to continue to use our smaller timeframes to buy dips using our levels and setups.
Buying dips allows us to safely manage any swings rather then chasing the bull from the top.
Thank you all for your likes, comments and follows, we really appreciate it!
Mr Gold
GoldViewFX

Gold Analysis for upcoming move!Technical Perspective: Currently, XAU/USD is showing bullish momentum, with recent price action indicating a potential rally towards the 2760 resistance level. On the 1-hour timeframe, we have observed a clear Break of Structure (BOS) signaling strong buying interest. Key support is identified around 2730, which can serve as a solid entry point for long positions. Utilizing Fibonacci retracement levels, we see confluence around these areas, providing additional confirmation for a potential upward move. Traders should monitor momentum indicators like the RSI for overbought conditions as they approach the target.
Institutional Perspective: From an institutional standpoint, recent positioning data suggests that large players are accumulating long positions in gold, anticipating a continuation of inflationary pressures and geopolitical uncertainty. Central bank policies and market sentiment around safe-haven assets are driving institutional interest in XAU/USD. The influx of buying from hedge funds and other large entities could propel prices higher toward the 2760 level. It’s essential to consider market dynamics and liquidity events, as institutional traders may lead the price movements, creating opportunities for retail traders to align with the prevailing trend.

GOLD ROUTE MAP UPDATEHey Everyone,
Great start to the week with our chart idea playing out as analysed.
We got the Bullish target hit at 2655 and then no ema5 cross and lock above the level confirming the rejection. You can see the ema5 turning just before the level to perfection confirming the rejection foe the move down.
We are looking for support above 2633 to confirm rejection for another re-test above at 2655 or a cross and lock below 2633 will open the range below.
We will see levels tested side by side until one of the weighted levels break and lock to confirm direction for the next range.
We will keep the above in mind when taking buys from dips. Our updated levels and weighted levels will allow us to track the movement down and then catch bounces up.
We will continue to buy dips using our support levels taking 30 to 40 pips. As stated before each of our level structures give 20 to 40 pip bounces, which is enough for a nice entry and exit. If you back test the levels we shared every week for the past 24 months, you can see how effectively they were used to trade with or against short/mid term swings and trends.
BULLISH TARGET
2655 - DONE
EMA5 CROSS AND LOCK ABOVE 2655 WILL OPEN THE FOLLOWING BULLISH TARGET
2674
BEARISH TARGETS
2633
EMA5 CROSS AND LOCK BELOW 2633 WILL OPEN THE RETRACEMENT RANGE
RETRACEMENT RANGE
2611
EMA5 CROSS AND LOCK BELOW 2611 WILL OPEN THE SWING RANGE
SWING RANGE
2586 - 2558
As always, we will keep you all updated with regular updates throughout the week and how we manage the active ideas and setups. Thank you all for your likes, comments and follows, we really appreciate it!
Mr Gold
GoldViewFX

ETHEREUM - Time to buy again!The BINANCE:ETHUSDT is in a ascending triangle now which means the price will increase and also It is expected that the price would at least grow as good as the measured price movement(AB=CD). also a bullish Hidden Divergence (HD+) on MACD which shows Positive Signs for ETH.
Note: we should wait for the breaking of the triangle and than make a move, If the triangle breaks, we expect a new ATH to occur, but in new year.
✨We spend hours finding potential opportunities and writing useful ideas, we would be happy if you support us.
Best regards CobraVanguard .💚
_ _ _ _ __ _ _ _ _ _ _ _ _ _ _ _ _ _ _ _ _ _ _ _ _ _ _ _ _ _ _ _
✅Thank you, and for more ideas, hit ❤️Like❤️ and 🌟Follow🌟!
⚠️Things can change...
The markets are always changing and even with all these signals, the market changes tend to be strong and fast!!

GOLD 4H CHART ROUTE MAP & TRADING PLAN UPDATEHey Everyone,
Please see update on the 4H chart we traded last week. This weeks chart is still a continuation from last weeks chart as the chart is still in play and playing out perfectly, as we analysed. We only updated the retracement and swing range to accommodate the new range.
Last weeks range played out level to level like we analysed finished off with the last cross and lock above 2590 opening 2608 and 2626, which was completed perfectly finishing off the week at the last target.
We are seeing price between two weighted levels. We have 2626 Goldturn resistance and we have 2608, as Goldturn support.
We currently have a gap open above at 2626 and below at 2608 and will need ema5 cross and lock on either weighted level to determine the next range.
We will see levels tested side by side until one of the weighted levels break and lock to confirm direction for the next range.
We will keep the above in mind when taking buys from dips. Our updated levels and weighted levels will allow us to track the movement down and then catch bounces up.
We will continue to buy dips using our support levels taking 30 to 40 pips. As stated before each of our level structures give 20 to 40 pip bounces, which is enough for a nice entry and exit. If you back test the levels we shared every week for the past 24 months, you can see how effectively they were used to trade with or against short/mid term swings and trends.
BULLISH TARGET
2626
EMA5 CROSS AND LOCK ABOVE 2626 WILL OPEN THE FOLLOWING BULLISH TARGET
2645
POTENTIALLY 2664
EMA5 CROSS AND LOCK ABOVE 2664 WILL OPEN THE FOLLOWING BULLISH TARGET
2682
POTENTIALLY 2699
BEARISH TARGETS
2608
EMA5 CROSS AND LOCK BELOW 2608 WILL OPEN THE RETRACEMENT RANGE
RETRACEMENT RANGE
2590 - 2564
EMA5 CROSS AND LOCK BELOW 2564 WILL OPEN THE SWING RANGE
SWING RANGE
2545 - 2517
As always, we will keep you all updated with regular updates throughout the week and how we manage the active ideas and setups. Thank you all for your likes, comments and follows, we really appreciate it!
Mr Gold
GoldViewFX

THE KOG REPORTTHE KOG REPORT:
In last week’s KOG Report we said we would like to see price attempt an undercut low and then start the incline into the higher levels. We gave KOG’s bias of the week as bullish above 2385 with the targets for the week 2510, 2515 and 2530, which we all completed.
We then continued with the path shown in the updates while Excalibur tracked price taking us up into our final take profit target at 2580. Please have a look at the previous reports to see how the algo has tracked the price from the highs to the lows, lows to highs, no matter where it goes we've traded it and moved with the market. Hats off to the team!
A phenomenal week on Gold as well as the other pairs we trade.
So, what can we expect in the week ahead?
We have FOMC this week so shall await more choppy price action as well as the potential per-event range that may form from Tuesday onwards. We’re a little high to long at the moment which is what most traders will be thinking but sentiment is strong now so there is a chance they open and stretch this a little higher. For that reason, we will be waiting to see how last week’s high and the levels of 2580-83 react to the price if attacked in the early session. If rejected we feel an opportunity toto short is available into the lower levels of 2565 and below that 2555.
Many traders will now be looking for the 2600 level so please be careful as breaking above the 2585 level will make it a lot easier to be achieved during the early part of the week. Ideally, we want the pullback into the lower support regions and then want to assess the price action before attempting to go long and take this above 2600.
Due to FOMC this week this report will be provisional as we’ll update the idea specifically for FOMC before the release.
KOG’s bias for the week:
Bullish above 2550 with targets above 2600 and above that 2610
Bearish on break of 2550 with target below 2535
Please do support us by hitting the like button, leaving a comment, and giving us a follow. We’ve been doing this for a long time now providing traders with in-depth free analysis on Gold, so your likes and comments are very much appreciated.
As always, trade safe.
KOG

U.S. Michigan Consumer Sentiment Index.Today's key levels for gold indicate a bearish outlook. Technical analysis shows that gold has recently completed a growth structure, reaching around $2,509 per ounce, with current consolidation patterns forming below this peak. Expectations suggest a potential downward movement targeting levels like $2,468 and possibly down to $2,426
S1: $2,581.10
S2: $2,578.05
S3: $2,575.40
R1: $2,586.80
R2: $2,589.45
R3: $2,592.50
These levels can act as critical points where price action might either bounce back or break through.

GOLD ROUTE MAP UPDATEHey Everyone,
Another great day on the charts today with our chart idea playing out, as analysed.
Yesterday after hitting the bearish target 2567, we stated that we need ema5 to cross and lock below 2567 to open the retracement range for a test and failure to lock below 2567 and we will see the Goldlturns above being re-tested.
- No cross below 2567 confirmed the bounce and gave multiple bounces off this level of over 30 to 40 pips, just like we analysed and now left 2581 open for a re-test, which fell short by just a few pips.
We will see price range between 2567 and 2581, until we see a cross and lock on either level to confirm breakout to the next range.
We will keep the above in mind when taking buys from dips. Our updated levels and weighted levels will allow us to track the movement down and then catch bounces up.
We are taking extra caution with our buys in this new range, as bigger corrections are likely.
We will continue to buy dips using our support levels taking 30 to 40 pips. As stated before each of our level structures give 20 to 40 pip bounces, which is enough for a nice entry and exit. If you back test the levels we shared every week for the past 24 months, you can see how effectively they were used to trade with or against short/mid term swings and trends.
BULLISH TARGET
2581 - DONE
EMA5 CROSS AND LOCK ABOVE 2581 WILL OPEN THE FOLLOWING BULLISH TARGET
2591
EMA5 CROSS AND LOCK ABOVE 2591 WILL OPEN THE FOLLOWING BULLISH TARGET
2603
POTENTIALLY 2615
BEARISH TARGETS
2567 - DONE
EMA5 CROSS AND LOCK BELOW 2567 WILL OPEN THE RETRACEMENT RANGE
RETRACEMENT RANGE
2554 - 2538
EMA5 CROSS AND LOCK BELOW 2538 WILL OPEN THE SWING RANGE
SWING RANGE
2516 - 2506
As always, we will keep you all updated with regular updates throughout the week and how we manage the active ideas and setups. Thank you all for your likes, comments and follows, we really appreciate it!
Mr Gold
GoldViewFX
