NIO Dip $ Target we need to hold above our current support above the 8.95$ to confirm the reversal and breaking first the resistant at 9.33$, then go towards the 10.50$ resistant which will be a turning point for nio to confirm the reversal and enter in to bullish trend again.
however if we didn't hold above the 8$ support , we going towards the bottom for this year above the 5.60$+.
Tradinganalysis

GoldViewFX - Will we see similar price action to March 2021?Hey Everyone,
Just a quick Daily chart projection on similar chart pattern of March 2021 forming now.
Last time we saw a similar Double Bottom pattern forming like this was in March 2021, which followed with a Bullish movement of over 2000 pips.
We will obviously be tracking and trading the movement level to level on the lower time frames but keeping the potential of a similar long-term breakout in mind.
Please don't forget to like, comment and follow to support us, we really appreciate it!
GoldViewFX
XAUUSD TOP AUTHOR

GoldViewFX - 4H Chart Market UPDATEHey Everyone,
Another BOOOOM-TASTIC!!!! day for us at GVFX!!!!
We took two signal entries from support and banked clean pips and our members also covered both sells and buys with our ideas.
We shared this chart yesterday and it's playing out perfectly. We mentioned yesterday that price was challenging the half-line of the Goldturn channel and a break below this half-line will see price look to test channel support at 1624 Goldturn and potentially the full channel floor. This movement is now playing out and anyone trailing this should lock in profit now.
We are now waiting for support and a re-test to scope our next position. Our 1H chart Goldturn levels are still valid and can still be used to track this movement level to level.
We will continue to track this chart and keep you all updated with any changes. Please don't forget to like, comment and follow to support us, we really appreciate it!
GoldViewFX
XAUUSD TOP AUTHOR

GoldViewFX - 1H CHART UPDATED LEVELS & TARGETSHey Everyone,
Please see updated 1h chart Goldturns and targets for the coming week ahead.
As you can see, we finished off last week with strong movement down, range shifting into the new Rangebox by breaking 1646 Goldturn. This now opens 1637 Goldturn and should price maintain within the Rangebox we will see a challenge to the bottom of the rangebox down to 1620.
The key thing to notice here is; when a range shift takes place into the new rangebox, we need to see how this was challenged historically. We can see when price entered this rangebox previously we saw price re-test the entrance of the range box creating resistance before continuing the move down to test the bottom. This represents a retracement and therefore momentum from retracements can change direction. This is why any new range shifts are best traded after the re-test.
We will now wait patiently and continue to track and trade the movement with EMA5 cross and lock both ways confirming movement level to level.
BULLISH TARGETS
1646
1655
EMA5 CROSS AND LOCK ABOVE 1646 WILL OPEN 1657
BEARISH TARGETS
1637
1626
1620
EMA5 CROSS AND LOCK BELOW 1620 WILL OPEN 1605 AND 1592
SWING RANGE
1620
STRUCTURE SUPPORT
1592
As always, we will keep you all updated with regular updates throughout the week and how we manage the setups. Please don't forget to like, comment and follow to support us, we really appreciate it!
GoldViewFX
XAUUSD TOP AUTHOR

GoldViewFX - Market UPDATEHey Everyone,
Quick update.
As advised yesterday, we sat tight for NFP and used the momentum to take our entries and exits accordingly Goldturn to Goldturn. The NFP drop was supported by 1693 Goldturn and MA200. We were able to use the range to milk multiple entries and exits covering positions from yesterday's signal with our NFP entry also securing profits today. We are still well within the retracement and swing range setup and therefore continue to remain buying from dips.
We will now come back Sunday evening with our full multi-timeframe analysis and trading plans for the coming week. I hope you all enjoy the weekend!
Please don't forget to like, comment and follow to support us, we really appreciate it!
Enjoy your weekend!
GoldViewFX
XAUUSD TOP AUTHOR

MYEG: POTENTIAL UPWARD PROFIT 12%MYEG is forming a nice HH and HL and finding support level at 0.83, however volume is still low, if next bar show better volume can potential for an upward breakout to reach 1st resistance level at 0.91 and 2nd resistance level at 0.96.

BTCUSD - DOWN TO TEST 16700 & SIDEWAYSBTCUSD will test support level 17500 and move sideways in months to come until there is a clear signal for pivot and breaks 25000 level.

S&P: No Bottom Yet - To Test SupportS&P still IN downtrend and have not found bottom yet, to test support at 3600 level before it rise to test resistance at 3900.
Disclaimer
This information only serves as reference information and does not constitute a buy or sell call. Conduct your own research and assessment before deciding to buy or sell any stock.

GoldViewFX - Market UPDATEHey Everyone,
As you can see, price is still within the swing range and found support above 1620 Goldturn on market open. We then used our VIP intra-level cross and lock above 1630 to take a buy with a TP to 1638 below 1639 Goldturn for a safe exit, which played out perfectly BOOOM!!! Although we saw price go above 1639 Goldturn, it failed to close above this level confirming resistance.
Those following this chart without VIP access would have identified the EMA5 cross and lock above 1632 Goldturn opening 1639 TARGET, which again was HIT perfectly!!!
As highlighted already, our chart confirmed the open of the swing range. Therefore, we will continue to wait patiently for the right trades, as our setups are still valid. We will use the Goldturns to trade this level to level and the Goldturn support/resistance structures to track the range shift movement.
4H CHART
This chart tested support at channel floor yesterday with a perfect bounce respecting our Goldturn channel today. We will keep any buy exits below the half-line of the channel, as 1640 Goldturn is holding resistance.
BULLISH TARGETS
1647 - DONE
1653
Cross and lock above 1653 will open targets to 1663, 1676, 1687
BEARISH TARGETS
1639 - DONE
1632 - DONE
1620
1611
1603
Cross and lock below 1603 will open targets to 1592, 1586 and 1580.
SWING RANGE
1611
As always, we will keep you all updated with any changes to our plans throughout the week. Please don't forget to like, comment and follow to support us, we really appreciate it!
GoldViewFX
XAUUSD TOP AUTHOR

GoldViewFX - WEEKLY CHART UPDATEHey Everyone,
Please see weekly chart update
As advised last week 1710 Goldturn was being challenged by weekly chart EMA5.
EMA5 cross and lock below 1710 would confirm movement to 1589. However, we identified a weighted Goldturn before that at 1622, which is now open and can act as support. This zone is a strong support structure for the weekly setup
We now also have the MA200 touch, which we have been waiting for. MA200 may now provide some dynamic support to EMA5 for a Bullish recovery. However, a crossover with EMA5 will see further movement down.
As always, we will keep you all updated with any changes to our plans throughout the week. Please don't forget to like, comment and follow to support us, we really appreciate it!
GoldViewFX
XAUUSD TOP AUTHOR

GoldViewFX - Market UPDATEHey Everyone,
Another awesome day for us at Premier.
As planned, we waited patiently for the support test once again. We have our 1H chart setup mapped out with the support and resistant structures that price has been ranging between. We will not chase a range breaker direction until we see the weighted Goldturn levels break in either direction. So, for now, we milk the range by waiting patiently for our entries.
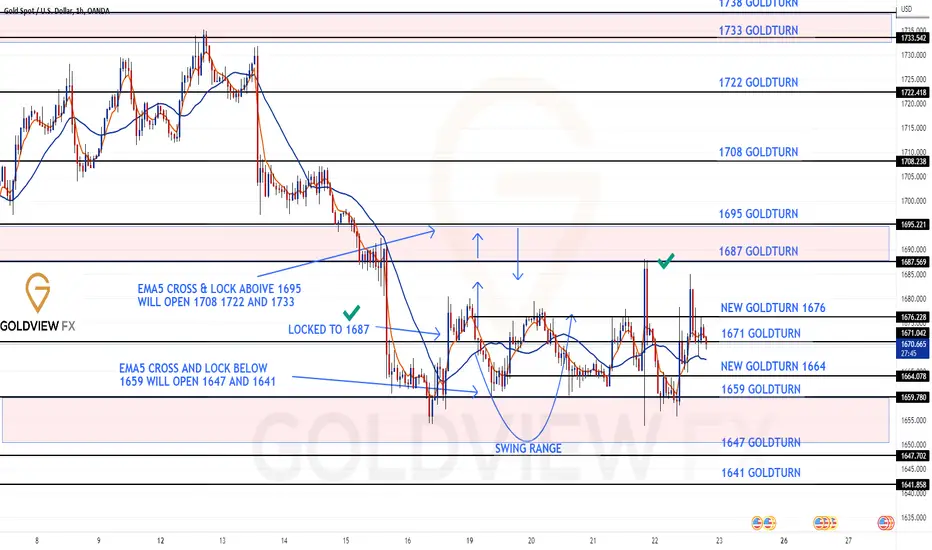
Today we waited for the swing range test at 1659 but waited for further confirmation, which we got when a new Goldturn was created above 1659, followed with a re-test on our MA setup. This gave us the confidence once again to place our BUY orders and ride to the top for a perfect exit at 1675. BOOOOM!!!
The range breaker levels still stand at 1659 to 1687; We will be looking for a break of either of these levels for a continuation of the move. As stated before, this chart setup is still valid, as price is still playing in the setup range.
Bullish Targets
1687 - DONE
1695 - LAST TARGET LEFT ON THIS SETUP
Cross and lock above 1695 will open targets to 1708, 1722, 1733
Bearish Targets
1671 - DONE
1659 - DONE
Cross and lock below 1659 will open targets to 1647 and 1641.
SWING RANGE
1647
As always, we will keep you all updated with any changes to our plans throughout the week. Please don't forget to like, comment and follow to support us, we really appreciate it!
GoldViewFX
XAUUSD TOP AUTHOR
GoldViewFX - DAILY CHART UPDATED STRUCTUREHey Everyone,
Please see updated daily chart structure.
We are at a very crucial support zone on the daily chart, challenging 1660 Goldturn, which we saw price bounce off on Friday and failed to cross below, leaving room for a recovery this week.
We will be monitoring this chart closely for EMA5 cross and lock confirmation to track this movement range to range. If we see another challenge to 1660 and then followed with EMA5 cross and lock below 1660, it will open targets to 1610 and 1578.
We will need to see a new Goldturn above structure support to provide momentum for EMA5 to cross and lock 1705 for a Bullish recovery.
We remain above the setup level with plans for the push up still in line with our technical setup. However, keeping in mind the FEDS rate hike and more pricing in action, we need to manage risk and range accordingly to absorb any swings before falling in line with organic technical movements.
As always, we will keep you all updated with any changes to our plans throughout the week. Please don't forget to like, comment and follow to support us, we really appreciate it!
GoldViewFX
XAUUSD TOP AUTHOR

GoldViewFX - Market UPDATE - "THE BIG M PATTERN" ?Hey Everyone,
As advised yesterday, we expected fireworks and to stay out, play on demo or play small. We saw a big tank down of 400 pips. Any buys would be stopped out, so playing small during volatility always gives you a chance to get back in at the right time. We expect some retracement, so any buys taken from the bottom, use the levels or MAs for exits.
With any big breakouts always best to wait and assess to see whether the move is short lived, or it starts a new range. Either way we wait for a blueprint and then we trade the range.
Now the big question.... Is Gold going for the big M pattern?
1710 Goldturn is currently being challenged by weekly chart EMA5. EMA5 cross and lock will confirm this pattern to 1589. A failure to lock and we will see the price head back up. We also have ma200 touch, which may provide some dynamic support.
Tomorrows closing price will give us a clearer picture technically if it breaks or heads back up. We must keep in mind the movement in this range was driven fundamentally and we will need to see how the price holds in this range when the noise is over, and everything is priced in.
As always, its best to wait for some more price action on the lower timeframes and then we will have a blueprint to trade it level to level.
We will keep you all updated throughout the rest of the week and then let's see what we have in store for next week's multi timeframe analysis.
Don't forget every analyst has targets high above and targets down below. Wherever it goes, one way or another they will sing songs of glory. The true skill lies in where to enter and where to exit and this is what we do, day in day out in Premier!!! We will not always get it right, but rest assured the average success of our call to win ratio is over 94%.
GoldViewFX
XAUUSD TOP AUTHOR

LUNC did made an ATH as I Suggested!Hi guys,
A couple of days ago I made an analysis on LUNC/BUSD, where I pointed out that a Bullish Pennant pattern is forming on LUNC/BUSD chart.
(Watch my previous Analysis)
The Price of LUNC successfully breakout the Pennant pattern in upward direction & moved to a new All Time High.
That's a 70%+ profit.
Congrats if you took entry after the breakout.
Don't forget to like the idea and Follow for more easy trading ideas.
Thanks.

GoldViewFX - END OF WEEK UPDATEHey Everyone,
What a fantastic finish to the week!!!!
We analysed the movement level to level and anticipated the move up from support structure, calling it loud and clear!!!
We got the test to support structure and then took our buys from the bottom cleaning up pips and layers along the way up. We expect some retracements and re-tests along the way, which will help us to take the right entries and as usual trade this level to level.
We will come back Sunday night with our multi-timeframe analysis for the coming week with updated Goldturns and our trading plan.
Please don't forget to like, comment and follow to support us, we really appreciate it!
Enjoy your weekend!
GoldViewFX
XAUUSD TOP AUTHOR

GoldViewFX - DAILY CHART UPDATEHey Everyone,
This is the Daily chart setup we have been following the last two weeks.
First we saw EMA5 crossing MA21 confirming the move down. We then had the momentum needed on the daily chart for EMA5 to CROSS and LOCK below 1755 confirming 1709 gap, which played out perfectly.
Once again we are also seeing a major support level being tested on the Daily chart setup. Tomorrow will be an interesting day!!
As always we will keep you all updated with any changes to our plans throughout the week. Please don't forget to like, comment and follow to support us, we really appreciate it!
GoldViewFX
XAUUSD TOP AUTHOR

AMC Bottom Reversal $we have to hold above 9.80$ to confirm the double bottom , and then testing the 14$ resistant , which tell us if AMC ready to go to the 20$+ again if we broke that resistant and hold 4h candle above it , and to confirm if the short are in control , if we got rejected at that resistant (14$), and potential break for the support 9.80$, and going towards the 7.70$+ bottom .

Possible sell swing setup for EURGBPExpecting price to push up to 0.85200 before looking for confirmations to enter the sell to the various TP's(1,2,3 & 4) .
ALWAYS APPLY RISK MANAGEMENT.
Goodluck

GoldViewFX - Market UPDATEHey Everyone,
Another awesome day with our members picking up buys from support levels and taking the perfect exit before the retracement. We used our premier intraday levels to identify 1785 support for the buy and trailed the movement up banking profit and locking in level to level.
Market is now ranging before breakout, which is why we will start seeing targets both ways. EMA5 has crossed and locked both ways creating open gaps 1779 and 1801. This is where a lot of traders get stuck in hedges trying to catch it both ways, until it breaks out leaving one side hanging. We will continue with our plans to buy from suport levels using our custom VIP levels and signals keeping in mind our long term trend and direction.
BULLISH TARGETS
1779 - DONE
1792 - DONE
1801 - DONE - OPEN AGAIN -
RETRACEMENT TARGETS
1779
1769
SIWNG RANGE
1743
1734
As always we will keep you all updated with any changes to our plans throughout the day.
Please don't forget to like, comment and follow to support us, we really appreciate it!
GoldViewFX
XAUUSD TOP AUTHOR

ADAUSDT - BUYHello traders,
I did an analysis of one cryptocurrency pair, but most of them are in similar places. I expect that if the price gets into the green zone I will look for buying opportunities as we are currently in a place of potential consolidation.
The markets are very uncertain and it is not clear from the chart whether we will go up or down, therefore it is very important to define strong zones for a possible market turn, wait for the signal and react with a good RRR!
Good luck with your trading! :)
IMPORTANT WARNING:
---------------------------------------------------------------------------------------------------------------------------------------------------------------------------------------------------------------------------------------
Rebounds from marked zones created by trading positions of large institutions such as banks or various financial funds may not create new HH or LL and therefore it is very important to collect partial profits at least according to these rules. This will help you to keep your equity curve constantly growing and protect your funds from big drops if the price unexpectedly turns against you. But the decision is only in your hands.
I personally prefer setting up multiple TPs , here's an explanation:
1) 1:1 allows you to take a 50% position and thus secure a balance against loss in case the market turns
2) 2-5 :1 means profit (25% trade volume ), after reaching this TP I move SL to BE
3) 5-10 :1 means bonus money with rest of trade volume (again 25%)
Money is lying on the ground, just bend down for it! Be patient and wait for the price to reach a strong zone and open a position!

GoldViewFX - MONTHLY CHART LONG TERM GOLD OUTLOOKHey Everyone,
Quick update on the MONTHLY CHART long term outlook.
Although price is aggressively in the SWING RANGE, EMA5 is still above the retracement range of 1777 and therefore the long term structure is still intact.
As mentioned before historically price was able to challenge the 1684 swing range while ema5 staying supported above 1777. I wanted to remind everyone the monthly candle has the full potential to retrace up before the month end and still maintain the ascending trendline. This has happened before and is always a possibility on the monthly chart. Its not over till the month is over.
The volatility in this market condition can take out buyers and sellers, if margin and risk is not managed according to the sizes of the potential range. There's buys and sells to be taken but without learning and knowing how to manage swings can play havoc with a traders psychology.
As always we will keep you all updated with any changes to our plans throughout the day. Please don't forget to like, comment and follow to support us, we really appreciate it!
GoldViewFX
XAUUSD TOP AUTHOR

GoldViewFX - MONTHLY CHART LONG TERM GOLD OUTLOOKHey Everyone,
We have been following this chart for a while, so thought we would update the current state of play with it.
The retracement range has broken through however EMA5 is still above the retracement range of 1777 and therefore the long term structure is still intact, as price is still within the structures swing range.
Historically price was able to challenge the 1684 swing range while ema5 staying supported above 1777. I plan to keep 1684 in mind while planning layers to BUY dips from support levels in the lower time frames.
The volatility in this market condition can take out buyers and sellers, if margin and risk is not managed according to the sizes of the potential range. There's buys and sells to be taken but without learning and knowing how to manage swings can play havoc with a traders psychology.
As always we will keep you all updated with any changes to our plans throughout the day. Please don't forget to like, comment and follow to support us, we really appreciate it!
GoldViewFX
XAUUSD TOP AUTHOR

USDCHF W, 1.0026 DONE & REJECTED, TESTING 0.9547, THEN REBOUND?USDCHF hit the target at 1.0000 & 1.0026 after broke and hold above 0.9901.
As I said at previous Idea: "Break and hold above 0.9901, open the way to key psychological level 1.0000 and 1.0026 (Triple Top and also its Strongest Resistance now)."
But, As that's a psychological and Strongest Resistance, then USDCHF rejected from that level.
Now, USDCHF is heading to 0.9547.
While Above 0.9547, Consolidating 0.9547-0.9650, STILL BULLISH.
Break Below 0.9547, Open The Way To Test MA 200 0.9512 & 0.9470.
But, Break Below 0.9470, Potential Retest 0.9296.
Below 0.9296 potentially retest 0.9091.
