USDCAD on its way down.For more expert analysis, please go ahead and click the follow button.
Here we have our USDCAD chart.
The USD is now turning over after a huge rally. We have already started getting short and are well on the way to our target.
Further down we can see some key support confluent with key MA's.
Eventual target is identified via our directional arrow and our highlighted zones of previous price rejection.
Tradinganalysis

LTCUSD to Rise higherHere we have our LTCUSD at a great long position..
We are down at key support off from a great fall.
We are also back at our key MA's, giving us greater reason to start to go long.
We can now look for a rise upwards, noted by our directional arrow drawn.

EURCADFor more expert analysis, Follow me and go ahead and subscribe to our mailing list.
Here we have another Euro Pair, EURCAD.
Monthly, we are looking long for a move up.
We are at key support levels and seeing some rejection of price.
Our stoch's are way oversold and we are far off the MA's.
Price is low. The best time to buy.
Exit/target area is noted by our directional arrow.

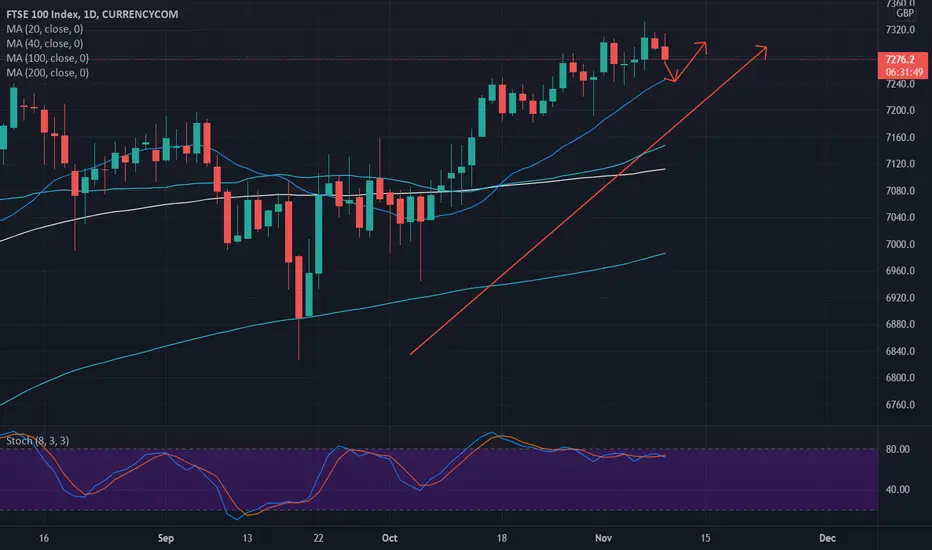
FTSE 100 SHORTPlease feel free to follow me for more Professional daily analysis.
The UK market has been driven up greatly to highs not seen for the past 1.5 YRS+.
We are looking short now as we enter these zones as they are strong sell price points.
We will soon reach the labelled support levels.
Our targets are labelled and the direction of price comes with it.

FTSE 100 Coming Weeks plan.If you would like more fully detailed analysis daily, please go ahead and follow me.
Here we have our Reliable UK 100 Chart.
In the coming week we are looking for a pullback to our vital W support.
MA's are creeping up and price is creeping down.
We have rallied up high and we are looking for a fall to the level highlighted by the eclipse.
At this point we can begin to accumulate long positions nearer our 7210 level.

AUDUSD ShortWhat im looking at
- clear down trend
- 2 previous trades hit -.27 on the fib
- price currently in area for entry
- Pull back strategy in the works
KEEP. TRADING. SIMPLE.

OIL LongFor more daily analysis, please feel free to follow me and see my frequent plans.
Here we have a good spot for an intraday long on oil.
We saw a bounce at this level previously and we RE-shorted for gains in my previous Oil post.
We are coming back to our 40 MA and the previous rejection price zone.
This can be an intraday or hedge long.

XAUUSD SHORTHere we have a full analysis of XAUUSD. Make sure to like/follow for more of my analysis I post daily.
We are Short on the XAUUSD, Why?
Firstly price has been driven up yesterday after US inflation numbers.
We are coming up to previous highs and we have smashed through our previous resistance levels, which we are looking to return to.
As you can see we are Way off the MA's and price is very high. Our Stochastic oscillator is at Overbought way high up too.
After all the green candles has to come some red. This is because we buy low and sell HIGH>

XAUUSD SHORT TRADING PLANTo Get more Analysis free, from a professional perspective please click the like button and follow me on this new account as I will be posting effective and simple methods I use myself to trade.
Here we have XAUUSD, which we are looking to go short on.
We are at the Previous strong resistance zones as highlighted. These have been strong areas already and give good impetus to short back down.
Our target is labelled by the direction of our trade and as price falls we can look to go long and continue our trend upwards and we are now looking to get short.
Gold has rallied as of late and the run is losing pace.
Remember, this is where we start to get short. Any higher prices we can sell again.

FTSE 100 For tomorrowToday we have seen A further attack to the high's followed by a short drop..
We are now approaching our MA's and are looking to start getting long on this PB. Any further dips we shall buy again.
If we approach the high's again we can go short. The margin between these positions is fairly small at the moment but will change as we dip further.
EURCAD Long ZoneWe have began to get long on EURCAD, given its a great time to buy.
Price has already started to bounce a little and we have begun to buy the asset up.
TGT zone is marked by arrows and should meet around the MA's.
Stoch's are low giving more reason to buy.
Time for a move up.

CADJPY Becoming LongHere we have the CADJPY..
A very simple example of how the bias changes as price moves.
Now looking long as we come down to the labelled support + MA's.
It has had its bull run and now we are looking for a further PB, to go long again.

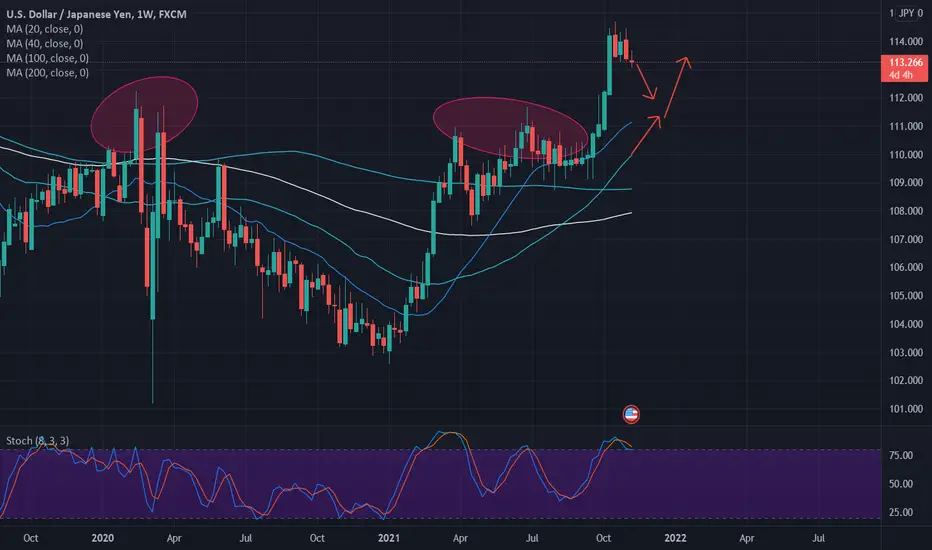
USDJPY Short Full AnalysisHere is the USDJPY Weekly chart, showing us a short idea.
We have accumulated our short positions up and now are taking gains and Adding as we come down.
TGT is at the previous strong support (labelled with eclipse).
MA's are looking to follow up price and mix up at this point.
Dollar has come up for so long and now will have its move down, before we flip and go long again.
JPY Futures Supply And Demand Analysis- Price Inside Weekly Drop Base Rally Demand Zone.
- Waiting for 4hr TF buyers to take control while price
is inside the weekly demand. Keeping eye on JPY pairs.
- Trend = Down so any longs will be counter-trend.
See the Picture above more information.

MAYBE... just MAYBEJust for fun - Check my previous post for my updated analysis on BTC
Not financial advice blah blah blah, you know the drill... Trade Safely and Let's get this bread!

XRP 29/09/2021XRP
This coin is still under trendline and going down.
You can see on chart 3 trendlines. Today was fake break of the first one.
When comes buy volume on btc, and XRP breaks trendline, then is good time to entry.
Take profits are on green lines.
TIP: In case of big crash you can put limit order. There will be strong buy volume and price will make bounce up.

What comes next for IOTA/USDT? HUGE POTENTIAL TO THE UPSIDE!1. Price broke through the major level
on a daily tf.
2. Price found resistance on 1.6080 area.
3. I'll be waiting for the price to test
our fib level for buy position.
4. Expecting the price to form some sort of
bullish correction (flag) pattern.

OZON ContinuationOZON HLDGS PLC
Disclaimer/
On average, 90% of all stocks move down with the market, and 75% - up.
The wave principle applies to some extent to individual stocks, but counting waves for them is often confusing and has little practical significance. But since the company has a large capitalization, we assume that the state of the shares depends on the psychology of the masses. With time in the distant future, not everything is clear. Due to the fact that the shares were placed recently, we are afraid of falling below the placement price (This trend can be seen in some companies)./

USDCHF > A High-Quality Trade Might Come Soon!!Friends I am overwhelmed by your generosity, thanks for the likes and comments, thank you for being so giving and kind, not many people have the virtue of generosity.
Analysis on #USDCHF
this market is very interesting to watch and see how it moves relative to other markets it is unique I do not trade it much but I watch it.
the market now is at a minor support level and still did not provide any reason to get in abuy trade.
if the market failed to hold this level and moves down further more to my preferred place to buy at the major support level I will look for a reason to buy the market for a high-quality trade.
Check today analysis below⠀
>>“ You can be free. You can live and work anywhere in the world. And you can be independent from routine and not answer to anybody."

WALMART OUTLOOKThe chart looks extremely annoying, having lots of small candlesticks (->no Momentum=no trend).
I would recommend to watch for high volume plays.
As always I draw my expectation on how the stock could move in the future.

Wave of pessimismThose who follow my ideas know that I have been waiting for the growth of the euro for a long time. I was more pessimistic about the dollar. Now, it seems to me, the rebound will continue. I do not know whether it will be big or small(the graph shows two main options). Due to the EUR / USD exchange rate, I assume that a 5-wave structure will begin on the EUR/RUB chart, or the correction will continue a little, and then growth will begin, and we will not move beyond the highest point of the USD/RUB chart.

NZDCHF long gaining momentum 🙌This trade was held from Friday and is starting to gain traction.
Trade details are shown on the chart.
We're only looking for TP3.
Trade history can be seen below this trade idea too for full transparency.
------------------------------------------
I try and share as many ideas as I can as and when I have time. My trades are automated so I am not sat in front of a screen daily.
Jumping on random trade ideas 'willy-nilly' on Trading View trying to find that one trade that you can retire from is not a sustainable way to trade. You might get lucky, but it will always end one way.
------------------------------------------
Please hit the 👍 LIKE button if you like my ideas🙏
Also follow my profile, then you will receive a notification whenever I post a trading idea - so you don't miss them. 🙌
No one likes missing out, do they?
Also, see my 'related ideas' below to see more just like this.
The stats for this pair are shown below too.
Thank you.
Darren.

