USDCAD PRONTO PER IL RIMBALZOi prezzi si trovano all’interno di un canale ribassista, quello che mi aspetto di vedere è un rimbalzo in prossimità della parte inferiore del canale. Attenderò quindi segnali di ingresso buy su timeframe inferiori.
Tradinganalysis

EURUSD Second Wave CompletedEURUSD has formed a second wave of uptrend, similar in volume to the previous wave, and has found resistance at a significant supply zone this week.
As bearish as USD is right now, it is about time for a pullback / correction, thus we should wait for a consolidation pattern or a retest of previous low before continuing to buy EURUSD .
This week, we should see EURUSD range for a few days, similarly to the previous consolidation, before breaking current high.
Look to buy EURUSD again once a support structure has been formed.

Fundamentals and Analysis: Euro is more optimistic; New UpdatesHello guys, in this technical analysis in H4 timeframe we have a fake signal, so I reccomend to closed up your short position and put in longs position for news in Euro.
Looking Daily chart, we see an Euro so bullish for long-term. Because there are a good news for the Eurozone then other currency pars. So, looking the trend is bullish in Daily and we continue up, meanwhile in H4 we see a ascendent triangle and then the expectative is so bullish!!!
Fundamentals Keys:
Euro exchange rates solid as markets digest European Union recovery fund.
Euro climbs to highest in almost two years as European Union deal enthusiasmic
That is the key level to watching in the future, because Euro is continue so bullish in lot pars agains the Euro.

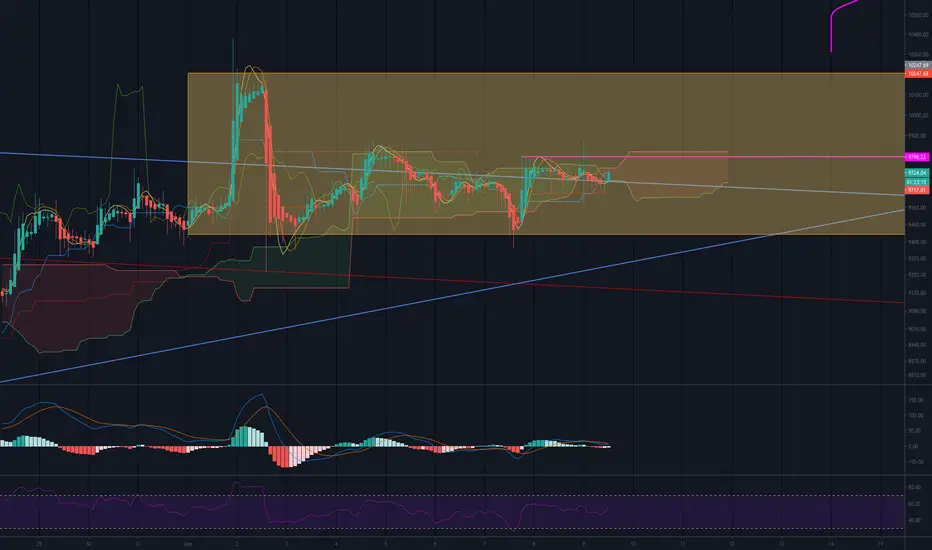
Bitcoin Same Spot (Price) Different Time / Halftime Show...Whatcha waiting for BTC? Which way do you want to break? P action consistently having a drip sideways with a dribble and a drop in volume, yet staying steady at the 9200 mark.
‘Just sitting here enjoying the yearly halftime show’ - Bitcoin
Overall BTC is watching the resistance overhead stay stationary around 10k with trendiness moving south which could be ‘a’ reason for the price restriction. (See resistance write up for more info) The more price moves sideways indicators will catch up and flatten out (but lets remember that indicators are lagging as formulated by price action already printed). However they comprise of traders theory to making money in these markets. Anyways;
Enjoy your breather Bitcoin and come out and rock a Q3/Q4 to get MVP and be remembered as GOAT...
Happy Trading, mask up and be safe and drink ya Gatorade.
#Game6 ... Pending
Bitcoin to Date
Daily
Current Price: $9195.1 USD
Daily Change %: -0.74%
Market Cap: $169,680,822,960.00 USD
24 Hour Volume: $15,791,471,013 USD
Population of the World: ~7,798,309,350+ humans
Today’s Bitcoin Total / World Population: ~ 0.002363839285242 Satoshi’s / $21.73 USD per person
Overall
Approximate Bitcoin in Circulation: 18,433,950 BTC
Approximate Bitcoin Mined Last 24hr: ~ 900 BTC
Approximate Bitcoin Left to Mine: 2,566,050 BTC
Road to 21,000,000 Bitcoin Mined: 87.78%
Current Bitcoin Dominance: 63.63%
📈Support & Resistance📉*
Support Levels
1st Support Zone: 8963.6
2nd Support Zone: 8666.7
3rd Support Zone: 7840.4
Resistance Levels:
1st Resistance Zone: 9889.2
2nd Resistance Zone: 10285.8
3rd Resistance Zone: 10781.2
Price Level Consideration
Approximate Days Until Halving: 1392 Days (Pending Timezone / Blocks Mined)
All Time High Half Way Point: 9942.5
Prominent High: 13767.4
Prominent Low: 3994.1
🐃 Bulls Verse Bears 🐻
🐃 Bullish Above: 10485.8
🐻 Bearish Below: 6474.1
Monthly & Weekly Opens
Monthly Open: 9171.5
Weekly Open: 9320.6
Current Price Zone: ACCUMULATION ZONE
Biggest Bitcoin Transaction of the Day**
1. 🚨1,220 BTC ($11,270,347 USD) transferred from Coinbase ➡️ Unknown wallet 🚨
Gold***: $1,811.59 USD +0.79 +0.04%
Silver***: $27.74 USD +0.08 +0.28%
——————————————————————————————————
*📈Support & Resistance📉: These are typically zones & not exact price levels depicted by the lines. Keep in mind that price may respect and repeatedly touch several times on smaller time frames.
**What you won’t see on exchanges: This is purely to reference that traders watching the charts are neglecting the ‘Transaction Sentiment’ of large (🐳 WHALE) transactions from wallet to wallet and OTC execution send transactions (new/old wallets). TIP: The amount/s transferred daily tells a story of flow to potential market dynamics that may transpire.
*** Personally I HODL Gold/Crypto over having a majority of Fiat currency 💸. Previously before trading crypto in 2015, Gold was one of my main charts thus I look at the price regularly comparative to Bitcoin.
Created & published by Des Landen
Landen International
Trading Playlist: Duke Dumont

XAU/USD ABC WAVEXAU/USD Bear movements on zigzag ABC wave.
Fib. retrace 0.382 and 0.618 targets, projection same in 0.618 area. SAXO:XAUUSD

Possible downward move on goldPlease support my work by clicking the LIKE button(If you liked).Thank you!
Possible downward move on gold. 1760 and lower is very possible. If trade will go in your way hold it.

EURJPYWaiting for price action confirmation on lower time frames. We see a big push and an exhaustion. We will look to enter on the retest of the broken trendline

EURGBP SHORTS FROM MAJOR DAILY REGION OF RESISTANCEGood morning traders,
Today i release an analysis of the EURGBP.
After rejecting clean from a Region of daily Resistance which is also the 0.90000$ Keylevel,
we now see some Bearish momentum.
on the lower timeframes (h4.h2,h1) we rebroke the descending trendline and now still trading below.
I think it should fall into the Base Region of 0.88750$ if we get more Selling pressure.
Lets see how this play out.
Thats just educational purpose, no advice.
~your Tradingpurpose~

Should i sell it?? I am beginer.I am trying to learn fx and i dont know if my strategy is ok. Plz tell me if i made any mistake and if i predicted the eur/usd right.

S&P 500If we get to break the previous high and then retest it I will look for bullish pressure. If the price never keep going down the analysis becomes invalid. MANAGE YOUR RISK AND SAFE TRADING EVERYONE!

EURUSDWe see the pricE has started to make lower lows and lowers highs. I am expecting a pullback to the previous low and I will look for confirmation of bearish pressure. If the price will break the zone this analysis becomes invalid. MANAGE YOUR RISK AND SAFE TRADING EVERYONE.

Spring on USDCAD, an opportunity to buyA price channel with Spring is an opportunity to buy.
Targets: 1.3653 and 1.3862

Warning Indicator To Avoid Over TradingOne sensible way to avoid over trading on a low time-frame is to look at Heiken Ashi. If you can not observe clean and tidy trends with your preferred risk/reward ratio including take profit targets and stop loss positions, why trade? Look for trading zone breakout opportunities and be patient, remain calm, don't over trade.
Strong opportunity to buy GBPCADBuying opportunity after breaching the upper side of the triangle at 1.7109
Buy targets 1.7380 and 1.7658
It is possible to sell if the buying pattern fails after breaking the uptrend and the triangle at 1.6882

XAUUSD GOLD H4. Possible retest of broken area. I will look for short opportunities on the retest of the borken trendline. Wait for confirmation. Manage your risk and trade safely.

AUDUSDDaily chart. We have seen a big impulse to the upside this week. The last three days there has been a visible loss of momentum as those wicks never lie. I would wait to see how price will react and then look for the 2 possible scenarios around the pink level. If price break the blue zone the analysis becomes invalid. Trade safely and manage your risk!

USDJPYH4. We have seen a big push to the upside this week. There may be some pullbacks. I would see what happens when the price will start moving around the two blue areas. I will be looking for some sign of bullish pressure around those areas if it will not be shown this analysis becomes invalid. Trade safely and manage your risk!

Does OPEC meeting results support the Canadian Dollar ? Everyone is waiting for what the OPEC and non-OPEC allies meeting will come out today 6/06/2020.
So then they agree to reduce production or increase the rate of production reduction, it will be a strong support for oil prices and thus will support the rise of the Canadian dollar.
And If there is no agreement ,the petroleum price will descend, and therefore it is possible to push the Canadian Dollar down.
Technically, the pair is moving inside a right triangle. Any breakout of the upper side of the triangle at 1.7120 represents an opportunity to buy. Any break of the lower side of the triangle and the uptrend represents an opportunity to sell.
Buying Targets: the first target is 1.7346, and the second target is 1.7625
Selling targets: the first target is 1.6640, the second target is 1.6503, and the third target is 1.6176.

GBPUSDDaily chart. We see a strong resistance level(blue area) that shows us proof of bearish pressure. I would wait to see on the lower time frames if the bullish structure will be broken. I would also look for potential bullish pressure on the pink area, which is the previous broken area. MANAGE YOUR RISK and trade safely.

GBPJPY M30 - Short SetupGBPJPY M30 - Struggling to maintain this upside momentum on GJ. Could see a break of support, retest and correction down to our H1/H4 trendline support zone. Really nice RR if this breaks and retests nicely.

EURCADStrong key level that showed buying pressure. Support has been broken and I'd look for a retest of broken area before going long.
Manage your risk and trade safe.


AUDUSDAscending Triangle. Possible breakout. I would wait for retest of broken area. Manage your risk and trade safely!
