GBPUSD ____ INCOMING BEARISH MOVEHello guys,
If you follow me already, you will know that I get my directional bias from the dollar index. In my previous post on the dollar (inserted below) I stated that I am bullish on the dollar which would mean I am bearish on GBPUSD.
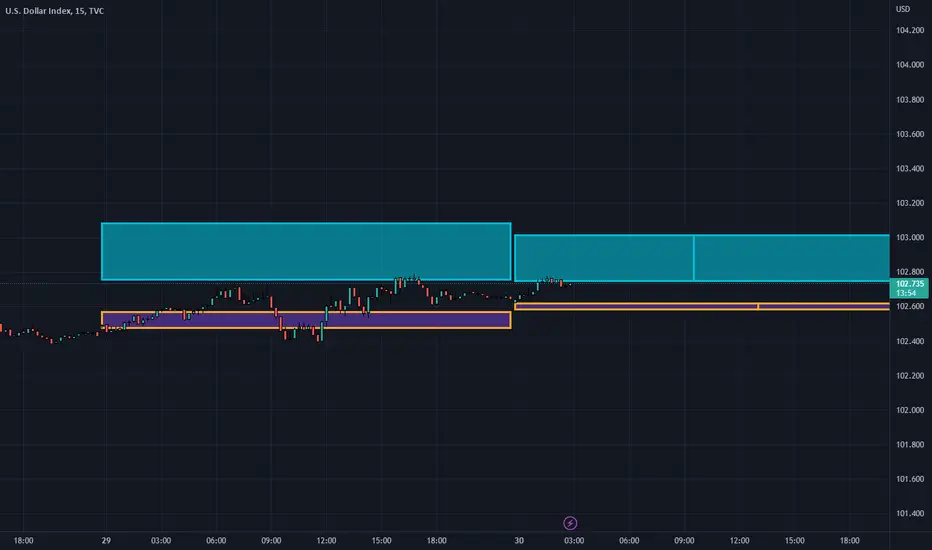
As you may see on my chart, I expect the price to run into my POI after inducing early short selling as marked on the chart before the continuation of the bearish move from last week.
You will also notice that we have multiple sell-side liquidity just above my profit target zone which price loves to sweep.
If you like this, check out my profile for more.
DXY ANALYSIS
EURUSD ANALYSIS
Cheers,
David
Tradinganalysis

Maximise your trading success with market analysisWhen it comes to trading, one of the most important skills to develop is market analysis.
When you know how to read the market and make informed decisions, it can be the difference between spotting high, medium and low probability trades.
Here are some ideas to analyse the market and maximise your chance of success.
Start with the Main Indices
The first step in market analysis is to take a look at the main indices.
These indices, such as the JSE ALSI, SP500, Nasdaq, FTSE100, and others, are a good indication of the overall market direction.
Once you have seen the indices, you’ll get a sense of how the market is moving as a whole, and what kinds of opportunities might be available.
Identify the major Trends
Once you’ve looked at the main indices, it’s time to:
Identify any market trends (Market environment)
If the market is showing a strong uptrend (trend, momentum, moving averages analysis)
Then it’s best to ONLY look for longs or buys.
On the other hand, if your indicators suggest that the market has confirmed a downtrend, it’s best to look for sells or shorts.
Look for Breakouts
Sometimes the market doesn’t confirm an up or down trend.
If you see the market is moving in a sideways manner, there’s still an opportunity to profit.
In this case, it’s a good idea to write down the levels of breakouts you’d expect.
If the market breaks up, you’ll expect longs, and if it breaks down, you’ll look for shorts.
This way you’ll prepare for both outcomes And you’ll be able to capitalize on whichever direction the market takes.
Final Thoughts
Market analysis is a critical skill for any trader to master.
When you start with the main indices, to identify trends, and looking for breakouts, you’ll be able to make informed decisions about your trades and get a good idea of where they’re more likely to head.

10052023 - #USDJPYDXY was strong yesterday but came down after hitting R at 101.75 or so. USDJPY as mentioned, 135.35 was strong R, which held the high, though it was much a sideways days for USDJPY.
The same 135.35 level continue to act as R, though TBH tonight is CPI thus anything can happen. But for now, price action still look toppish here.
IMO would likely revisit yesterday's low then it will be up to FOMC to trigger the next move.
Below 135.11, expect a move to 134.65. If accepted then back up to 135.7. Rejection off which down to 133.77.
However, if market can keep above 135.25, especially before FOMC, could trigger a strong up to 136.15 and 136.7 magnet.

09052023 -$NDXSimilar to SPX, price is in consolidation. Yesterday price did a minor pullback but closed higher. Bias still to the upside with BZ supporting it.
Above 13275 cautiously long to 13331, 13383.
Short 13383 if traded today.
Below 13251 look for move to 13213 which would be the pivot level for bounce or further downside.

09052023 - $FDAXEerie small range consolidation day yesterday, inside bar. Possible break in either directions.
Above 16017 - long to 16049. Possible rejection from 16049 to 15981.
15983-16017 Neutral
Below 15981 - shorts to 15941, 15915.
15915 - look for bounce on divergence target 15979. Break of 15915 bring us to 15843.

GoldViewFX - MARKET UPDATEHey Everyone,
Perfect start to our week with our Bullish Targets 2017 and 2028 now HIT, highlighted on the chart by our arrow. 2028 is a weighted resistance structure and as highlighted on the chart needed a EMA5 cross and lock to open upper range or a rejection at this level. EMA5 did not cross and so provided the perfect exit for now. As stated already structure breaks will give openings to bigger ranges in one go so that's something we will keep an eye on and highlighted on the chart.
We will continue with our plans to buy from dips and not chase from the top, as we play close to the ATH. Our long term projection still remains Bullish with plans for another ATH challenge and break with play into a new range for Gold this year. Patience is key as swings are expected.
BULLISH TARGETS
2017 - DONE
2028 - DONE
EMA5 CROSS AND LOCK ABOVE 2028 WILL OPEN UPPER LEVELS 2037 AND 2O49
BEARISH TARGETS
2005 -
1999 -
EMA5 CROSS AND LOCK BELOW 1999 WILL OPEN THE SWING RANGE
SWING RANGE
1979 - 1967
As always, we will keep you all updated with regular updates throughout the week and how we manage the active ideas and setups. Please don't forget to like, comment and follow to support us, we really appreciate it!
GoldViewFX
XAUUSD TOP AUTHOR

GoldViewFX - MONTHLY CHART LONG TERM GOLD OUTLOOKHey Everyone,
Okay for those of you who have only started following this monthly chart that we have been tracking, please review all the previous updates below as we continue to track this level to level to get upto date.
This has been playing out perfectly and now we finally have a candle body close above 1976 on this monthly chart, as the month closes. This is the first candle body close above this level and we will also have a new Goldturn high on this monthly chart, as the new month starts. These are all strong ingredients for us to see a ATH challenge and potentially a break to create a new ATH.
The only thing we need to keep in mind is the potential EMA5 detachment that will be formed, as the new month candles starts. We need to keep this in mind for potential swings down and use our smaller timeframes to buy dips accordingly.
LAST UPDATE
Please review our last update last week below. We can clearly see the detachment gap, which needs to be considered when managing risk for any longs. EMA5 has reached new high and this months candle close will be significant to confirm breakout. If we see a candle body close above the test zone it will lock EMA5 above the ATH Goldturn, opening the potential for a new ATH breakout or at the very least a test to the ATH.
We will play it extra safe this week keeping exposure low.
PREVIOUS UPDATE
Please see our Monthly chart idea which we have been tracking over the last few months. We completed all our bull targets with our final target hit 2 weeks ago highlighted by the circle zone we heighted on the chart. This played out to perfection!!!
Price fell just short of the ATH target test. This is a longer range/term projection so expect swings in between.
We stated on last months candle close the potential of a detachment ,which will require some retracement. We need to keep this in mind for potential drops to complete the detachment.
Price is now at a critical zone and we must tread carefully now. A test to ATH is likely and either a new ATH will be created or a big tank down. We will use our smaller timeframes to track the movement level to level.
We were able to track and trade this entire movement using our smaller timeframes for entries and exits. We identified the swing from the support all the way up to our test zone target that we have been reminding you all every time we updated this chart. This open target gave us the confidence over the last few months to buy dips. The swings we had below we also highlighted, as detachments that were completed and provided the dynamic support for a push up each time.
As always, we will keep you all updated with regular updates throughout the week and how we manage the active ideas and setups. Please don't forget to like, comment and follow to support us, we really appreciate it!
GoldViewFX
XAUUSD TOP AUTHOR

London Session Analysis EURUSD, GBPUSD & USDJPYThis morning we have a potential upside move in the EURUSD and the GBPUSD based on the intraday wave structure. However the USDJPY is currently showing signs of weakness above yesterday's high and a break back below the 1DH is a sell signal.
Enjoy!

GoldViewFX - MARKET UPDATEHey Everyone,
Please see our 1H chart update. Our chart idea played out perfectly by starting with the drop into the retracement zone identified followed with a push up, as analysed on the chart. We took a clean buy from the retracement zone for a nice catch in line with our plans to buy dips. EMA5 failed to cross above 1993 highlighted by the circle on the chart, which confirmed the rejection level to level.
BULLISH TARGETS
1993 - DONE
2009 -
EMA5 CROSS AND LOCK ABOVE 2009 WILL OPEN UPPER LEVELS UPTO 2O25
BEARISH TARGETS
1977 - DONE
EMA5 CROSS AND LOCK BELOW 1977 WILL OPEN THE SWING RANGE
SWING RANGE
1954
As always, we will keep you all updated with regular updates throughout the week and how we manage the active ideas and setups. Please don't forget to like, comment and follow to support us, we really appreciate it!
GoldViewFX
XAUUSD TOP AUTHOR

AVAXUSD long positionThe price currently remains in the middle of the range, which is not the best place to take a position. We are looking for a long position and we are expecting the price to retest the support which would be our entry.
Target and stop loss are shown on the chart.

GoldViewFX - MARKET UPDATEHey Everyone,
Fantastic finish to the week for us once again!!! We had another retest back to the retracement range and then a lovely ride back up confirmed with our activation for capturing a clean 50 pips. Our plans to buy dips playing out perfectly while price is ranging between the levels.
We remain Bullish with our long term plans and will continue to track the price level to level when buying dips from support levels with the short term trend down.
We will now come back Sunday with our multi timeframe analysis and updated trading plans for the coming week.
Please don't forget to like, comment and follow to support us, we really appreciate it!
GoldViewFX
XAUUSD TOP AUTHOR

13042023 - $SPX $SPYMarket went higher but sold back down to daily BZ. My long term level 4150 provided a nice short. But how bearish the current move?
Price opened within the BZ; re-tested yesterday's low but is now higher. Now staying above OP, we could first see a move to 4110 and even 4120. If market open European session at around 4110, look for possible reversal with divergence. 4120 applies for US session (but it depends on how market move). Below BZ, look for bearish continuation for a move lower. to weekly BZ

12042023 - $NDX #NDXNDX levels gave the highs yesterday and as mentioned for yesterday, said we should see a dip but would be bought up; but overall NDX is still looking weak. Unlike SPX, NDX is going below the 2 zones, which is more bearish.
For now, before CPI, 13114 and 12870 are fadable IMO, especially if we see 12870, would be a good level to go long back to the zone.

12042023 - $EURUSD #EURUSDMarket gave a reversal candle yesterday. EURUSD was strong and we got only a slight rejection off the PHOD (GBPUSD short was better). What is the market telling us?
Market is still above the 2 zones and thus bias is to the upside. Would like to see a retest of the zone, find support to go long to target 1.0942. If 1.0942 trade first instead during European session, would look for divergence to short back down. And if market somehow trade to 1.0970 on CPI news, look for shorts down back to OP. IMO, though DXY printed a bearish candle yesterday, it looked much supported, thus would be open to some USD strength today.

11/04/2023 - #GBPUSD $GBPUSDSimilar move to EURUSD; market made a huge dip but is bought. Now price is within the zone which should provide much resistance.
TBH based on yesterday's price action, and that price is below both zones, would expect another revisit of the lows, but given that price just open and went higher, I would say be short only if BZ breaks to target yesterday's low. Be cautiously bullish if price close above BZ to target 1.2436, and that would be a good level to go short. Another possible buy zone would be a bounce off PZ again, good especially with divergence.

11/04/2023 - $FDAX #DAXDAX is back after holidays, gap up after US went higher yesterday. Price is between the 1 and 2 SD BB. Looking for another spike for a good pullback. Looking for the short between 15812-15872 for a move to PZ. But if market goes to PZ/BZ first look for the bounce to target above instead.

10042023 - $NDX #NDXPrice is coming down but still supported by the BZ. Not too clear for today, thus better is to wait for market to move and trade accordingly.
Above 13072 look for long to 13160 else wait for dip to 12946-12976 for long to 13035.

10042023 - #GBPUSD $GBPUSDMarket came down on NFP on Friday but bounced off BZ. Today we have confluence of BZ and PZ as support but it is a battle of price action with BZ. If price stays around current price near PZ, could see a rally to 1.2454 (or near there) for a rejection and a short back to Friday's low.

GoldViewFX - 4H CHART UPDATED LEVELS & TARGETSHey Everyone,
Please see our updated 4H chart Goldturn support and resistance reaction levels and updated targets.
We have a structure break above 2007 Goldturn resistance opening the range upto 2035, which fell short by a few pips last week still leaving this gap open for us to keep in mind.
A new Goldturn formation at 2022 is providing resistance. We will need to see EMA5 cross this level to solidify the upper target that remains open.
We have a retracement range at 1991 that will likely provide support should we see a test. However, a EMA5 cross and lock below this level will open the swing range. We plan to track and trade this level to level and will continue with our plans to buy dips from strategic levels.
BULLISH TARGETS
2022
2035
EMA5 CROSS AND LOCK ABOVE 2035 WILL OPEN 2060
BEARISH TARGETS
2005
1991
EMA5 CROSS AND LOCK BELOW 1991 WILL OPEN THE SWING RANGE
SWING RANGE
1942
As always, we will keep you all updated with regular updates throughout the week and how we manage the active ideas and setups. Please don't forget to like, comment and follow to support us, we really appreciate it!
GoldViewFX
XAUUSD TOP AUTHOR

06042023 - $NDX #NDXI said NDX was in a range but yet market broke down on weakness. But BZ held well for the short and now market is going down more but BZ is holding it.
Would like to see 13016 trade before further down else be cautiously bearish when BZ breaks.

06042023 - #GBPUSD $GBPUSDGBPUSD came down on US data release with DXY hitting 101.40 strong support. Market is again testing the lows of yesterday after the test and rejection off the PZ. If it had been at the open, I would say that if market come down first (to BZ), look for a long to PZ and if market goes up first, look for a rejection.
For now, with price near BZ, will look for the bounce for a move up, with a possible rejection between 1.2474-1.2486

Neutral IdeaHello traders, in today's trading session my team and I are monitoring GBPJPY for a potential trade setup.
At the moment GBPJPY has been very bullish, retesting the high on the weekly timeframe - which doubles as a minor buyers territory OR money spot.
Pip Regards, DayBot6.
What do you think of this idea?

$DXY bottom is in?Has $DXY bottomed?
It made the perfect bounce off the PZ yesterday and stopped by BZ in the standard move.
This morning, it opened above PZ and is now capped by BZ (again). Can it break BZ today? Yesterday's daily candle points to a possibility.