Southwest Airlines Company (LUV) 1W1W Chart, Southwest Airlines Company (LUV) :
MACD : Has been under the histogram since September, 2021, with two attempts to break through the surface, one third move up, should break the ice...
RSI : Has been moving into a band between 31.00 and 55.00
PRICE : Has been steadily moving up after bouncing twice around $30, testing the 100MA signal resistance below the 200MA both signals moving south, allowing space to meet both 100MA Signal and Price around the $36 to test it and eventually keep moving up to test the 200MA resistance around the $40, which is the optimistic approach.
"In this business if you're good, you're right six times out of ten. You're never going to be right nine times out of ten. I've found that when the market's going down and you buy funds wisely, at some point in the future you will be happy. You won't get there by reading: "Now is the time to buy".
Today this ticker has a Volume of 80K. Market Cap of 17.9B.
This Company PAYS DIVIDENDS TO SHAREHOLDERS (DIVIDENDS YIELD 2.39%)
Southwest Airlines Co. engages in the operation and management of a passenger airline. The firm also offers ancillary services such as early bird check-in, upgraded boarding, and transportation of pets and unaccompanied minors. It operates in the United States, the Commonwealth of Puerto Rico, Mexico, Jamaica, the Bahamas, Aruba, Dominican Republic, Costa Rica, Belize, Cuba, the Cayman Islands, and Turks and Caicos. The company was founded by Rollin W. King and Herbert D. Kelleher on March 9, 1967, and is headquartered in Dallas, TX.
Good Luck!
Gráfico de 1 Semana, LUV"]Southwest Airlines Company (LUV) :
MACD : Ha estado bajo el histograma desde septiembre de 2021, con dos intentos de romper la superficie, con un tercer movimiento hacia arriba, debería romper el hielo...
RSI : Ha mantenido un movimiento dentro de la banda 31.00 & 55.00
PRECIO : Ha estado subiendo constantemente después de rebotar dos veces alrededor de $30, probando la señal de 100MA por debajo de los 200MA, ambas señales se mueven hacia el sur, lo que permite un espacio para que ambos se encuentren: la señal de 100 MA y el precio alrededor de los $36 para probar su resistencia y, finalmente, seguir subiendo para probar la resistencia de la señal de 200MA alrededor de los $40, que es el enfoque optimista.
"En este negocio, si eres bueno, tienes razón seis de cada diez veces. Nunca vas a tener razón nueve de cada diez. Descubrí que cuando el mercado está cayendo y compras fondos sabiamente, en algún momento en el futuro serás feliz. Nunca verás un anuncio que diga: "Ahora es el momento de comprar".
Hoy este ticker tiene un Volumen de 80K. Market Cap 17.9B.
Esta Empresa PAGA DIVIDENDOS A LOS ACCIONISTAS (RENDIMIENTO POR DIVIDENDO 2.39%)
Southwest Airlines Co. se dedica a la operación y administración de una aerolínea de pasajeros. La firma también ofrece servicios auxiliares como check-in anticipado, embarque mejorado y transporte de mascotas y menores no acompañados. Opera en los Estados Unidos, el Estado Libre Asociado de Puerto Rico, México, Jamaica, las Bahamas, Aruba, República Dominicana, Costa Rica, Belice, Cuba, las Islas Caimán y las Islas Turcas y Caicos. La empresa fue fundada por Rollin W. King y Herbert D. Kelleher el 9 de marzo de 1967 y tiene su sede en Dallas, TX.
¡Buena suerte!
“I believe in analysis and not forecasting.” / "Creo en el análisis y no en el pronóstico".
REMEMBER : I am not a financial adviser nor is any content in this article presented as financial advice. The information provided in this blog post and any other posts that I make, and any accompanying material is for informational purposes only. It should not be considered financial or investment advice of any kind. One should consult with a financial or investment professional to determine what may be best for your individual needs. RECUERDE : No soy un asesor financiero y el contenido de este artículo no se presenta como asesoramiento financiero. La información provista en esta publicación de blog y cualquier otra publicación que haga y cualquier material que la acompaña es solo para fines informativos. No debe considerarse asesoramiento financiero o de inversión de ningún tipo. Se debe consultar con un profesional financiero o de inversiones para determinar qué es lo mejor para sus necesidades individuales.
Tradinganalysis

Tether Dominance - showing signs of pivotal movementUSDT Dominance is currently at a level of strong longer term trend SUPPORT (i.e. market resistance level).
Red circles represent contact with the current trend support which signals the selling of USDT (i.e. buys in the crypto market), with a current double bottom shown.
Green circles represent the current trend resistance hits and USDT sell-offs (crypto market rallies).
With the FOMC meeting starting today and concluding tomorrow, FED announcements will dictate "loss of this support" (market rally) or a "Bounce at support" (market sell-off).

$DXY Bullish above 103.71This is the key level to watch and is holding. Lots of resistance above too but hold this level and we will get a next leg up.

GoldViewFX - WEEKLY CHART UPDATEHey Everyone,
Please see our weekly chart update.
As stated last week and same again this week the swing range providing the range to buy dips and yet again we saw this play out with a nice bounce back up from the swing range. However the difference this week is we have a weekly candle body close above 1858 leaving the range above open.
Please remember weekly charts ideas are not one way setups. As you have seen previously, while tracking the weekly chart you we will see swings up and down. The weekly move requires detachment resets that can take a week to hit, making it difficult to establish a intraday setup. We can expect swings down and therefore, we will use our smaller timeframe setups to navigate and trade this range, level to level, while keeping the overall structure in mind.
We have a long range target above that still remains open, giving us further confidence with our long term plans to buy dips.
LAST UPDATE
This is the weekly chart we have been tracking since last year. As you can all see, we tracked this move all the way down and then all the way up level to level. We then saw the reaction on the axis trendline resistance for the move down. This Axis trendline was respected perfectly.
There is still room for further movement down as we are seeing price head towards the swing range. The swing range is a strong support zone and we will likely see a reaction within this range.
As always, we will keep you all updated with regular updates throughout the week and how we manage the setups. Please don't forget to like, comment and follow to support us, we really appreciate it!
GoldViewFX

Corning Incorporated (GLW) 1M Trading Analisys (TA)Avi Salzman in the Article titled 5 Stocks poised to profit from renewables, published on the February 27, 2023 issue of Barron's, studies these 5 stocks: GLW, ENPH, FREY, NTOIY & SBGSY, I picked the first to share with you my impressions
1M Chart, Corning Incorporated (GLW) :
MACD : On October 2021, the signals on pierced down from above the histogram and have been diving below the histogram since September 2022, at this moment they are getting close to pierce up from below it.
RSI : The signal bounced on September 2022 at 40.00, steadily moving up after softly bounce twice on the 50.00.
PRICE : Has been steadily moving up after bouncing at $29 on September 2022, over the 200MA signal below the 100MA and is pushing to move above this last one where has found quite of resistance before moving toward $40, which is the optimistic approach.
"In this business if you're good, you're right six times out of ten. You're never going to be right nine times out of ten. I've found that when the market's going down and you buy funds wisely, at some point in the future you will be happy. You won't get there by reading: "Now is the time to buy".
Today this ticker has a Volume of 785K, Market Cap of 24B.
This Company PAYS DIVIDENDS TO SHAREHOLDERS (DIVIDENDS YIELD 3.30%)
Corning, Inc. engages in the provision of glass for notebook computers, flat panel desktop monitors, display televisions, and other information display applications, carrier network and enterprise network products for the telecommunications industry, ceramic substrates for gasoline and diesel engines in automotive and heavy-duty vehicle markets, laboratory products for the scientific community and polymer products for biotechnology applications, optical materials for the semiconductor industry and the scientific community, and polycrystalline silicon products and other technologies. The company was founded by Amory Houghton Sr. in 1851 and is headquartered in Corning, NY.
Good Luck!
Avi Salzman en el artículo titulado 5 acciones preparadas para beneficiarse de las energías renovables, publicado en la edición del 27 de febrero de 2023 de Barron's, estudia estas 5 acciones: GLW, ENPH, FREY, NTOIY y SBGSY. Elegí la primera para compartir con ustedes mis impresiones.
Gráfico de 1M, Corning Incorporated (GLW) :
MACD : En octubre de 2021, las señales se cruzaron desde arriba del histograma y han estado sumergiéndose por debajo del mismo desde septiembre de 2022, en este momento se están acercando para cruzarce desde abajo del histograma de manera ascendente.
RSI : La señal rebotó en septiembre de 2022 en 40:00, moviéndose constantemente hacia arriba después de un suave rebote doble en las 50:00.
PRECIO : Ha estado subiendo constantemente después de rebotar en $29 en septiembre de 2022, sobre la señal de 200MA por debajo de la 100MA y está presionando para moverse por encima de esta última donde ha encontrado resistencia antes de moverse a $40, que es el enfoque optimista.
"En este negocio, si eres bueno, tienes razón seis de cada diez veces. Nunca vas a tener razón nueve de cada diez. Descubrí que cuando el mercado está cayendo y compras fondos sabiamente, en algún momento en el futuro serás feliz. Nunca verás un anuncio que diga: "Ahora es el momento de comprar".
Hoy este ticker tiene un Volumen de 785K, Market Cap of 24B.
Esta Empresa PAGA DIVIDENDOS A LOS ACCIONISTAS (RENDIMIENTO POR DIVIDENDO 3.30%)
Corning, Inc. se dedica al suministro de vidrio para computadoras portátiles, monitores de escritorio de pantalla plana, televisores de pantalla y otras aplicaciones de visualización de información, productos de redes empresariales y redes de operadores para la industria de las telecomunicaciones, sustratos cerámicos para motores de gasolina y diesel en automóviles y vehículos pesados. -mercados de vehículos de servicio, productos de laboratorio para la comunidad científica y productos poliméricos para aplicaciones biotecnológicas, materiales ópticos para la industria de semiconductores y la comunidad científica, y productos de silicio policristalino y otras tecnologías. La empresa fue fundada por Amory Houghton Sr. en 1851 y tiene su sede en Corning, Nueva York.
¡Buena suerte!
“I believe in analysis and not forecasting.” / "Creo en el análisis y no en el pronóstico".
REMEMBER : I am not a financial adviser nor is any content in this article presented as financial advice. The information provided in this blog post and any other posts that I make, and any accompanying material is for informational purposes only. It should not be considered financial or investment advice of any kind. One should consult with a financial or investment professional to determine what may be best for your individual needs. RECUERDE : No soy un asesor financiero y el contenido de este artículo no se presenta como asesoramiento financiero. La información provista en esta publicación de blog y cualquier otra publicación que haga y cualquier material que la acompaña es solo para fines informativos. No debe considerarse asesoramiento financiero o de inversión de ningún tipo. Se debe consultar con un profesional financiero o de inversiones para determinar qué es lo mejor para sus necesidades individuales.

GoldViewFX - Market UPDATEHey Everyone,
Fantastic day today with the swing range completing the full swing.
The 4H setup is now active and we would need to see EMA5 cross and lock above 1836 to re-open the upper levels again.
Our plans to buy dips is still playing out perfectly. Making sure exposure is low to allow management of swings.
BULLISH TARGETS
1836
EMA5 CROSS AND LOCK ABOVE 1836 WILL OPEN 1854 AND 1865
BEARISH TARGETS
1836 - DONE
EMA5 CROSS AND LOCK BELOW 1836 WILL OPEN THE SWING RANGE
SWING RANGE
1811 - DONE
As always, we will keep you all updated with regular updates throughout the week and how we manage the active ideas and setups. Please don't forget to like, comment and follow to support us, we really appreciate it!
GoldViewFX
XAUUSD TOP AUTHOR

EURAUD Short IdeaAggressive Market Outlook!
Price Reaching Rejection Block and QML Level. Bearish Flat in Progress.
Seasonal Tendency and Expected Hike in AUD by tomorrow from 3.35% to 3.60% will strengthen AUD in near future.
Risk Disclaimer:
Forex is only Suitable for those People Who Understand, and are Willing to Take on, the Financial and other Risks involved. Please Ensure You fully Understand the Risks and Carefully Consider your Financial Situation and Trading Experience Before Trading. The Analysis may Subject to Change at any Time without Notice and is Provided for the Sole Purpose of Assisting Traders To Make Independent Investment Decisions.
Patience | Discipline | Trade Management

GoldViewFX - Market UPDATEHey Everyone,
After hitting our first target of 1857 yesterday our last target of 1863 on this setup was not hit today but instead News related volatility drove the price down. We were and are expecting swings due to Powell's two day testimony, which will trigger heavy volatility like today.
We took out any longs from the top and will look to ride back up when volatility settles into organic technical movement.
However, as you can see our 1H chart setup still allowed us to track the movement of the volatility by first breaking the 1845 level with EMA5 confirming the swing range and now the swing range break opening the critical support structure.
Its wise to take extra caution by keeping positions light this week to be able to manage the extreme volatility. If the support structure holds, we should see a back to benchmark move, unless tomorrows volatility breaks through the structure. We will update the range and levels should this break.
BULLISH TARGETS
1857 - DONE
1863
BEARISH TARGETS
1852 - DONE
1845 - DONE
SWING RANGE
1825 - DONE
As always, we will keep you all updated with regular updates throughout the week and how we manage the active ideas and setups. Please don't forget to like, comment and follow to support us, we really appreciate it!
GoldViewFX
XAUUSD TOP AUTHOR

Halliburton Company (HAL) 3M Trading Analisys (TA)3M Chart, Halliburton (HAL) :
MACD : On October 1, 2021, the signals on pierced up from below the histogram and have been moving toward the surface since then.
RSI : The signal bounced on January 20, 2020 at 32, steadily moving towards 60.
PRICE : Has been steadily moving up after bouncing on $4.5, around the ATL (All Time Low) already tested twice the 200MA signal below the 100MA and is pushing to move above this last one to test again its ATH (All Time High) around $70, which is the optimistic approach.
"In this business if you're good, you're right six times out of ten. You're never going to be right nine times out of ten. I've found that when the market's going down and you buy funds wisely, at some point in the future you will be happy. You won't get there by reading: "Now is the time to buy".
Today this ticker has a Volume of 6.917M.
This Company PAYS DIVIDENDS TO SHAREHOLDERS (DIVIDENDS YIELD 1.71%)
Halliburton Co. engages in the provision of services and products to the energy industry related to the exploration, development, and production of oil and natural gas. It operates through the Completion and Production, and Drilling and Evaluation segments. The company was founded by Erle P. Halliburton in 1919 and is headquartered in Houston, TX.
Good Luck!
Gráfico de 3M, Halliburton (HAL) :
MACD : El 1 de octubre de 2021, las señales se cruzaron por debajo del histograma y han mantenido su movimiento ascendente hacia la superficie desde entonces.
RSI : La señal rebotó el 20 de enero de 2020 a los 32, y desde ese momento, ha mantenido un movimiento ascendente constante hacia 60.
PRECIO : Se ha incrementado constantemente después de rebotar en $4.5, alrededor del ATL (All Time Low/Precio Histórico más Bajo) ya testeó ambas señales MA: 200MA por debajo de la 100MA y está presionando para moverse por encima de esta última para testear nuevamente su ATH (All Time High/Precio Histórico más Alto) alrededor de $70, que es el enfoque optimista.
"En este negocio, si eres bueno, tienes razón seis de cada diez veces. Nunca vas a tener razón nueve de cada diez. Descubrí que cuando el mercado está cayendo y compras fondos sabiamente, en algún momento en el futuro serás feliz. Nunca verás un anuncio que diga: "Ahora es el momento de comprar".
Hoy este ticker tiene un Volumen de 6.917M.
Esta Empresa PAGA DIVIDENDOS A LOS ACCIONISTAS (RENDIMIENTO POR DIVIDENDO 1.71%)
Halliburton Co. se involucra en la provisión de servicios y productos para la industria energética relacionada con la exploración, desarrollo y producción de petróleo y gas natural. Funciona a través de la finalización y la producción, y segmentos de perforación y evaluación. La compañía fue fundada por Erle P. Halliburton en 1919 y tiene su sede en Houston, TX.
¡Buena suerte!
“I believe in analysis and not forecasting.” / "Creo en el análisis y no en el pronóstico".
REMEMBER : I am not a financial adviser nor is any content in this article presented as financial advice. The information provided in this blog post and any other posts that I make, and any accompanying material is for informational purposes only. It should not be considered financial or investment advice of any kind. One should consult with a financial or investment professional to determine what may be best for your individual needs. RECUERDE : No soy un asesor financiero y el contenido de este artículo no se presenta como asesoramiento financiero. La información provista en esta publicación de blog y cualquier otra publicación que haga y cualquier material que la acompaña es solo para fines informativos. No debe considerarse asesoramiento financiero o de inversión de ningún tipo. Se debe consultar con un profesional financiero o de inversiones para determinar qué es lo mejor para sus necesidades individuales.

General Motors Company (GM) 1M Trading Analisys (TA)1M Chart, General Motors Company (GM) , on January, 2022, the signals on MACD pierced down from above the histogram and have been diving since, on February 2023 the signals are about to pierce up from below the histogram; The RSI signal bounced on June 2022 at 35, steadily moving towards 50; The price has been steadily moving up after bouncing on $30already tested twice the 200MA signal below the 100MA and is pushing to move above this last one to test again its ATH, which is the optimistic approach, but remember "In this business if you're good, you're right six times out of ten. You're never going to be right nine times out of ten. I've found that when the market's going down and you buy funds wisely, at some point in the future you will be happy. You won't get there by reading: "Now is the time to buy".
Today this ticker has a Volume of 9.862M.
This Company PAYS DIVIDENDS TO SHAREHOLDERS
General Motors Co. engages in the designing, manufacturing, and selling of trucks, crossovers, cars, and automobile parts and in providing software-enabled services and subscriptions. It operates through the following segments: GMNA, GMI, Cruise, and GM Financial. The company was founded by William C. Durant on September 16, 1908, and is headquartered in Detroit, MI.
Good Luck!
Gráfico 1M, General Motors Company (GM) , en enero de 2022, las señales en MACD se cruzaron desde arriba del histograma y han estado sumergidas desde esa fecha, hoy febrero de 2023, las señales están a punto de cruzarce desde debajo del histograma; La señal RSI rebotó en junio de 2022 en 35, moviéndose constantemente hacia 50; El precio ha estado subiendo constantemente después de rebotar en $30, ya probó dos veces la señal de 200MA por debajo de 100MA y está presionando para moverse por encima de este último para testear nuevamente su ATH, que es el enfoque optimista, pero recuerda: "En este negocio, si eres bueno, tienes razón seis de cada diez veces. Nunca vas a tener razón nueve de cada diez veces. Descubrí que cuando el mercado está cayendo y compras fondos sabiamente, en algún momento en el futuro serás feliz. No llegarás allí leyendo: "Ahora es el momento de comprar".
Hoy este ticker tiene un Volumen de 5.297M con una Capitalización de Mercado de 246B.
Esta Empresa PAGA DIVIDENDOS A LOS ACCIONISTAS
General Motors Co. se dedica al diseño, la fabricación y la venta de camionetas, crossovers, automóviles y repuestos de automóviles, y proporciona suscripciones y servicios basados en software. Opera a través de los siguientes segmentos: GMNA, GMI, Cruise y GM Financial. La empresa fue fundada por William C. Durant el 16 de septiembre de 1908 y tiene su sede en Detroit, MI.
¡Buena suerte!
“I believe in analysis and not forecasting.” / "Creo en el análisis y no en el pronóstico".
REMEMBER : I am not a financial adviser nor is any content in this article presented as financial advice. The information provided in this blog post and any other posts that I make, and any accompanying material is for informational purposes only. It should not be considered financial or investment advice of any kind. One should consult with a financial or investment professional to determine what may be best for your individual needs. RECUERDE : No soy un asesor financiero y el contenido de este artículo no se presenta como asesoramiento financiero. La información provista en esta publicación de blog y cualquier otra publicación que haga y cualquier material que la acompaña es solo para fines informativos. No debe considerarse asesoramiento financiero o de inversión de ningún tipo. Se debe consultar con un profesional financiero o de inversiones para determinar qué es lo mejor para sus necesidades individuales.

DOGECOIN USD (DOGEUSD) 1W Trading Analisys (TA)1W Chart, DOGEUSD , on February 14, 2023, the signals on MACD has been diving below the histogram since NOV2021 and started moving to the surface on August 2022, making their first push to break the ice on October 2022, sending the RSI from below 40 to 60 and the price pumping from $0.05 to $0,15, piercing both 100 & 200 days MA signals; The RSI signal reached 63 bounced back and was supported on 44 and is now facing NE staying steady over 40 after the price has been steadly climbing since October 2022, between $0.05 and $0.11, testing for the third time the 100 days MA signal from below, at this moment there is still plenty of room for the price to pierce the 100 days MA signal and test the 200 days signal by the $0.15 again, which is the optimistic approach, but remember "In this business if you're good, you're right six times out of ten. You're never going to be right nine times out of ten. I've found that when the market's going down and you buy funds wisely, at some point in the future you will be happy. You won't get there by reading: "Now is the time to buy". Today this ticker has a Volume of 443M with a Market Cap of 11.000M.
Good Luck!
Gráfico 1W, DOGEUSD , el 14 de febrero de 2023, las señales en MACD han permanecido sumergidas por debajo del histograma desde el Noviembre 2021 y comenzaron a moverse a la superficie en agosto de 2022, dando su primer impulso para romper el hielo en octubre 2022, enviando el RSI desde abajo 40 a 60 y el precio subiendo de $0,05 a $0,15, perforando las señales MA de 100 y 200 días; La señal RSI llegó a 63, se devolvió y se apoyó en 44 y ahora se enfrenta al NE manteniéndose estable sobre 40 después de que el precio ha estado subiendo constantemente desde el octubre 2022, entre $0,05 y $0,11, probando por tercera vez la señal MA de 100 días desde abajo, en este momento todavía hay mucho espacio para que el precio atraviese la señal MA de 100 días y vuelva a probar la señal de 200 días en $0.15, que es el enfoque optimista, pero recuerda: "En este negocio, si eres bueno, tienes razón seis de cada diez veces. Nunca vas a tener razón nueve de cada diez veces. Descubrí que cuando el mercado está bajando y usted compra fondos sabiamente, en algún momento en el futuro será feliz. Nuna se encontrara un anuncio que diga: "Ahora es el momento de comprar". Hoy este ticker tiene un Volumen de 443M con una Capitalización de Mercado de 11.000M.
¡Buena suerte!
“I believe in analysis and not forecasting.” / "Creo en el análisis y no en el pronóstico".
REMEMBER : I am not a financial adviser nor is any content in this article presented as financial advice. The information provided in this blog post and any other posts that I make and any accompanying material is for informational purposes only. It should not be considered financial or investment advice of any kind. One should consult with a financial or investment professional to determine what may be best for your individual needs. RECUERDE : No soy un asesor financiero y el contenido de este artículo no se presenta como asesoramiento financiero. La información provista en esta publicación de blog y cualquier otra publicación que haga y cualquier material que la acompañe es solo para fines informativos. No debe considerarse asesoramiento financiero o de inversión de ningún tipo. Se debe consultar con un profesional financiero o de inversiones para determinar qué es lo mejor para sus necesidades individuales.

GoldViewFX - Market UPDATEHey Everyone,
Our 1H chart setup is playing out with price hitting our retracement zone taking out both bearish targets. We are now also seeing EMA5 cross and lock below 1853 opening the swing range. This means we can easily see price challenge the remaining lower levels.
This part of the setup is within the swing range, which means taking longs from support levels, with quick exits on resistance levels will still allow you to bank pips. Taking sells to the support levels is also okay. However, we need to keep in mind there's gaps left above and also back to benchmark levels are also due above.
We have been observing today with no trades, as the market is ranging while MA's start to converge before a breakout. This range looks very temporary so its not wise for us to commit anything yet. Patience always pays off in this game and these are the times when it needs to be exercised.
The overall long term trend structure is still Bullish , so we just need to be smart in managing this current bearish structure without any big commitments. If we manage the range and the support and resistance levels, we can still trade this level to level.
BULLISH TARGETS
1867
1872
1876
EMA5 CROSS AND LOCK ABOVE 1884 will open 1896 and 1903
BEARISH TARGETS
1863 - DONE
1857 - DONE
EMA5 CROSS AND LOCK BELOW 1857 WILL OPEN 1853 - DONE. 1849, 1841 and 1833
SWING RANGE
1833
As always, we will keep you all updated with regular updates throughout the week and how we manage the active ideas and setups. Please don't forget to like, comment and follow to support us, we really appreciate it!
GoldViewFX
XAUUSD TOP AUTHOR

PFIZER (PFE) 6M Trading Analisys (TA)6M Chart, PFE , on February 6, 2023, the signals on MACD have been steadily moving NE, after piercing below the histogram on July 2012; On July 2021, reached its ATH (All Time High); The RSI signal bounced over 70 and is now facing SE to test the line of 50, after bouncing up from it on January 2020; The price has been steadily falling since the ATH, from $60 to $43, heading down to test the 100 days MA signal, at this moment there is a probability for the price to bounce up before continuing its way down to test the 100 MA signal, which is the optimistic approach, but remember "In this business if you're good, you're right six times out of ten. You're never going to be right nine times out of ten. I've found that when the market's going down and you buy funds wisely, at some point in the future you will be happy. You won't get there by reading: "Now is the time to buy".
Today this ticker has a Volume of 5.297M with a Market Cap of 246B.
This Company PAYS DIVIDENDS TO SHAREHOLDERS
Pfizer Inc. is a research-based global biopharmaceutical company. It engages in the discovery, development, manufacture, marketing, sales, and distribution of biopharmaceutical products worldwide. The firm works across developed and emerging markets to advance wellness, prevention, treatments, and cures that challenge the most feared diseases. The company was founded by Charles Pfizer Sr. and Charles Erhart in 1849 and is headquartered in New York, NY.
Good Luck!
Gráfico de 6M, ( PFE ), al 6 de febrero de 2023, las señales en MACD se han estado moviendo constantemente hacia el NE, luego de cruzarse por debajo del histograma en julio de 2012; En julio de 2021, alcanzó su ATH (Mayor Precio Histórico); La señal RSI rebotó sobre 70 y ahora se dirige al SE para probar la señal de 50, luego de rebotar ahi en enero de 2020; El precio ha estado cayendo constantemente desde el ATH, de $60 a $43, bajando para probar la señal de 100 días MA, en este momento existe la probabilidad de que el precio rebote antes de continuar su camino hacia abajo para probar la señal de 100 MA, que es el enfoque optimista, pero recuerda: "En este negocio, si eres bueno, tienes razón seis de cada diez veces. Nunca vas a tener razón nueve de cada diez veces. Descubrí que cuando el mercado está cayendo y compras fondos sabiamente, en algún momento en el futuro serás feliz. No llegarás allí leyendo: "Ahora es el momento de comprar".
Hoy este ticker tiene un Volumen de 5.297M con una Capitalización de Mercado de 246B.
Esta Empresa PAGA DIVIDENDOS A LOS ACCIONISTAS
Pfizer Inc. es una compañía biofarmacéutica global basada en la investigación. Se dedica al descubrimiento, desarrollo, fabricación, comercialización, venta y distribución de productos biofarmacéuticos en todo el mundo. La firma trabaja en mercados desarrollados y emergentes para promover el bienestar, la prevención, los tratamientos y las curas que desafían las enfermedades más temidas. La empresa fue fundada por Charles Pfizer Sr. y Charles Erhart en 1849 y tiene su sede en Nueva York, NY.
¡Buena suerte!
“I believe in analysis and not forecasting.” / "Creo en el análisis y no en el pronóstico".
REMEMBER : I am not a financial adviser nor is any content in this article presented as financial advice. The information provided in this blog post and any other posts that I make, and any accompanying material is for informational purposes only. It should not be considered financial or investment advice of any kind. One should consult with a financial or investment professional to determine what may be best for your individual needs. RECUERDE : No soy un asesor financiero y el contenido de este artículo no se presenta como asesoramiento financiero. La información provista en esta publicación de blog y cualquier otra publicación que haga y cualquier material que la acompaña es solo para fines informativos. No debe considerarse asesoramiento financiero o de inversión de ningún tipo. Se debe consultar con un profesional financiero o de inversiones para determinar qué es lo mejor para sus necesidades individuales.

GoldViewFX - DAILY CHART UPDATED STRUCTUREHey Everyone,
The daily chart saw a rejection from the resistance zone driven by news into just above 1857 Goldturn support. However 1857 is not a strong weighted Goldturn and therefore if momentum continues we may see further move down to 1817, which is a stronger support level for a reaction in price. 1817 area is also inline with MA63, which may also provide some dynamic support and we are also likely to see the remaining MAs magnetise up to form a consolidation area of support.
Our plans to buy dips is still in play and now that we have seen a nice drop in price, we just need to be patient and let the momentum exhaust and then we can safely start taking positions from retests all over again.
Banking in stages with our strategy to buy dips at 30 to 50 pips at a time, instead of chasing the bull by the horn, allowed us to take a perfect exit riding the entire bull run without getting stuck at the top. This is the GVFX style of trading!!
This week is about being patient and waiting for establishing a fresh Blueprint and then we can start HUNTING again. PLEASE BE PATIENT!!!!
As always, we will keep you all updated with regular updates throughout the week and how we manage the active ideas and setups. Please don't forget to like, comment and follow to support us, we really appreciate it!
GoldViewFX
XAUUSD TOP AUTHOR

BBBY $ BREAKOUT we got the first sign of reversal once we broke from our bearish channel down below, and now we have a resistant to break around the 3.62$ in order to go to the first profit taking the 4.40$ then the second profit taking and sequeeze level if we broke it around the 5.60. howvere if we go rejected we going to fill the gap above our EMA.

GoldViewFX - Market UPDATE - FOMC Hey Everyone,
As you can see our 1H chart is back in play as we find price playing between both structures with the retracement zone playing support again after riding back up from the swing range.
We have FOMC today so extra caution in managing risk and range.
FOMC PLAN
Newbies should not trade FOMC, as too risky if you have not learnt how to manage swings.
Overall we remain Bullish and therefore even if price drops due to news, it will find its way up again. Therefore, we need to keep this in mind and wait for better entries entry should the price drop. Our plan to buy dips remains in play.
EMA5 is bouncing between 1924 and 1931 Goldturn levels. We would look to see which is broken with EMA5 first to track movement to the next Goldturn. As we stand all our bearish and 1 bull target has been HIT with only 1937 and 1946 left in the range.
As always, we will keep you all updated with regular updates throughout the week and how we manage the active ideas and setups. Please don't forget to like, comment and follow to support us, we really appreciate it!
GoldViewFX
XAUUSD TOP AUTHOR

GoldViewFX - Market UPDATEHey Everyone,
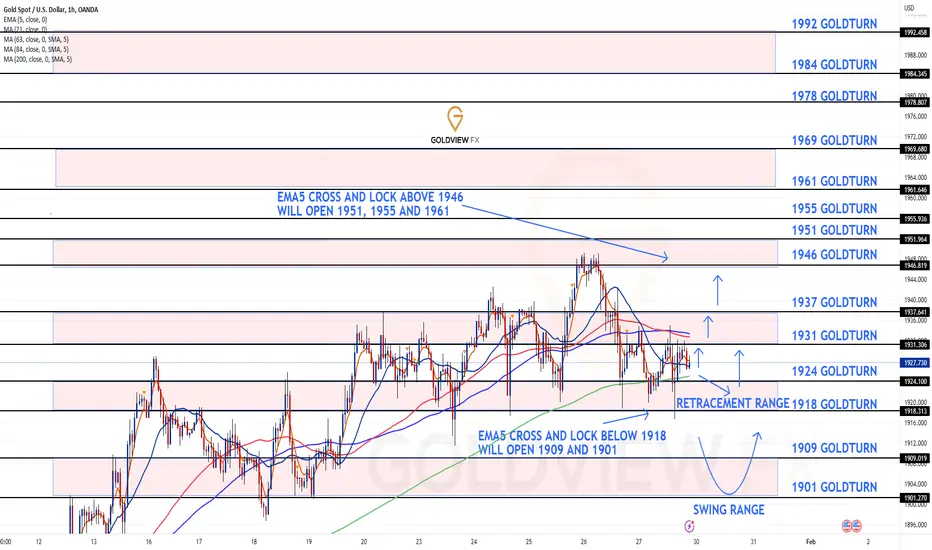
It is truly amazing to see our chart idea play out and how effective our Goldturn ema5 cross and lock strategy is in measuring the momentum of price. Take for example todays 1918 cross and lock, which we highlighted on this chart, stating it will open the swing range down to 1901 for the swing. This was precise measurement, which allowed us to slow down in buying dips to wait for the deeper retracement to buy heavier from the bottom to ride up. - This played out beautifully!!!
Our plans to buy dips from support levels are still in play and we will continue to track the movement level to level using EMA5 cross and lock.
BULLISH TARGETS
1931 - DONE
1937 -
1946 -
EMA5 CROSS AND LOCK ABOVE 1946 WILL OPEN 1951, 1955 AND 1961
BEARISH TARGETS
1924 - DONE
1918 - DONE
EMA5 CROSS AND LOCK BELOW 1918 WILL OPEN 1909 AND 1901
SWING RANGE
1901 - DONE
As always, we will keep you all updated with regular updates throughout the week and how we manage the active ideas and setups. Please don't forget to like, comment and follow to support us, we really appreciate it!
GoldViewFX
XAUUSD TOP AUTHOR

GoldViewFX - 1H CHART UPDATED LEVELS & TARGETSHey Everyone,
Please see our updated 1H chart Goldturn support and resistance levels and targets.
As you can see price has been ranging between 1918 - 1946 and the retracement zone has been tested and respected more than once. When a support or resistance area is tested more than once, it usually strengthens that level further. We would need to see 1918 broken with ema5 to open the lower levels into the swing range or we are likely to see another challenge back up to 1946.
We would need to see ema5 cross and lock above 1946 to open upper levels upto the next structure. Our plans to buy dips from support levels are still in play and we will continue to track the movement level to level using EMA5 cross and lock.
BULLISH TARGETS
1931 -
1937 -
1946 -
EMA5 CROSS AND LOCK ABOVE 1946 WILL OPEN 1951, 1955 AND 1961
BEARISH TARGETS
1924 -
1918 -
EMA5 CROSS AND LOCK BELOW 1918 WILL OPEN 1909 AND 1901
SWING RANGE
1901
As always, we will keep you all updated with regular updates throughout the week and how we manage the active ideas and setups. Please don't forget to like, comment and follow to support us, we really appreciate it!
GoldViewFX
XAUUSD TOP AUTHOR
GoldViewFX - Market UPDATEHey Everyone,
Another PIPTASTIC day for us waiting patiently for the price to retrace, as we rode up all the way into the resistance structure yesterday. Today we waited for the rejection back into the retracement range for a clean signal activation and take profit of 50 PIPS and trailing.
We are also keeping in mind yesterdays breakout of the resistance structure with ema5 cross and lock above 1945 confirming there is more left to this bull run. We will continue with our plans to buy dips and will use our signals and Goldturns to navigate up and down to pick safe entries and exits.
Our 1H and 4h Chart ideas are now complete. However, as price is back in the range, we can continue to track the same setup until we prepare our multi timeframe analysis for the coming week on Sunday.
BULLISH TARGETS
1930 - DONE
1934 - DONE
1940 - DONE
BEARISH TARGETS
1924 - DONE
1918 - DONE
EAM5 CROSS AND LOCK BELOW 1918 WILL OPEN 1911, 1904 AND 1895
SWING RANGE
1895
As always, we will keep you all updated with regular updates throughout the week and how we manage the active ideas and setups. Please don't forget to like, comment and follow to support us, we really appreciate it!

DKS showing downside to come to $103.03 with a warningRising Wedge (Bearish) has formed on Dicks Sporting Goods.
We have the price yet to break below the Wedge, which then the price will come down to the 1st target - $103.03
CONCERNS:
The 7>21 (Bullish).
RSI >50 (Bullish)
Price is above 200MA...
This is what I call a LOW probability trade because we have mixed signals of buying and selling. However, the chart pattern is potentially predicting a change to the downside. So my bias is bearish despite the positive lagging bullish indicators.
General info:
DKS is one of the largest sports retail company listed on the NYSE that specializes in selling sports equipment, clothing, and accessories.
It was founded in 1948 by Richard "Dick" Stack in Binghamton, New York and has over 600 stores in the US.

GoldViewFX - 1H CHART UPDATED LEVELS & TARGETSHey Everyone,
Please see our 1H charts with updated Goldturn support and resistance levels and targets. We have also marked all the structured zones that will allow us to identify potential breakouts to the next zone and allow us to navigate this up and down level to level.
We had EMA5 crossing above 1924 opening the upper levels, which one by one got hit. However, it left a target at 1940 open and retraced back looking for support. The levels above are now all open once again.
We will continue with our plans to buy dips and will use our Goldturns to identify and navigate up and down and pick out safe entries and exits.
EMA5 CROSS AND LOCK ABOVE 1924 OPENNED THE FOLLOWING TARGETS
BULLISH TARGETS
1930
1934
1940
BEARISH TARGETS
1924
1918
EAM5 CROSS AND LOCK BELOW 1918 WILL OPEN 1911, 1904 AND 1895
SWING RANGE
1895
As always, we will keep you all updated with regular updates throughout the week and how we manage the active ideas and setups. Please don't forget to like, comment and follow to support us, we really appreciate it!
GoldViewFX

GoldViewFX - WEEKLY CHART UPDATEHey Everyone,
This is the weekly chart we have been tracking and following for our long-term targets and as you can see this is playing out perfectly.
As highlighted last week, we got the EMA5 cross and lock above 1858 with our next target of 1928 HIT last week. The weekly candle failed to close above this level , which may now follow with some retracement but ultimately the last longer range target above remains open, now that we have the cross and lock above 1858.
As you have seen previously, while tracking the weekly chart, we will see swings up and down and a slow climb starting with candle body closes followed with ema5 detachment touches down for retracements, before we get a push up to hit the next targets.
Looking at historical movements in this range, we will keep in mind expected swings down, which have historically been good buying opportunities from the dips
We will use our smaller timeframe setups to navigate and trade this range level to level.
As always, we will keep you all updated with regular updates throughout the week and how we manage the setups. Please don't forget to like, comment and follow to support us, we really appreciate it!
GoldViewFX
XAUUSD TOP AUTHOR

GoldViewFX - MONTHLY CHART LONG TERM GOLD OUTLOOKHey Everyone,
This is our Monthly setup that we have been tracking and trading for the last 4 months and as you can see this has played out perfectly hitting all our Bull targets like we projected. Please review the last 4 months update on this chart so you will be able to see how well this played out.
We are now at strong resistance zone and although there is room for tests above highlighted by our last arrow into the test zone, its an area where a lot of traders will get stuck both ways. Historical data shows, although this level of zone is a resistance area, we see aggressive movements into the upper areas without price being able to sustain itself, which always leads to wick outs.
We are now likely to get those tests above followed with retracements. It is crucial for us to use our smaller timeframes to navigate potential swings and capitalise on the move.
We will now also slow down with our intraday trading, as the next 4 weeks will be crucial in terms of long term direction for gold. If the test zone manages to secure candle body closes then we can also gear up for a test to all time high and potentially beyond this year.
Please don't forget to like, comment and follow to support us, we really appreciate it!
GoldViewFX
XAUUSD TOP AUTHOR
