EURUSD BermundaHi guys, this is EURUSD short idea for make some pips...
I hope it will be interesting.
Tradingidea

GBPUSD ScalpAs we see, here we have strong and beautiful resistance level.
The price will go down and test previous levels. TP: 1.35659 (30-33pips).

E-mini Nasdaq-100 Trading Setup for sellers ^)We have completed cup and handle pattern here...
So after the price is still high!
We may see some price gain additional, something like 13-18% .
So we have two option here for the sellers, wait and sell from marked point 1 or 2 .
P.S. This is very long time range position. ( Something like 200-800 day ).
Have a profit in your day!
Thanks.

BTCUSD - 1H. TECH.In this trading idea, we are reviewing the last price movement of Bitcoin/USD
I hope this video analysis will have a good and positive effect on your trading perspectives!
Wishing you profits in your trades.

USDJPY - MR.GRINGO ThinkingsHello everybody.
Today, we have some discussion about this pair but only with using Technical ways.
The pair right now is very long, maybe 80 days' time period in trouble situation. I mean, the bears have the market of it...
As we see, this 80 day was so strong bearish range, but it's great try for bulls now!
We may have a hope, the price will go up with this next side of the acceding triangular figures.
We may open long position on the price 143.603 or Just make entry for long now.
If you will follow this trading idea, there we will have "the main" resistance levels.
They are...
1. 145.735
2. 146.892
3. 148.048 yes. so I recommend this price levels, because the market will check it maybe later... For sure if you think buy.
Have a profit maker day! :) ^)

NZDCAD - TECH.Hello dear Traders,
Hello TradingView!
Today, in this chart, we will have some technical views about NZDCAD.
ABCD pattern triangle for this time looks like it has lost its weight, and soon the price will start coming down...
The price is still testing the bottom level of the ABCD triangle pattern.
My recommendation on this pair is to wait for a good sell opportunity...
TP1: 0.81669
TP2: 0.81360
Wishing you good luck and a profitable day!

EURUSD - TECH. 2Hello Traders! It's Nika.
In this technical work, as we see here, there is a few things happening at the same moment.
First thing to focus on is that we have formatting double double-head acceding triangle.
We need wait or also go short for that with small time period. After that my prediction is the price will enter that channel in price range 1.13917 - 1.13247. So, after that we can wait for the market price confirmation and only after going Buy or Sell.
After all, what we got here is two good options.
1. Open short when market will open until the price will hit "Double-head acceding triangle" bottom.
2. Go into the position after a few days, when the price will enter & left channel range 1.13917 - 1.13247.
In long time period sell and buy probability, there is price marks on chart! So, you can use it as your TP.
Thank you!
Have a profitable day. :)

BTC, where we can setup our sell positions.Hello, dear traders! It's Nika again.
I want to share this beautiful pattern and tell you some about its meaning...
---
So, as we see here, we have this "triangular-shaped uprising pattern".
We got this pattern with its own few supporting and formatting levels.
Almost all of them are marked on our chart!
---
The "usage" of this may be something like this...
First, we may see the price testing an important price level of pattern 96,000,00 very soon...
---
After, if the price continues checking support levels below, we may also see the 91 & 89 K price levels.
You will profit from this price movement only if the price goes this way. :)
---
Wishing you a happy trading day and much more success in your trades!
---
If you have any questions, please comment or send a message.
Thank you!

GBPUSD - Technical analysis 2HGood morning, traders, dear TradingView. It's Nika.
I want to share this trading idea, for a reason we have very important resistance level breakout!
I think the price of this pair will continue growing and will reach level 1.37097!
So some of you can just open long now, or wait and enter after a little correction.
Thank you.
Have a profitable day.

Bull market scenario LITECOINAt this period, I'm speaking about LITECOIN, which currently has one of the strongest bull-looking charts on cryptocurrency!
We may see the price testing Fibo's higher levels very soon...
A bull market may begin, so I recommend focusing on higher price markings...
On another market, like BTC, Ethereum, or Pepe, we do not have vivid bull pictures.
That was one of the reasons for making this trading analysis...
Enjoy!

Etherium Trading Idea, Also for BTC and AltcoinsHello again.
We have some speaking about the price movement and about this pattern formation that I call BAT with WINGS , or Flying BAT .
- I hope you will find something useful in this Trading Idea.
Thank you, Have a nice day.

EURAUD - Technical analysisHello dear traders! Welcome to this trading idea...
First, we have a few trading options here.
1. We can open short right now, with a small target profit at the previous resistance level...
2. Wait until the price tests our resistance level and sell or buy only after that.
3. Shorting position after the price comes down, an uprising diagonal (green) line, and will break down our marked red line price marking level.
In this situation, what we are waiting for is a selling opportunity. SELL
But... If the pair becomes bullish, we may go long later.

CHFJPY - Scalping is Back! Let's see...Hi guys. I will just be scalp here.
Entry price: 173.884 TP: 173.332 SL: 174.438 Win/Loss Ratio 1:1!
Let's do some good scalp! ^^

NZDCAD - TECH.Hello everybody! It's Nika.
As we can see, we have triple bottom support. Maybe not only that, but here is also rising support channel.
Have a nice trade.

XAUUSD Deep Analysis Using Neural Networks Technology #xauusdThis analysis by ss7trader neural networks technology. this will higher chance to hit the take profit target and if you need any help or question then you can ask me on tradingview @ss7trader mostly i am available or you can also comment in the idea. also must like share the idea to getting these type of market analysis daily basis.

WIF/USDT - Fresh meme coin. Trading setup in chanal. Popular fresh meme coin – Dogwifhat
📊 CoinMarketCap Rank: #102
🐦 Twitter (X) : 152K followers
💬 Telegram : 50K members
✅ Highly liquid meme coin – traded on many major exchanges, including Binance.
After the hype phase , the coin is now declining along with the overall crypto market —no exceptions. Essentially, it broke below multiple channel supports , and the price is now sitting at the support of the outer channel.
I also notice a non-textbook Head & Shoulders pattern, which suggests a potential -64% breakdown . The last squeeze happened around this level.
Currently, we are seeing consolidation with increased volume , along with high-wick price action in this zone.
I've marked potential downside support zones as well as upside resistance targets on the chart. Consider this in your trading strategy!

XAUUSD Sniper Zones – May 9 Structure Locked. Zones Refined. Let’s Hunt Clean Entries.
Current Price: 3334
Bias: Mixed (HTF Bullish | LTF Bearish Premium Rejection)
Flow: In consolidation after sweep & rally — waiting for liquidity shift and clear SMC confirmations.
🔻 SELL ZONES (No entries without confirmation!)
🔴 Zone 1: 3365–3375
📍Confluence: LH + unmitigated OB + FVG inside premium
🔍 Wait for clear M5 CHoCH + bearish BOS before pulling trigger.
🔴 Zone 2: 3410–3422
📍Confluence: FVG + Internal Range Premium Liquidity
🔍 Only short after SMC reversal + candle body rejection in zone.
🔴 Zone 3: 3448–3455
📍Confluence: High timeframe OB + Weekly Supply + Final liquidity trap
🔍 This is the kill-shot sniper zone — wait for aggressive reaction or internal M5 break.
🔹 BUY ZONES (No buys unless structure shifts clean!)
🟢 Zone 1: 3306–3314
📍Confluence: Last BOS + bullish breaker block + EQ area
🔍 Look for M5 BOS + retest confirmation.
🟢 Zone 2: 3264–3274
📍Confluence: Untapped demand + internal liquidity sweep
🔍 Watch for aggressive rejection wick + bullish CHoCH confirmation.
🟢 Zone 3: 3225–3235
📍Confluence: Strong LTF OB + higher timeframe discount zone
🔍 High RISK/High REWARD sniper swing area. Wait for clear LTF BOS + strong bounce.
⚔️ Key Zones Above Price:
🔹 3365 (minor premium flip)
🔹 3410–3422 (major supply/FVG)
🔹 3448–3455 (HTF kill zone)
🛡️ Key Zones Below Price:
🔹 3306–3314 (LTF OB + structure demand)
🔹 3264–3274 (liquidity pocket)
🔹 3225–3235 (HTF reentry demand)
🧠 Final Note:
This isn’t for gamblers. You don’t "predict" Gold — you react to liquidity, imbalance, and SMC shifts. These sniper zones are valid only with confirmation. No CHoCH/BOS = no entry. Full stop.
✨ We’re building something smarter than just signals — it’s a sniper mindset. If this helped your vision, show some love below.
💬 Drop a comment, leave a like, and follow for more clean logic and zero fluff.
🔐 Let’s trade like pros!
With you in the flow,
GoldFxMinds (GoldMindsFX) 💛

Gold Reaction Zones for April 22XAUUSD – Intraday Reaction Zones
Smart Money Concepts | 1H + 4H Structure
NY Session Focus
🔻 SELL ZONES (Above Price)
1️⃣ 3500 – 3503
🔸 Psychological round number
🔸 Inefficiency + liquidity magnet
🔸 Watch for reversal wick or M15 CHoCH
2️⃣ 3472 – 3478
🔸 1H supply + previous rejection wick
🔸 Already caused a strong move down
🔸 Valid for short on second test with confirmation
3️⃣ 3564 – 3568
🔸 4H unmitigated supply zone
🔸 High-impact reversal area
🔸 Only in play if NY breaks out with strength
🟢 BUY ZONES (Below Price)
1️⃣ 3440 – 3447 (Currently in play)
🔹 1H OB + imbalance combo
🔹 First support zone for potential bullish reaction
🔹 Watch for rejection or confirmation before entry
2️⃣ 3410 – 3416
🔹 BOS origin zone on 1H
🔹 Imbalance + clean structural base
🔹 Stronger foundation for longs if 3440 breaks
3️⃣ 3350 – 3362
🔹 4H demand
🔹 Multiple rejections and accumulation in past sessions
🔹 Valid for bounce if deeper selloff continues
🧠 Market Context
Price broke below 1H HL at 3462 → currently pulling back
HTF structure still bullish, but intraday flow is bearish
NY may hunt liquidity into lower zones before reversal
Confirmation is key — no blind entries
📌 Important Notice!!!
The above analysis is for educational purposes only and does not constitute financial advice. Always compare with your plan and wait for confirmation before taking action.

Tyree Thomas Jr Buy GBP/CAD Bias 4/8/25I looked at GBP/CAD and checked the pair with the key points of my trading strategy. My trade idea is to enter a buy when the pair breaks out of the Fibonacci Retracement tool and then take profit at the first green line of the Fibonacci Extension tool. My name is Tyree Thomas Jr, and this is my bias of GBP/CAD for a buy.

Trading opportunity for API3USDTBased on technical factors there is a Sell position in :
📊 API3USDT
🔴 Sell Now
🪫Stop loss 1.250
🔋Target 0.820
📏 R/R 1,5
💸RISK : 1%
We hope it is profitable for you ❤️
Please support our activity with your likes👍 and comments📝

Trading opportunity for BIDUSDTBased on technical factors there is a Buy position in :
📊 BIDUSDT
🔵 Buy Now
🪫Stop loss 0.04350
🔋Target 0.08000
📏 R/R 2,6
💸RISK : 1%
We hope it is profitable for you ❤️
Please support our activity with your likes👍 and comments📝

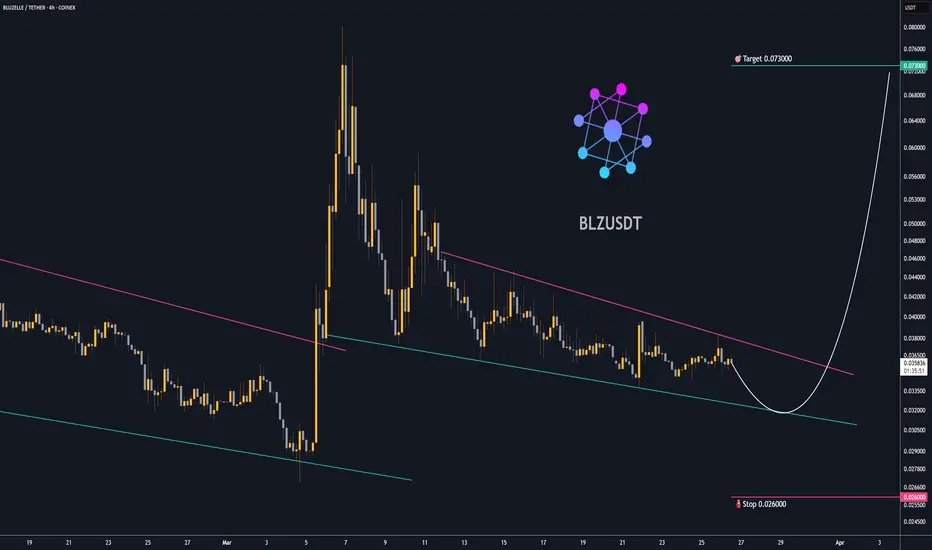
Trading opportunity for BLZUSDTBased on technical factors there is a Buy position in :
📊 BLZUSDT
🔵 Buy Now
🪫Stop loss 0.026000
🔋Target 0.073000
📏 R/R 3,8
💸RISK : 1%
We hope it is profitable for you ❤️
Please support our activity with your likes👍 and comments📝
XAUUSD The ultimate Sniper Entry Plan for 25 March 2025XAU/USD - Daily Review & Sniper Entry Plan - March 25th, 2025
✨ Overall Bias:
Monthly: Bullish, but with a candle showing exhaustion, potential pullback towards discount.
Weekly: Indecision, but we have a small CHoCH on the structure - possible correction towards the 2980 zone.
Daily: Clear bearish candle on Friday, followed by a mild correction on Monday. Liquidity grab below 3000, but close above.
🌐 Timeframe Breakdown:
D1:
Last confirmed CHoCH.
Imbalance and FVG in the 3022-3035 zone.
Potential bearish OB between 3031-3036.
RSI below 50, momentum fading.
H4:
Lower highs / lower lows structure.
Bearish confirmation: BOS + rejection from OB.
Imbalance 3016-3026.
EMA 21 and 50 acting as dynamic resistance.
H1:
Last CHoCH in the 3024 zone.
Bearish engulfing confirmation.
Unfilled FVG: 3016-3020.
RSI < 40, increasing volume on bearish candles.
M30 / M15:
BOS on M15 and retest in the area of interest.
Last swing high at 3018.13.
Liquidity above 3018 and 3024 (EQH), below 3000 (EQL).
🔹 Sniper Entry Scenarios
Scenario 1 (Short)
Entry: 3018 - 3022 (FVG zone + OB + 61.8% Fibonacci)
Confirmation: M15 bearish engulfing or BOS + retest.
SL: above 3028
TP1: 3000
TP2: 2985 (discount zone + liquidity)
Scenario 2 (Long - Countertrend/Scalp)
Entry: 2985 - 2990 (liquidity zone )
Confirmation: M15 BOS + bullish pattern (engulfing/pin)
SL: below 2979
TP1: 3000
TP2: 3015
🔹 POI (Key Zones):
3022-3028: FVG + OB + 61.8% Fibonacci - potential short zone
3018.13: EQH - liquidity inducement
2985: Daily OB + 78.6% Fibonacci - potential buy zone
🌍 EMA Guide:
EMA 5 < 21 on H1 and M30: bearish momentum
EMA 50 acting as dynamic resistance (on H1: 3022)
🔹 Conclusion: Favorable short on retracement to the 3018-3022 zone with confirmation. Target remains the 2985 zone for liquidity. Market response around 2985 will give clarity for potential buy/scalp.
⏳ Expectations: After the Daily close, we can expect liquidity inducement towards 3020+, followed by a dump towards 2990-2985.
🔔 Don't forget to Like, Share, and Follow for more updates! Let's hit that target together! 💰📈
👉 Like if you found this helpful and follow for future setups!
