USDCAD: Possible Bounce from channel line and previous lowsUSDCAD. The pair is approaching critical support area at 1.2420-30. There lies the trendline of the channel that contains the move, previous lows and S1 support from hourly pivots. We will set BUY orders at these levels. We will set our stops below 1.2385 targeting 1.2460 and 1.2485.
Tradingidea

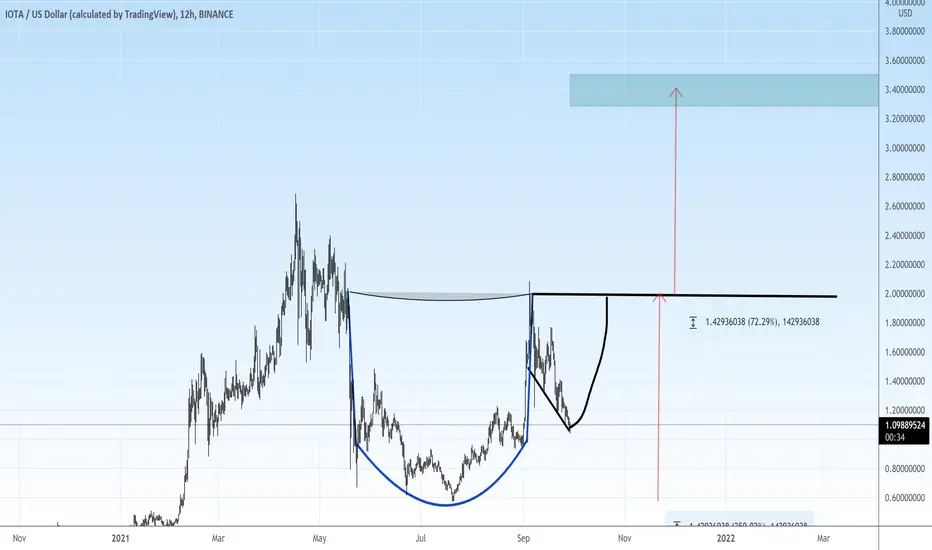
Cup And Handle PatternChart shows the possibility of the Cup And Handle Chart Pattern and it's target.


Nano bull flag trading #nano #btc #tradingBullish flag formations are found in stocks with strong uptrends and are considered good continuation patterns.
Entry possibilities:
bottom of the flag
Breakout of the flag
StopLoss:
Below the flag
Target:
50% of the pole and 90% of the pole after breakout.


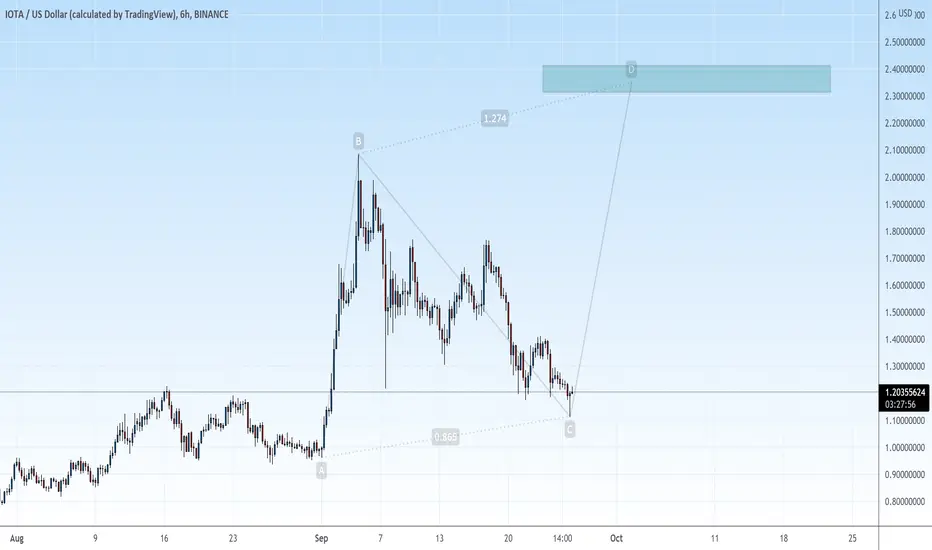
Right Angled Descending Broadening WedgeChart shows the possibility of the Right Angled Descending Broadening Wedge Pattern and it's target.
A right-angled descending broadening wedge is a bullish reversal pattern.

Descending Broadening Wedge PatternThe descending broadening wedge is a reversal pattern and is bullish in nature.

Google, 7 OCT - Elliott waves | Gann | Astrology $GOOGAlphabet, as expected, bounced off the 20 week MA (in red), and we closed longs at Gann level 2651. But the count hints at more downside in the mid-term.
Since the ATH, price declined in ABC patterns, so that we can assume a WXY or a complex ABC is unfolding.
If correct, sellers may step in at the 20D MA again. A possible area is the blue box (.618 to .786 Fib).
Ascendant conjuncts natal Jupiter on 9 OCT. The following trading days 11-12 OCT have higher probability for bearish price action. We may watch out for an expansion of volatility again. A short idea could be interesting at that point, however needs further confirmation.
______________
www.constellations.trade
In my analyses I combine Elliott waves, Gann theory, and planetary aspects to identify turning points in the markets & derive high-probability trading ideas. The strategy is to build leveraged exposure when markets are likely to expand, and to use options premium decay for consistent income when markets may contract and range.
Open an account here if you'd like to support my work:
TastyTrade
America's best Options, Futures and Crypto broker
start.tastyworks.com
Deribit
The world's most liquid Bitcoin options platform
www.deribit.com
Binance
10% off trading fees with this link:
accounts.binance.me
These abbreviations in the chart describe ideas that are provided as educational information and do not constitute financial advice:
STO = sell to open
BTC = buy to close
BTO = buy to open
STC = sell to close
TD = Theta Decay (for example a strangle or iron condor)
Disclaimer:
The views and ideas expressed in this analysis are that of the maker. They are provided as educational information and do not constitute financial or trading advice.

Cup And Handle Chart Pattern - GBPUSD Chart shows the possibility of the Cup And Handle Chart Pattern and it's target.

Right Angled Ascending Broadening Wedge - Dollar IndexChart shows the possibility of Right Angled Ascending Broadening Wedge Chart Pattern and it's target.
A right-angled ascending broadening wedge is a downward reversal pattern. The pattern is formed by two diverging lines, the support is a horizontal line and the resistance is an oblique bullish one, so it is an inverted descending triangle. ... Each line must be touched at least twice to be validated.

GBPUSD: Possible continuation towards 1.3610-20GBPUSD: The PP0, EMA 89, Fibos and previous tops, mark an intraday support for the pound. The next important resistance area stands at 1.3600-10.
We will try long positions the 1.3620-40 area, setting the stops below 1.3570,targeting 1.3590-00.

Wyckoff Method Chart Pattern - GBPUSDChart shows the possibility of the Wyckoff Method Chart Pattern and it's target.

Elliot 5 Wave Chart Pattern Chart shows the possibility of the Elliot 5 Wave Chart Pattern and it's target.

EURUSD: Testing the channel's bottom and Sep- Nov 2020 lows.EURUSD is testing the channel as seen in the chart and the important Sept-Nov lows of 2020. The move is likely to continue even lower as the momentum is strong enough. RSI is at extreme oversold levels making a new low as the most probable scenario.
We think that the 1.1600-10 area will hold the move for today. Although it is a risky trade we will at buy the 1.1600-10 area. We will set our stops below 1.1570 targeting 1.1630-40. There we will search for SELL positions.

Cup And Handle Chart PatternChart shows the possibility of the Cup And Handle Chart Pattern and it's target.

Cup And Handle Chart PatternChart shows the possibility of the Cup And Handle Chart Pattern and it's target.

Right Angled Descending Broadening Wedge PatternChart show the possibility of the Right Angled Descending Broadening Wedge Pattern and it's target.

GBPUSD: Buy the double bottomGBPUSD: The pound doesn't seem to go anywhere and it may continue its short term sideways movement.
We are buyers at the 1.3655-65 area for a short term bounce at 1.3700-05. We will set tight stops below 1.3645.

EURUSD: Buy the false breakEURUSD: Buying the reversal candle in the hourly chart.
Stop 5 pips below the low of the candle. Target 1.1710

AUDUSD: Approaching important resistance area at 0.7315-20AUDUSD: The area of 0.7315-20 is the first important resistance for today as it contains the previous highs and the PP R2. We will try short positions at 0.7315. We will set our stops above 0.7336 targeting 0.7290.

EURUSD: The Inverted H&S Formation is still in play.EURUSD. The bullish daily candle after the FOMC and the inverted H&S pattern that is forming in the 1H chart, are keeping the bullish scenario for EURUSD intact.
We are holding our long positions open and expecting for an initial break of the 1.1730-35 resistance in order for our scenario to be validated (the upper trendline of the downward channel) .
The break of 1.1750-55 with a dynamic candle will give confirmation. Initial target is at 1.1790-00 and next target is at 1.1825-30.
