GOLD ROUTE MAP UPDATEHey Everyone,
Another great day on the markets today, allowing us to bounce between the Goldturns, inline with our plans to buy dips. Not much to report as we are seeing Gold range sideways consolidating ready for a breakout.
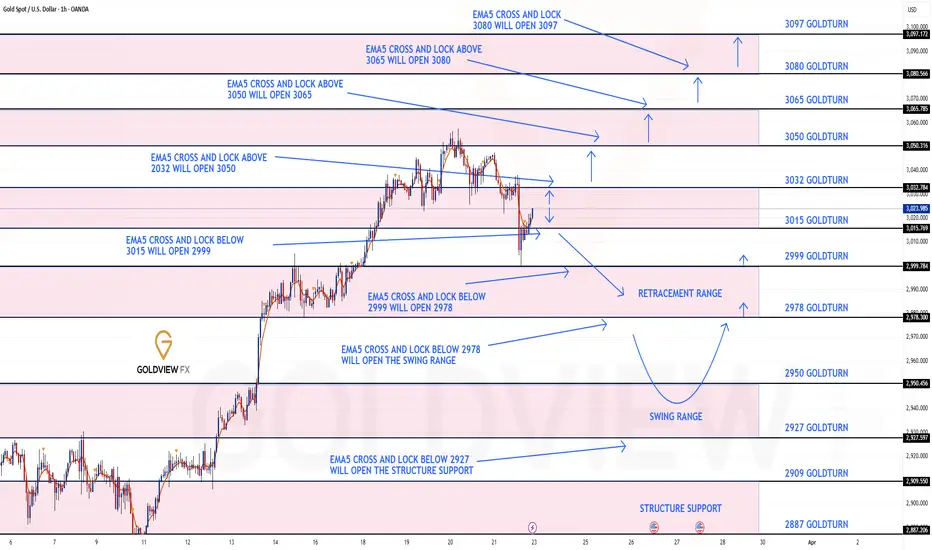
We still have the gap left open at 2999, which fell short by a few pips. We will continue to use the lower Goldturns to buy dips until we see the weighted levels cross and lock to confirm the next range. Failure to break 3032 will keep seeing rejections into the lower Goldturns for the bounces.
We will keep the above in mind when taking buys from dips. Our updated levels and weighted levels will allow us to track the movement down and then catch bounces up.
We will continue to buy dips using our support levels taking 30 to 40 pips. As stated before each of our level structures give 20 to 40 pip bounces, which is enough for a nice entry and exit. If you back test the levels we shared every week for the past 24 months, you can see how effectively they were used to trade with or against short/mid term swings and trends.
BULLISH TARGET
3032 - DONE
EMA5 CROSS AND LOCK ABOVE 3032 WILL OPEN THE FOLLOWING BULLISH TARGET
3050
EMA5 CROSS AND LOCK ABOVE 3050 WILL OPEN THE FOLLOWING BULLISH TARGET
3065
EMA5 CROSS AND LOCK ABOVE 3065 WILL OPEN THE FOLLOWING BULLISH TARGET
3080
EMA5 CROSS AND LOCK ABOVE 3080 WILL OPEN THE FOLLOWING BULLISH TARGET
3097
BEARISH TARGETS
3015 - DONE
EMA5 CROSS AND LOCK BELOW 3015 WILL OPEN THE FOLLOWING BEARISH TARGET
2999
EMA5 CROSS AND LOCK BELOW 2999 WILL OPEN THE FOLLOWING BEARISH TARGET
2978
EMA5 CROSS AND LOCK BELOW 2978 WILL OPEN THE SWING RANGE
SWING RANGE
2950 - 2927
As always, we will keep you all updated with regular updates throughout the week and how we manage the active ideas and setups. Thank you all for your likes, comments and follows, we really appreciate it!
Mr Gold
GoldViewFX
Tradingideas

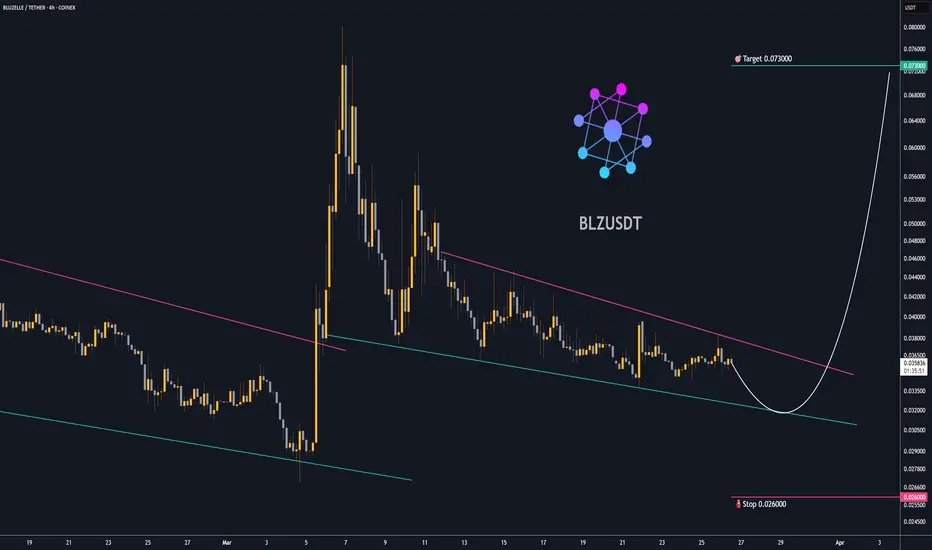
Trading opportunity for BLZUSDTBased on technical factors there is a Buy position in :
📊 BLZUSDT
🔵 Buy Now
🪫Stop loss 0.026000
🔋Target 0.073000
📏 R/R 3,8
💸RISK : 1%
We hope it is profitable for you ❤️
Please support our activity with your likes👍 and comments📝
Buy Brinker InternationalShort Term Trading Advice by Naranj Capital
Buy Brinker International
● Buy Range- 151 - 156
● Target- 166 - 169
● StopLoss- 145
● Potential Return- 6-8%
● Duration- 14-15 Trading Days

GOLD ROUTE MAP UPDATEHey Everyone,
Another great day on the markets today with out plans to buy dips playing out perfectly. We had the gap left open at 2999 yesterday, which had the move down but just fell short of the full gap. We were able to use the dip to ride back up to our bullish target 3032 once again.
No further lock above 3032 confirmed the rejection again. We are looking for this level to break to confirm a continuation. Failure to break this level will keep seeing rejections into the lower Goldturns for the bounces. We also need to keep in mind the full gap at 2999, inline with our plans to buy dips.
We will keep the above in mind when taking buys from dips. Our updated levels and weighted levels will allow us to track the movement down and then catch bounces up.
We will continue to buy dips using our support levels taking 30 to 40 pips. As stated before each of our level structures give 20 to 40 pip bounces, which is enough for a nice entry and exit. If you back test the levels we shared every week for the past 24 months, you can see how effectively they were used to trade with or against short/mid term swings and trends.
BULLISH TARGET
3032 - DONE
EMA5 CROSS AND LOCK ABOVE 3032 WILL OPEN THE FOLLOWING BULLISH TARGET
3050
EMA5 CROSS AND LOCK ABOVE 3050 WILL OPEN THE FOLLOWING BULLISH TARGET
3065
EMA5 CROSS AND LOCK ABOVE 3065 WILL OPEN THE FOLLOWING BULLISH TARGET
3080
EMA5 CROSS AND LOCK ABOVE 3080 WILL OPEN THE FOLLOWING BULLISH TARGET
3097
BEARISH TARGETS
3015 - DONE
EMA5 CROSS AND LOCK BELOW 3015 WILL OPEN THE FOLLOWING BEARISH TARGET
2999
EMA5 CROSS AND LOCK BELOW 2999 WILL OPEN THE FOLLOWING BEARISH TARGET
2978
EMA5 CROSS AND LOCK BELOW 2978 WILL OPEN THE SWING RANGE
SWING RANGE
2950 - 2927
As always, we will keep you all updated with regular updates throughout the week and how we manage the active ideas and setups. Thank you all for your likes, comments and follows, we really appreciate it!
Mr Gold
GoldViewFX

GOLD ROUTE MAP UPDATEHey Everyone,
Great start to the week with our chart idea playing out as analysed.
We got our Bullish target hit at 3032 with no cross and lock above confirming the rejection after the hit. We also got our Bearish target hit at 3015 now also following with a cross and lock leaving 2999 Goldturn open.
We will keep the above in mind when taking buys from dips. Our updated levels and weighted levels will allow us to track the movement down and then catch bounces up.
We will continue to buy dips using our support levels taking 30 to 40 pips. As stated before each of our level structures give 20 to 40 pip bounces, which is enough for a nice entry and exit. If you back test the levels we shared every week for the past 24 months, you can see how effectively they were used to trade with or against short/mid term swings and trends.
BULLISH TARGET
3032 - DONE
EMA5 CROSS AND LOCK ABOVE 3032 WILL OPEN THE FOLLOWING BULLISH TARGET
3050
EMA5 CROSS AND LOCK ABOVE 3050 WILL OPEN THE FOLLOWING BULLISH TARGET
3065
EMA5 CROSS AND LOCK ABOVE 3065 WILL OPEN THE FOLLOWING BULLISH TARGET
3080
EMA5 CROSS AND LOCK ABOVE 3080 WILL OPEN THE FOLLOWING BULLISH TARGET
3097
BEARISH TARGETS
3015 - DONE
EMA5 CROSS AND LOCK BELOW 3015 WILL OPEN THE FOLLOWING BEARISH TARGET
2999
EMA5 CROSS AND LOCK BELOW 2999 WILL OPEN THE FOLLOWING BEARISH TARGET
2978
EMA5 CROSS AND LOCK BELOW 2978 WILL OPEN THE SWING RANGE
SWING RANGE
2950 - 2927
As always, we will keep you all updated with regular updates throughout the week and how we manage the active ideas and setups. Thank you all for your likes, comments and follows, we really appreciate it!
Mr Gold
GoldViewFX

GOLD 1H CHART ROUTE MAP & TRADING PLAN FOR THE WEEKHey Everyone,
Please see our updated 1h chart levels and targets for the coming week.
We are seeing price play between two weighted levels with a gap above at 3032 and a gap below at 3015. We will need to see ema5 cross and lock on either weighted level to determine the next range.
We will see levels tested side by side until one of the weighted levels break and lock to confirm direction for the next range.
We will keep the above in mind when taking buys from dips. Our updated levels and weighted levels will allow us to track the movement down and then catch bounces up.
We will continue to buy dips using our support levels taking 30 to 40 pips. As stated before each of our level structures give 20 to 40 pip bounces, which is enough for a nice entry and exit. If you back test the levels we shared every week for the past 24 months, you can see how effectively they were used to trade with or against short/mid term swings and trends.
BULLISH TARGET
3032
EMA5 CROSS AND LOCK ABOVE 3032 WILL OPEN THE FOLLOWING BULLISH TARGET
3050
EMA5 CROSS AND LOCK ABOVE 3050 WILL OPEN THE FOLLOWING BULLISH TARGET
3065
EMA5 CROSS AND LOCK ABOVE 3065 WILL OPEN THE FOLLOWING BULLISH TARGET
3080
EMA5 CROSS AND LOCK ABOVE 3080 WILL OPEN THE FOLLOWING BULLISH TARGET
3097
BEARISH TARGETS
3015
EMA5 CROSS AND LOCK BELOW 3015 WILL OPEN THE FOLLOWING BEARISH TARGET
2999
EMA5 CROSS AND LOCK BELOW 2999 WILL OPEN THE FOLLOWING BEARISH TARGET
2978
EMA5 CROSS AND LOCK BELOW 2978 WILL OPEN THE SWING RANGE
SWING RANGE
2950 - 2927
As always, we will keep you all updated with regular updates throughout the week and how we manage the active ideas and setups. Thank you all for your likes, comments and follows, we really appreciate it!
Mr Gold
GoldViewFX
GOLD 4H CHART ROUTE MAP & TRADING PLAN FOR THE WEEKHey Everyone,
Please see our updated 4h chart levels and targets for the coming week.
We are seeing price play between two weighted levels with a gap above at 3045 and a gap below at 3018. We will need to see ema5 cross and lock on either weighted level to determine the next range.
We will see levels tested side by side until one of the weighted levels break and lock to confirm direction for the next range.
We will keep the above in mind when taking buys from dips. Our updated levels and weighted levels will allow us to track the movement down and then catch bounces up.
We will continue to buy dips using our support levels taking 30 to 40 pips. As stated before each of our level structures give 20 to 40 pip bounces, which is enough for a nice entry and exit. If you back test the levels we shared every week for the past 24 months, you can see how effectively they were used to trade with or against short/mid term swings and trends.
BULLISH TARGET
3045
EMA5 CROSS AND LOCK ABOVE 3045 WILL OPEN THE FOLLOWING BULLISH TARGET
3067
EMA5 CROSS AND LOCK ABOVE 3067 WILL OPEN THE FOLLOWING BULLISH TARGET
3089
EMA5 CROSS AND LOCK ABOVE 3089 WILL OPEN THE FOLLOWING BULLISH TARGET
3114
BEARISH TARGETS
3018
EMA5 CROSS AND LOCK BELOW 3018 WILL OPEN THE FOLLOWING BEARISH TARGET
2985
EMA5 CROSS AND LOCK BELOW 2985 WILL OPEN THE SWING RANGE
SWING RANGE
2947 - 2918
As always, we will keep you all updated with regular updates throughout the week and how we manage the active ideas and setups. Thank you all for your likes, comments and follows, we really appreciate it!
Mr Gold
GoldViewFX

GOLD WEEKLY CHART MID/LONG TERM ROUTE MAPHey Everyone,
After tracking and completing our last weekly chart successfully we have now updated a new weekly chart idea to track our long term range and targets.
We are currently seeing a candle break above the channel half-line and will need ema5 to co=follow to confirm the break out for a continuation above.
However, we have a detachment to ema5 lagging also potentially due for a correction. The play range on the weekly chart is 2943 below and 3094 above. We will look for ema5 lock or body close above or below to confirm the next mid to long term range.
This is the beauty of our channels, which we draw in our unique way, using averages rather than price. This enables us to identify fake-outs and breakouts clearly, as minimal noise in the way our channels are drawn.
Thank you all for your likes, comments and follows, we really appreciate it!
Mr Gold
GoldViewFX

BTC Looking Bullish | Trade view for 22-23 March 20251D/1H/15 minutes all show a bullish pattern in the BTC.
After Applying Fibonacci we find a strong Golden zone for support with good volumes. BTC is expected to move higher.
Entry, SL and TP are mentioned in the trade view.
Note: Due to weekend the markets will be slow. Make sure to enter with small quantities.
Happy Weekend with the trades.

GOLD ROUTE MAP UPDATEHey Everyone,
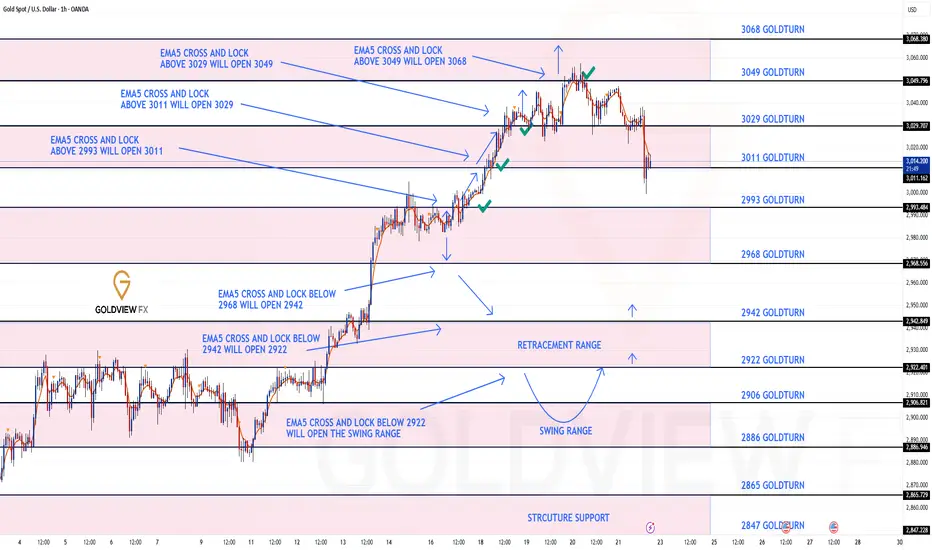
Great finish to the week with our chart ideas playing out, as analysed.
We completed our Bullish targets 2993, 3011, 3029 and 3049 all with cross and lock confirmations to give us plenty of time to get in for the action. No further lock above 3049 confirmed the rejection into the lower Goldlturns, which all gave the 30 to 40 pip bounces inline with our plans to buy dips, just like we always state.
BULLISH TARGET
2993 - DONE
EMA5 CROSS AND LOCK ABOVE 2993 WILL OPEN THE FOLLOWING BULLISH TARGET
3011 - DONE
EMA5 CROSS AND LOCK ABOVE 3011 WILL OPEN THE FOLLOWING BULLISH TARGET
3029 - DONE
EMA5 CROSS AND LOCK ABOVE 3029 WILL OPEN THE FOLLOWING BULLISH TARGET
3049 - DONE
We will now come back Sunday with our updated Multi time-frame analysis, Gold route map and trading plans for the week ahead and also a new Daily chart long term chart idea, now that this one is complete.
Have a smashing weekend!! And once again, thank you all for your likes, comments and follows, we really appreciate it!
Mr Gold
GoldViewFX
GOLD ROUTE MAP UPDATEHey Everyone,
Another Piptastic day on the charts with our analysis playing out perfectly.
After completing all our Bullish targets yesterday we confirmed the gap to 3049 remained open after cross and lock above 3029.
- This was hit perfectly today completing this target. No further cross and lock above 3049 confirmed the rejection into the lower Goldturn for the bounce just like we said!!
We will now see price play between both these Goldturns until we see a cross and lock on either level to confirm the next range.
We will keep the above in mind when taking buys from dips. Our updated levels and weighted levels will allow us to track the movement down and then catch bounces up.
We will continue to buy dips using our support levels taking 30 to 40 pips. As stated before each of our level structures give 20 to 40 pip bounces, which is enough for a nice entry and exit. If you back test the levels we shared every week for the past 24 months, you can see how effectively they were used to trade with or against short/mid term swings and trends.
BULLISH TARGET
2993 - DONE
EMA5 CROSS AND LOCK ABOVE 2993 WILL OPEN THE FOLLOWING BULLISH TARGET
3011 - DONE
EMA5 CROSS AND LOCK ABOVE 3011 WILL OPEN THE FOLLOWING BULLISH TARGET
3029 - DONE
EMA5 CROSS AND LOCK ABOVE 3029 WILL OPEN THE FOLLOWING BULLISH TARGET
3049 - DONE
EMA5 CROSS AND LOCK ABOVE 3049 WILL OPEN THE FOLLOWING BULLISH TARGET
3068
BEARISH TARGETS
2968
EMA5 CROSS AND LOCK BELOW 2968 WILL OPEN THE FOLLOWING BEARISH TARGET
2942
EMA5 CROSS AND LOCK BELOW 2942 WILL OPEN THE FOLLOWING BEARISH TARGET
2922
EMA5 CROSS AND LOCK BELOW 2922 WILL OPEN THE SWING RANGE
SWING RANGE
2906 - 2886
As always, we will keep you all updated with regular updates throughout the week and how we manage the active ideas and setups. Thank you all for your likes, comments and follows, we really appreciate it!
Mr Gold
GoldViewFX

GOLD ROUTE MAP UPDATEHey Everyone,
Once again our chart levels are being respected and playing out, as analysed in true level to level fashion.
After completing all our Bullish targets 2993, 3011 and 3029, all confirmed with cross and lock, we then confirmed a lock above 3029 opening 3049 yesterday. We got the nice move up but just short of the full gap, which then followed with a rejection into the lower Goldturn for the bounce, giving us plenty of opportunities to milk the bounces just like we stated.
We still have the gap remaining open and we are seeing price play between two weighted levels. We will now look for either level to be tested and broken with cross and lock to confirm the next range.
We will keep the above in mind when taking buys from dips. Our updated levels and weighted levels will allow us to track the movement down and then catch bounces up.
We will continue to buy dips using our support levels taking 30 to 40 pips. As stated before each of our level structures give 20 to 40 pip bounces, which is enough for a nice entry and exit. If you back test the levels we shared every week for the past 24 months, you can see how effectively they were used to trade with or against short/mid term swings and trends.
BULLISH TARGET
2993 - DONE
EMA5 CROSS AND LOCK ABOVE 2993 WILL OPEN THE FOLLOWING BULLISH TARGET
3011 - DONE
EMA5 CROSS AND LOCK ABOVE 3011 WILL OPEN THE FOLLOWING BULLISH TARGET
3029 - DONE
EMA5 CROSS AND LOCK ABOVE 3029 WILL OPEN THE FOLLOWING BULLISH TARGET
3049
EMA5 CROSS AND LOCK ABOVE 3049 WILL OPEN THE FOLLOWING BULLISH TARGET
3068
BEARISH TARGETS
2968
EMA5 CROSS AND LOCK BELOW 2968 WILL OPEN THE FOLLOWING BEARISH TARGET
2942
EMA5 CROSS AND LOCK BELOW 2942 WILL OPEN THE FOLLOWING BEARISH TARGET
2922
EMA5 CROSS AND LOCK BELOW 2922 WILL OPEN THE SWING RANGE
SWING RANGE
2906 - 2886
As always, we will keep you all updated with regular updates throughout the week and how we manage the active ideas and setups. Thank you all for your likes, comments and follows, we really appreciate it!
Mr Gold
GoldViewFX

GOLD ROUTE MAP UPDATEHey Everyone,
Another great day on the charts once again with our analysis playing out to perfection!!
After completing our 2993 Bullish target yesterday, we stated that we now have a ema5 lock above 2993 opening 3011. This target was hit today just like we said, followed with a further cross and lock above 3011 opening 3029, which was also hit today completing this range.
We now have a lock above 3029 opening 3049. We now need to keep in mind we have had no corrections from the last two days momentum. Failure to lock above the next level will follow with a rejection to find support at the lower Goldturns for bounce and then further cross and locks will confirm the next range for us.
We will keep the above in mind when taking buys from dips. Our updated levels and weighted levels will allow us to track the movement down and then catch bounces up.
We will continue to buy dips using our support levels taking 30 to 40 pips. As stated before each of our level structures give 20 to 40 pip bounces, which is enough for a nice entry and exit. If you back test the levels we shared every week for the past 24 months, you can see how effectively they were used to trade with or against short/mid term swings and trends.
BULLISH TARGET
2993 - DONE
EMA5 CROSS AND LOCK ABOVE 2993 WILL OPEN THE FOLLOWING BULLISH TARGET
3011 - DONE
EMA5 CROSS AND LOCK ABOVE 3011 WILL OPEN THE FOLLOWING BULLISH TARGET
3029 - DONE
EMA5 CROSS AND LOCK ABOVE 3029 WILL OPEN THE FOLLOWING BULLISH TARGET
3049
EMA5 CROSS AND LOCK ABOVE 3049 WILL OPEN THE FOLLOWING BULLISH TARGET
3068
BEARISH TARGETS
2968
EMA5 CROSS AND LOCK BELOW 2968 WILL OPEN THE FOLLOWING BEARISH TARGET
2942
EMA5 CROSS AND LOCK BELOW 2942 WILL OPEN THE FOLLOWING BEARISH TARGET
2922
EMA5 CROSS AND LOCK BELOW 2922 WILL OPEN THE SWING RANGE
SWING RANGE
2906 - 2886
As always, we will keep you all updated with regular updates throughout the week and how we manage the active ideas and setups. Thank you all for your likes, comments and follows, we really appreciate it!
Mr Gold
GoldViewFX

GOLD ROUTE MAP UPDATEHey Everyone,
Great start top the week with our chart idea already kicked off with our first Bullish target hit at 2993. We are now seeing a lock above 2993 opening 3011. Failure to lock above will follow with a rejection to find support at the lower Goldturns for bounce and then further cross and locks will confirm the next range for us.
We will keep the above in mind when taking buys from dips. Our updated levels and weighted levels will allow us to track the movement down and then catch bounces up.
We will continue to buy dips using our support levels taking 30 to 40 pips. As stated before each of our level structures give 20 to 40 pip bounces, which is enough for a nice entry and exit. If you back test the levels we shared every week for the past 24 months, you can see how effectively they were used to trade with or against short/mid term swings and trends.
BULLISH TARGET
2993 - DONE
EMA5 CROSS AND LOCK ABOVE 2993 WILL OPEN THE FOLLOWING BULLISH TARGET
3011
EMA5 CROSS AND LOCK ABOVE 3011 WILL OPEN THE FOLLOWING BULLISH TARGET
3039
EMA5 CROSS AND LOCK ABOVE 3039 WILL OPEN THE FOLLOWING BULLISH TARGET
3049
EMA5 CROSS AND LOCK ABOVE 3049 WILL OPEN THE FOLLOWING BULLISH TARGET
3068
BEARISH TARGETS
2968
EMA5 CROSS AND LOCK BELOW 2968 WILL OPEN THE FOLLOWING BEARISH TARGET
2942
EMA5 CROSS AND LOCK BELOW 2942 WILL OPEN THE FOLLOWING BEARISH TARGET
2922
EMA5 CROSS AND LOCK BELOW 2922 WILL OPEN THE SWING RANGE
SWING RANGE
2906 - 2886
As always, we will keep you all updated with regular updates throughout the week and how we manage the active ideas and setups. Thank you all for your likes, comments and follows, we really appreciate it!
Mr Gold
GoldViewFX

GOLD 1H CHART ROUTE MAP & TRADING PLAN FOR THE WEEKHey Everyone,
Please see our updated 1h chart levels and targets for the coming week.
We are seeing price play between two weighted levels with a gap above at 2993 and a gap below at 2968. We will need to see ema5 cross and lock on either weighted level to determine the next range.
We will see levels tested side by side until one of the weighted levels break and lock to confirm direction for the next range.
We will keep the above in mind when taking buys from dips. Our updated levels and weighted levels will allow us to track the movement down and then catch bounces up.
We will continue to buy dips using our support levels taking 30 to 40 pips. As stated before each of our level structures give 20 to 40 pip bounces, which is enough for a nice entry and exit. If you back test the levels we shared every week for the past 24 months, you can see how effectively they were used to trade with or against short/mid term swings and trends.
BULLISH TARGET
2993
EMA5 CROSS AND LOCK ABOVE 2993 WILL OPEN THE FOLLOWING BULLISH TARGET
3011
EMA5 CROSS AND LOCK ABOVE 3011 WILL OPEN THE FOLLOWING BULLISH TARGET
3039
EMA5 CROSS AND LOCK ABOVE 3039 WILL OPEN THE FOLLOWING BULLISH TARGET
3049
EMA5 CROSS AND LOCK ABOVE 3049 WILL OPEN THE FOLLOWING BULLISH TARGET
3068
BEARISH TARGETS
2968
EMA5 CROSS AND LOCK BELOW 2968 WILL OPEN THE FOLLOWING BEARISH TARGET
2942
EMA5 CROSS AND LOCK BELOW 2942 WILL OPEN THE FOLLOWING BEARISH TARGET
2922
EMA5 CROSS AND LOCK BELOW 2922 WILL OPEN THE SWING RANGE
SWING RANGE
2906 - 2886
As always, we will keep you all updated with regular updates throughout the week and how we manage the active ideas and setups. Thank you all for your likes, comments and follows, we really appreciate it!
Mr Gold
GoldViewFX

GOLD 4H CHART ROUTE MAP & TRADING PLAN FOR THE WEEKHey Everyone,
Please see our updated 4h chart levels and targets for the coming week.
We are seeing price play between two weighted levels with a gap above at 3005 and a gap below at 2972. We will need to see ema5 cross and lock on either weighted level to determine the next range.
We will see levels tested side by side until one of the weighted levels break and lock to confirm direction for the next range.
We will keep the above in mind when taking buys from dips. Our updated levels and weighted levels will allow us to track the movement down and then catch bounces up.
We will continue to buy dips using our support levels taking 30 to 40 pips. As stated before each of our level structures give 20 to 40 pip bounces, which is enough for a nice entry and exit. If you back test the levels we shared every week for the past 24 months, you can see how effectively they were used to trade with or against short/mid term swings and trends.
BULLISH TARGET
3005
EMA5 CROSS AND LOCK ABOVE 3005 WILL OPEN THE FOLLOWING BULLISH TARGET
3033
EMA5 CROSS AND LOCK ABOVE 3033 WILL OPEN THE FOLLOWING BULLISH TARGET
3059
EMA5 CROSS AND LOCK ABOVE 3059 WILL OPEN THE FOLLOWING BULLISH TARGET
3090
EMA5 CROSS AND LOCK ABOVE 3090 WILL OPEN THE FOLLOWING BULLISH TARGET
3117
BEARISH TARGETS
2972
EMA5 CROSS AND LOCK BELOW 2972 WILL OPEN THE FOLLOWING BEARISH TARGET
2947
EMA5 CROSS AND LOCK BELOW 2947 WILL OPEN THE FOLLOWING BEARISH TARGET
2918
EMA5 CROSS AND LOCK BELOW 2918 WILL OPEN THE SWING RANGE
SWING RANGE
2889 - 2857
As always, we will keep you all updated with regular updates throughout the week and how we manage the active ideas and setups. Thank you all for your likes, comments and follows, we really appreciate it!
Mr Gold
GoldViewFX

GOLD DAILY CHART MID/LONG TERM UPDATEHey Everyone,
This is an update on our daily chart idea that we are now tracking for a while now. If you have only started following us, please read the updates below from previous weeks.
Last week we stated that we had a candle body close above 2904 opening 2959 with ema5 lock to further confirm this. This played out perfectly completing this target and also perfectly inline with the channel top. We will now expect some resistance here on the channel top to then provide support on the lower levels and slowly ascend up the channel over a longer term. However, if we see ema5 lock outside the channel then we will look for support outside the channel on the channel top for a continuation.
This is the beauty of our Goldturn channels, which we draw in our unique way, using averages rather than price. This enables us to identify fake-outs and breakouts clearly, as minimal noise in the way our channels are drawn.
We will use our smaller timeframe analysis on the 1H and 4H chart to buy dips from the weighted Goldturns for 30 to 40 pips clean. Ranging markets are perfectly suited for this type of trading, instead of trying to hold longer positions and getting chopped up in the swings up and down in the range.
We will keep the above in mind when taking buys from dips. Our updated levels and weighted levels will allow us to track the movement down and then catch bounces up using our smaller timeframe ideas.
Our long term bias is Bullish and therefore we look forward to drops from rejections, which allows us to continue to use our smaller timeframes to buy dips using our levels and setups.
Buying dips allows us to safely manage any swings rather then chasing the bull from the top.
Thank you all for your likes, comments and follows, we really appreciate it!
Mr Gold
GoldViewFX
LAST WEEK UPDATE
The half line of our unique channel gave the perfect bounce into the next axis target at 2904, inline with our plans to buy dips just like we stated. We now have a body close once again with ema5 cross and lock above 2904 leaving the range above open. We will continue to look for support at the ascending half-line of the channel, as we climb into the range.
PREVIOUS WEEKS UPDATE
After completing our Bullish targets we stated that the channel top will act as resistance confirmed with ema5 rejection. A break of the channel top with ema5 would confirm a continuation and failure would confirm rejection. This allowed us to identify true breakouts against fake outs.
We also stated that we need to keep in mind the channel half line below to establish floor to provide support for the range, should we continue to track further up. A break below the half line will open the lower part of the channel to establish floor on the channel bottom. The safest way to track this movement is by buying dips.
- Once again this played out perfectly as we got the rejection on the channel top followed with the channel half line test, which gave the perfect bounce like we stated. We will now either look for a continuation from this bounce or a cross and lock below the half line for a break into the lower channel floor.

GOLD WEEKLY CHART MID/LONG TERM ROUTE MAPHey Everyone,
Please see update on the weekly chart idea that we have been tracking for over a while now and now fully complete.
After completing 2856 target, we were left with candle body close above 2856 leaving a gap to 2976 but needed ema5 lock to further confirm this. We then had the ema5 lock last week to further confirm the long range gap above. This gap was completed last week completing this chart idea and with plenty of time for us to get in for the action, just perfect!!!
This is the beauty of our channels, which we draw in our unique way, using averages rather than price. This enables us to identify fake-outs and breakouts clearly, as minimal noise in the way our channels are drawn.
We will now update a new weekly chart idea for our long term analysis, targets and gaps next week. Please keep an eye out for it.
Thank you all for your likes, comments and follows, we really appreciate it!
Mr Gold
GoldViewFX

#REDUSDT continues its downtrend📉 Short BYBIT:REDUSDT.P from $0,7814
🛡 Stop loss $0,8061
🕒 1H Timeframe
⚡️ Overview:
➡️ The main POC (Point of Control) is 0,5802
🎯 TP Targets:
💎 TP 1: $0,7600
💎 TP 2: $0,7330
💎 TP 3: $0,7112
📢 Monitor key levels before entering the trade!
BYBIT:REDUSDT.P continues its downtrend — watching for further movement!

XAU/USD Bullish Outlook: Wyckoff Accumulation & Breakout PotentXAU/USD (Gold) - 2H Chart Analysis 🏆📈
🔹 Wyckoff Structure Insight
The chart shows signs of a Wyckoff Accumulation phase.
UTAD (Upthrust After Distribution) at the previous highs suggests a liquidity grab.
Test of the resistance level before a strong rejection downward.
SOW (Sign of Weakness) was observed, but buyers regained control.
🔹 Key Technical Levels
Fair Value Range marked below, showing a potential area of demand.
Unfilled Imbalance (EMB unfilled) signals an area where price might revisit before continuing upward.
Gap below indicates a previous liquidity sweep before the bullish reversal.
🔹 Trend & Price Action
The 200 EMA (red line) is holding as dynamic support.
Current price action is showing higher lows and bullish structure development.
Projected bullish move 📈 is expected to test the $2,940+ region.
🔹 Trading Bias: Bullish ✅
A retracement to the EMA or minor pullback could offer re-entry opportunities.
Invalidation level: Below $2,900, where momentum could shift bearish.
🚀 Gold remains strong; watch for breakouts above $2,940!

GOLD ROUTE MAP UPDATEHey Everyone,
What a PIPTASTIC finish to the week with our chart idea now complete with our final target at 3005 now done.
We started the week with our 2918 Bullish target hit, followed with cross and lock in each stage of the range, completing 2947 and 2978 and now today confirmed a further lock opening 3005, which was hit and completed perfectly!!
The power of our algo levels, even at a new range is being respected to perfection!!
BULLISH TARGET
2918 - DONE
EMA5 CROSS AND LOCK ABOVE 2918 WILL OPEN THE FOLLOWING BULLISH TARGET
2947 - DONE
EMA5 CROSS AND LOCK ABOVE 2947 WILL OPEN THE FOLLOWING BULLISH TARGET
2978 - DONE
BEARISH TARGETS
2889 - DONE
We will now come back Sunday with our updated Multi time-frame analysis, Gold route map and trading plans for the week ahead and also a new Daily chart long term chart idea, now that this one is complete.
Have a smashing weekend!! And once again, thank you all for your likes, comments and follows, we really appreciate it!
Mr Gold
GoldViewFX

NVDA Short Term BuyPrice is currently consolidating within a tight range, and a breakout appears imminent. I am looking for a clean break above resistance, followed by a retest of the breakout level, which could provide a strong buy opportunity. If this setup plays out, the next key target would be the $135 level.
However, this move is likely to be a short-term retracement within a larger downtrend. If price struggles to sustain momentum above $135 and shows signs of weakness, it could indicate a continuation of the broader bearish trend. Confirmation will come from price action signals and volume dynamics on the retest.

GOLD 1H AND 4H CHART ROUTE MAP UDATEHey Everyone,
Once again a smashing day on the markets with both our 1h and 4h charts, playing out as analysed.
We got our Bullish targets 2922, 2947 and 2968 all completed on our 1h chart, confirmed with cross and lock, giving us enough time from confirmation to target being hit.
Please see our 4h chart below, also completing our target at 2947, which we confirmed was open yesterday, giving enough time for the target to be hit today and now also finished off with 2978. We will now look for a test and lock for a further continuation or failure to lock above will see a rejection to find support at the lower Goldturns for support and bounce.
We will keep the above in mind when taking buys from dips. Our updated levels and weighted levels will allow us to track the movement down and then catch bounces up.
We will continue to buy dips using our support levels taking 30 to 40 pips. As stated before each of our level structures give 20 to 40 pip bounces, which is enough for a nice entry and exit. If you back test the levels we shared every week for the past 24 months, you can see how effectively they were used to trade with or against short/mid term swings and trends.
BULLISH TARGET
2922 - DONE
EMA5 CROSS AND LOCK ABOVE 2922 WILL OPEN THE FOLLOWING BULLISH TARGET
2947 - DONE
EMA5 CROSS AND LOCK ABOVE 2947 WILL OPEN THE FOLLOWING BULLISH TARGET
2968 DONE
As always, we will keep you all updated with regular updates throughout the week and how we manage the active ideas and setups. Thank you all for your likes, comments and follows, we really appreciate it!
Mr Gold
GoldViewFX
