CADCHF; Heikin Ashi Trade IdeaOANDA:CADCHF
In this video, I’ll be sharing my analysis of CADCHF, using my unique Heikin Ashi strategy. I’ll walk you through the reasoning behind my trade setup and highlight key areas where I’m anticipating potential opportunities.
I’m always happy to receive any feedback.
Like, share and comment! ❤️
Thank you for watching my videos! 🙏
Tradingideas

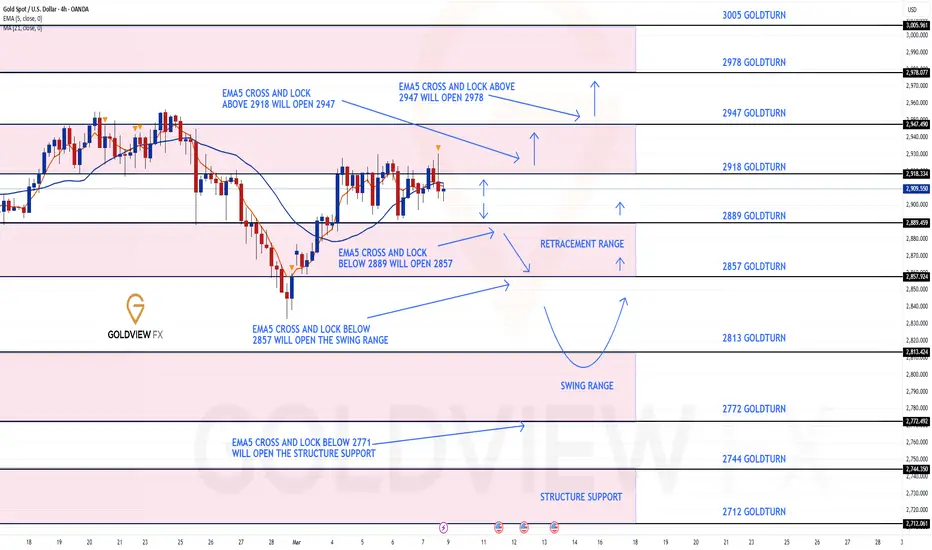
GOLD 4H CHART ROUTE MAP UPDATEHey Everyone,
Another great day on the markets today once again. Yesterday we updated our 1H CHART IDEA and today we update our 4H CHART IDEA.
Great start with our Bullish target hit at 2889 earlier this week followed with no cross and lock confirming the rejection and support for the bounce into 2918 completing our Bullish target. We now have a lock above 2918 opening 2947. We will look for a test and lock for a further continuation or failure to lock above will see a rejection to find support at the lower Goldturns for support and bounce.
We will see levels tested side by side until one of the weighted levels break and lock to confirm direction for the next range.
We will keep the above in mind when taking buys from dips. Our updated levels and weighted levels will allow us to track the movement down and then catch bounces up.
We will continue to buy dips using our support levels taking 30 to 40 pips. As stated before each of our level structures give 20 to 40 pip bounces, which is enough for a nice entry and exit. If you back test the levels we shared every week for the past 24 months, you can see how effectively they were used to trade with or against short/mid term swings and trends.
BULLISH TARGET
2918 - DONE
EMA5 CROSS AND LOCK ABOVE 2918 WILL OPEN THE FOLLOWING BULLISH TARGET
2947
EMA5 CROSS AND LOCK ABOVE 2947 WILL OPEN THE FOLLOWING BULLISH TARGET
2978
BEARISH TARGETS
2889 - DONE
EMA5 CROSS AND LOCK BELOW 2889 WILL OPEN THE FOLLOWING BEARISH TARGET
2857
EMA5 CROSS AND LOCK BELOW 2857 WILL OPEN THE SWING RANGE
SWING RANGE
2813 - 2772
As always, we will keep you all updated with regular updates throughout the week and how we manage the active ideas and setups. Thank you all for your likes, comments and follows, we really appreciate it!
Mr Gold
GoldViewFX

Gold Short Couple of View Points technically
Weekly - After a successful 8 weeks of positive return, Gold last week came down from the top and broke its previous weeks low level and went down by 2.66% which signifies there is selling seen on the top side. Apart form that whenever gold corrects prom the top it comes down to 10 WEMA which is 3% down or 20 WEMA which is 5% down.
Daily - If you look at the support line which has been drown from the top gold has been seen falling from the levels and if you also look at the candles which also there has been indecision in the market.
2 Hours - If you look at last couple of days for gold in 2 hours time frame whenever prices go up there is a massive red candle bringing price back down.
So as per me gold prices should fall down.
Current Market Price : 2905 USD
Stop Loss : 2935 USD
Target 1 : 2830 (Risk Reward : 1:2.5)
Target 2 : 2780 (Risk Reward : 1:4)

S&P 500 E-mini Futures | 15M | SCALPING TIME | BUYHey There My Friend ; 🫡
SIGNAL ALERT
BUY S&P 500 / 5,586,00 - 5,567,25
🟢TP1: 5,605,50
🟢TP2: 5,646,25
🟢TP3: 5,723,75
🔴SL: 5,514,50
RISK REWARD - 3,00
Thanks to everyone who supports my analysis with likes.💙💙💙

US30 | 15M | SCALPING TIME | BUYHey There My Friend ; 🫡
SIGNAL ALERT
BUY US30 / 41,355,94 > 41,456,00
🟢TP1: 41,612,00
🟢TP2: 41,839,99
🟢TP3: 42,654,00
🔴SL: 41,029,00
RISK REWARD - 4,00
Thanks to everyone who supports my analysis with likes.💙💙💙

GOLD ROUTE MAP UPDATEHey Everyone,
PIPTASTIC day on the markets today with our chart idea playing out as analysed. Yesterday we had the break below 2901 bearish target, opening the first level of the retracement range at 2878, which just fell short by a few pips. This then provided the support for the bounce all the way into 2922 completing our Bullish target. We were able to take the ride up all the way from the retracement range, inline with our plans to buy dips
We are now looking for a lock above 2922 for a continuation or failure to lock will see price reject into the lower Goldturns for support and bounce, also keeping in mind the small gap left on the retracement range
We will keep the above in mind when taking buys from dips. Our updated levels and weighted levels will allow us to track the movement down and then catch bounces up.
We will continue to buy dips using our support levels taking 30 to 40 pips. As stated before each of our level structures give 20 to 40 pip bounces, which is enough for a nice entry and exit. If you back test the levels we shared every week for the past 24 months, you can see how effectively they were used to trade with or against short/mid term swings and trends.
BULLISH TARGET
2922 - DONE
EMA5 CROSS AND LOCK ABOVE 2922 WILL OPEN THE FOLLOWING BULLISH TARGET
2947
EMA5 CROSS AND LOCK ABOVE 2947 WILL OPEN THE FOLLOWING BULLISH TARGET
2968
BEARISH TARGETS
2901 - DONE
EMA5 CROSS AND LOCK BELOW 2901 WILL OPEN THE FOLLOWING RETRACEMENT RANGE
2878 - 2851
EMA5 CROSS AND LOCK BELOW 2851 WILL OPEN THE SWING RANGE
SWING RANGE
2820 - 2796
As always, we will keep you all updated with regular updates throughout the week and how we manage the active ideas and setups. Thank you all for your likes, comments and follows, we really appreciate it!
Mr Gold
GoldViewFX

Heikin Ashi Trade IdeaCOINBASE:BTCUSD
In this video, I’ll be sharing my analysis of BTCUSD, using my unique Heikin Ashi strategy. I’ll walk you through the reasoning behind my trade setup and highlight key areas where I’m anticipating potential opportunities.
I’m always happy to receive any feedback.
Like, share and comment! ❤️
Thank you for watching my videos! 🙏

GOLD ROUTE MAP UPDATEHey Everyone,
We started the week with our Bearish target hit first at 2901, which gave multiple weighted level bounces of 30 pips plus. We were able to capitalise on these bounces, inline with our plans to buy dips.
We are now seeing price breakout of the 2901 Goldturn level and ema5 is about to lock. We will wait to confirm a lock for the continuation into the retracement level for further weighted level bounces. Failure to lock below 2901 will see a re-test back into the upper Goldturn.
We will see levels tested side by side until one of the weighted levels break and lock to confirm direction for the next range.
We will keep the above in mind when taking buys from dips. Our updated levels and weighted levels will allow us to track the movement down and then catch bounces up.
We will continue to buy dips using our support levels taking 30 to 40 pips. As stated before each of our level structures give 20 to 40 pip bounces, which is enough for a nice entry and exit. If you back test the levels we shared every week for the past 24 months, you can see how effectively they were used to trade with or against short/mid term swings and trends.
BULLISH TARGET
2922
EMA5 CROSS AND LOCK ABOVE 2922 WILL OPEN THE FOLLOWING BULLISH TARGET
2947
EMA5 CROSS AND LOCK ABOVE 2947 WILL OPEN THE FOLLOWING BULLISH TARGET
2968
BEARISH TARGETS
2901 - DONE
EMA5 CROSS AND LOCK BELOW 2901 WILL OPEN THE FOLLOWING RETRACEMENT RANGE
2878 - 2851
EMA5 CROSS AND LOCK BELOW 2851 WILL OPEN THE SWING RANGE
SWING RANGE
2820 - 2796
As always, we will keep you all updated with regular updates throughout the week and how we manage the active ideas and setups. Thank you all for your likes, comments and follows, we really appreciate it!
Mr Gold
GoldViewFX

GOLD 1H CHART ROUTE MAP & TRADING PLAN FOR THE WEEKHey Everyone,
Please see our updated 1h chart levels and targets for the coming week.
We are seeing price play between two weighted levels with a gap above at 2922 and a gap below at 2901. We will need to see ema5 cross and lock on either weighted level to determine the next range.
We will see levels tested side by side until one of the weighted levels break and lock to confirm direction for the next range.
We will keep the above in mind when taking buys from dips. Our updated levels and weighted levels will allow us to track the movement down and then catch bounces up.
We will continue to buy dips using our support levels taking 30 to 40 pips. As stated before each of our level structures give 20 to 40 pip bounces, which is enough for a nice entry and exit. If you back test the levels we shared every week for the past 24 months, you can see how effectively they were used to trade with or against short/mid term swings and trends.
BULLISH TARGET
2922
EMA5 CROSS AND LOCK ABOVE 2922 WILL OPEN THE FOLLOWING BULLISH TARGET
2947
EMA5 CROSS AND LOCK ABOVE 2947 WILL OPEN THE FOLLOWING BULLISH TARGET
2968
BEARISH TARGETS
2901
EMA5 CROSS AND LOCK BELOW 2901 WILL OPEN THE FOLLOWING RETRACEMENT RANGE
2878 - 2851
EMA5 CROSS AND LOCK BELOW 2851 WILL OPEN THE SWING RANGE
SWING RANGE
2820 - 2796
As always, we will keep you all updated with regular updates throughout the week and how we manage the active ideas and setups. Thank you all for your likes, comments and follows, we really appreciate it!
Mr Gold
GoldViewFX

GOLD 4H CHART ROUTE MAP & TRADING PLAN FOR THE WEEKHey Everyone,
Please see our updated 4h chart levels and targets for the coming week.
We are seeing price play between two weighted levels with a gap above at 2918 and a gap below at 2889. We will need to see ema5 cross and lock on either weighted level to determine the next range.
We will see levels tested side by side until one of the weighted levels break and lock to confirm direction for the next range.
We will keep the above in mind when taking buys from dips. Our updated levels and weighted levels will allow us to track the movement down and then catch bounces up.
We will continue to buy dips using our support levels taking 30 to 40 pips. As stated before each of our level structures give 20 to 40 pip bounces, which is enough for a nice entry and exit. If you back test the levels we shared every week for the past 24 months, you can see how effectively they were used to trade with or against short/mid term swings and trends.
BULLISH TARGET
2918
EMA5 CROSS AND LOCK ABOVE 2918 WILL OPEN THE FOLLOWING BULLISH TARGET
2947
EMA5 CROSS AND LOCK ABOVE 2947 WILL OPEN THE FOLLOWING BULLISH TARGET
2978
BEARISH TARGETS
2889
EMA5 CROSS AND LOCK BELOW 2889 WILL OPEN THE FOLLOWING BEARISH TARGET
2857
EMA5 CROSS AND LOCK BELOW 2857 WILL OPEN THE SWING RANGE
SWING RANGE
2813 - 2772
As always, we will keep you all updated with regular updates throughout the week and how we manage the active ideas and setups. Thank you all for your likes, comments and follows, we really appreciate it!
Mr Gold
GoldViewFX
GOLD DAILY CHART MID/LONG TERM UPDATEHey Everyone,
This is an update on our daily chart idea that we are now tracking for a while now. If you have only started following us, please read the updates below from last week.
The half line of our unique channel gave the perfect bounce into the next axis target at 2904, inline with our plans to buy dips just like we stated. We now have a body close once again with ema5 cross and lock above 2904 leaving the range above open. We will continue to look for support at the ascending half-line of the channel, as we climb into the range.
This is the beauty of our Goldturn channels, which we draw in our unique way, using averages rather than price. This enables us to identify fake-outs and breakouts clearly, as minimal noise in the way our channels are drawn.
We will use our smaller timeframe analysis on the 1H and 4H chart to buy dips from the weighted Goldturns for 30 to 40 pips clean. Ranging markets are perfectly suited for this type of trading, instead of trying to hold longer positions and getting chopped up in the swings up and down in the range.
We will keep the above in mind when taking buys from dips. Our updated levels and weighted levels will allow us to track the movement down and then catch bounces up using our smaller timeframe ideas.
Our long term bias is Bullish and therefore we look forward to drops like this from rejections, which allows us to continue to use our smaller timeframes to buy dips using our levels and setups.
Buying dips allows us to safely manage any swings rather then chasing the bull from the top.
Thank you all for your likes, comments and follows, we really appreciate it!
Mr Gold
GoldViewFX
LAST WEEKS UPDATE
After completing our Bullish targets we stated that the channel top will act as resistance confirmed with ema5 rejection. A break of the channel top with ema5 would confirm a continuation and failure would confirm rejection. This allowed us to identify true breakouts against fake outs.
We also stated that we need to keep in mind the channel half line below to establish floor to provide support for the range, should we continue to track further up. A break below the half line will open the lower part of the channel to establish floor on the channel bottom. The safest way to track this movement is by buying dips.
- Once again this played out perfectly as we got the rejection on the channel top followed with the channel half line test, which gave the perfect bounce like we stated. We will now either look for a continuation from this bounce or a cross and lock below the half line for a break into the lower channel floor.

GOLD WEEKLY CHART MID/LONG TERM ROUTE MAPHey Everyone,
Please see update on the weekly chart idea we have been tracking for over a month now and still playing out, as analysed.
Previously we stated that after completing 2856 target, we were left with body close above 2856 leaving a gap to 2976 but needed ema5 lock to further confirm this although we already took over 700 pips on the run, as its a big gap to chase in one go.
- We now have the ema5 lock to further confirm the long range gap above. If we see any rejections here due to volatility and news, then we would continue to look for the channel top for support for an ascending movement up, slowly over a longer term into our long range gap. Once again we prove the safest way to chase this Bull in this range is from dips.
This is the beauty of our channels, which we draw in our unique way, using averages rather than price. This enables us to identify fake-outs and breakouts clearly, as minimal noise in the way our channels are drawn.
Thank you all for your likes, comments and follows, we really appreciate it!
Mr Gold
GoldViewFX

GOLD ROUTE MAP UPDATEHey Everyone,
PIPTASTIC finish to the week!!!!
After updating our 1H chart all week with perfect weighted level bounces, clearing our Bullish targets from every dip, we now finish up with our 4H chart update.
We got our 2889 target start of the week, followed with EMA5 cross and lock opening 2914, which was also hit perfectly. We then got our ema5 lock above 2914, opening the range above. We were able to ride this all the way into 2930 with more room left for the full gap. However, end of week now, so we will update our charts for Sunday for the week ahead.
BULLISH TARGET
2889 - DONE
EMA5 CROSS AND LOCK ABOVE 2889 WILL OPEN THE FOLLOWING BULLISH TARGET
2914 - DONE
We will now come back Sunday with our updated Multi time-frame analysis, Gold route map and trading plans for the week ahead and also a new Daily chart long term chart idea, now that this one is complete.
Have a smashing weekend!! And once again, thank you all for your likes, comments and follows, we really appreciate it!
Mr Gold
GoldViewFX

GOLD ROUTE MAP UPDATEHey Everyone,
We sound like a broken record but once again a great day on the markets with our chart idea playing out, as analysed.
We had a repeat of yesterday with no lock above 2921 once again, which followed with the rejection into the lower Goldturn for the support test and bounce back into 2921, perfectly inline with our plans to buy dips. We are safely buying dips in this range, while price is bouncing between both the weighted Goldlturns. Once again we will now wait for ema5 to lock for a continuation or a rejection back into lower Goldturns.
We will keep the above in mind when taking buys from dips. Our updated levels and weighted levels will allow us to track the movement down and then catch bounces up.
We will continue to buy dips using our support levels taking 30 to 40 pips. As stated before each of our level structures give 20 to 40 pip bounces, which is enough for a nice entry and exit. If you back test the levels we shared every week for the past 24 months, you can see how effectively they were used to trade with or against short/mid term swings and trends.
BULLISH TARGET
2872 - DONE
EMA5 CROSS AND LOCK ABOVE 2872 WILL OPEN THE FOLLOWING BULLISH TARGET
2901 - DONE
EMA5 CROSS AND LOCK ABOVE 2901 WILL OPEN THE FOLLOWING BULLISH TARGET
2921 - DONE
EMA5 CROSS AND LOCK ABOVE 2921 WILL OPEN THE FOLLOWING BULLISH TARGET
2950
BEARISH TARGETS
2846
EMA5 CROSS AND LOCK BELOW 2846 WILL OPEN THE FOLLOWING BEARISH TARGET
2820
EMA5 CROSS AND LOCK BELOW 2820 WILL OPEN THE FOLLOWING BEARISH TARGET
2796
EMA5 CROSS AND LOCK BELOW 2796 WILL OPEN THE SWING RANGE
SWING RANGE
2778 - 2753
As always, we will keep you all updated with regular updates throughout the week and how we manage the active ideas and setups. Thank you all for your likes, comments and follows, we really appreciate it!
Mr Gold
GoldViewFX

GBP/JPY Potential Bullish Breakout – Key Levels to Watch:
📉 Descending Trendline Breakout Setup
The price has been in a downtrend, following a descending trendline.
It is currently testing this trendline with signs of potential breakout.
📊 Key Support & Resistance Zones
Support Zone (~187.5 - 189.0): Price has bounced multiple times from this area.
Resistance Zones (~192.5 & ~200.0): First target is around 192.5, then 200.0 if momentum continues.
📈 Possible Bullish Scenario
If price breaks the trendline and holds above 192.5, we could see an upward push towards 200.0.
The expected move follows the drawn path: breakout → retest → continuation.
⚠️ Risk Factors
If the price fails to break above 192.5, it might return to the support zone.
A break below 187.5 would invalidate the bullish outlook.
Overall, this setup suggests watching for a breakout confirmation above resistance before entering long trades. 🚀

USDJPY | 1H | BUYSIGNAL ALERT
BUY USDJPY / 148,901 OR 149,00
🟢TP1: 149,265
🟢TP2: 149,776
🟢TP3: 151,000
🔴SL: 147,966
RISK REWARD - 2,00
My friends, Thanks to everyone who supports my analysis with likes.🚀

USOIL BUY PositionChart and lines talk to you...
Manage your risk...
R/R4 or more...
Do you think does it worth to risk on this position??

GOLD ROUTE MAP UPDATEHey Everyone,
Another PIPTASTIC day on the markets with our chart idea playing out perfectly!!!
Yesterday we got our Bullish target at 2872 with a further cross and lock above 2872 leaving open 2901.
- This was hit perfectly today followed with ema5 cross and lock above 2901 opening 2921, which was also hit completing the range perfectly.
We will now look for a further cross and lock above 2921 to confirm a continuation or a failure to lock above will follow with a rejection to test lower Goldlturns for support and bounce.
We will keep the above in mind when taking buys from dips. Our updated levels and weighted levels will allow us to track the movement down and then catch bounces up.
We will continue to buy dips using our support levels taking 30 to 40 pips. As stated before each of our level structures give 20 to 40 pip bounces, which is enough for a nice entry and exit. If you back test the levels we shared every week for the past 24 months, you can see how effectively they were used to trade with or against short/mid term swings and trends.
BULLISH TARGET
2872 - DONE
EMA5 CROSS AND LOCK ABOVE 2872 WILL OPEN THE FOLLOWING BULLISH TARGET
2901 - DONE
EMA5 CROSS AND LOCK ABOVE 2901 WILL OPEN THE FOLLOWING BULLISH TARGET
2921 - DONE
EMA5 CROSS AND LOCK ABOVE 2921 WILL OPEN THE FOLLOWING BULLISH TARGET
2950
BEARISH TARGETS
2846
EMA5 CROSS AND LOCK BELOW 2846 WILL OPEN THE FOLLOWING BEARISH TARGET
2820
EMA5 CROSS AND LOCK BELOW 2820 WILL OPEN THE FOLLOWING BEARISH TARGET
2796
EMA5 CROSS AND LOCK BELOW 2796 WILL OPEN THE SWING RANGE
SWING RANGE
2778 - 2753
As always, we will keep you all updated with regular updates throughout the week and how we manage the active ideas and setups. Thank you all for your likes, comments and follows, we really appreciate it!
Mr Gold
GoldViewFX

GOLD ROUTE MAP UPDATEHey Everyone,
Great start to the week with our chart idea off to a flying start and playing out as analysed.
We got our Bullish target hit at 2872 with a further cross and lock opening the range above, which has already given a nice push. We secured our pips and a nice clean finish to the day.
We will now look for the gap above to complete and then look for a further cross and lock to confirm a continuation or a failure to lock above will follow with a rejection to test lower Goldlturns for support and bounce.
We will keep the above in mind when taking buys from dips. Our updated levels and weighted levels will allow us to track the movement down and then catch bounces up.
We will continue to buy dips using our support levels taking 30 to 40 pips. As stated before each of our level structures give 20 to 40 pip bounces, which is enough for a nice entry and exit. If you back test the levels we shared every week for the past 24 months, you can see how effectively they were used to trade with or against short/mid term swings and trends.
BULLISH TARGET
2872 - DONE
EMA5 CROSS AND LOCK ABOVE 2872 WILL OPEN THE FOLLOWING BULLISH TARGET
2901
EMA5 CROSS AND LOCK ABOVE 2901 WILL OPEN THE FOLLOWING BULLISH TARGET
2921
EMA5 CROSS AND LOCK ABOVE 2921 WILL OPEN THE FOLLOWING BULLISH TARGET
2950
BEARISH TARGETS
2846
EMA5 CROSS AND LOCK BELOW 2846 WILL OPEN THE FOLLOWING BEARISH TARGET
2820
EMA5 CROSS AND LOCK BELOW 2820 WILL OPEN THE FOLLOWING BEARISH TARGET
2796
EMA5 CROSS AND LOCK BELOW 2796 WILL OPEN THE SWING RANGE
SWING RANGE
2778 - 2753
As always, we will keep you all updated with regular updates throughout the week and how we manage the active ideas and setups. Thank you all for your likes, comments and follows, we really appreciate it!
Mr Gold
GoldViewFX

Gold CFDs at Critical Juncture: $2,800–$2,900 Range Dictates Xauusd "Gold" is bullish in long term but in short tem it will be more downward and short positions are strong we have to trade accordingly. As it has break the trend line and make some candles in downward so we have to take proper entry for short time.
Wait for a confirmed breakout/breakdown before committing to larger positions. Scalping is viable if price oscillates within the $2,800–$2,900 range.

Bullish Outlook going forward for NQNQ has pulled back and taken Feb. Monthly low as well as grabbing some additional liquidity from Nov. last year. I shorted NQ on Thursday for 473 points to my anticipated level of support. I nearly caught the bottom of the market, followed by an aggressive back move up to equilibrium to end the week. Going forward, with the high impact news coming up in the first 2 weeks of March, I see a bullish outlook and the potential for new ATH. Here is an idea of what I see playing out over the short-term.

GOLD 4H CHART ROUTE MAP & TRADING PLAN FOR THE WEEKHey Everyone,
Please see our updated 4h chart levels and targets for the coming week.
We are seeing price play between two weighted levels with a gap above at 2889 and a gap below at 2853. We will need to see ema5 cross and lock on either weighted level to determine the next range.
We will see levels tested side by side until one of the weighted levels break and lock to confirm direction for the next range.
We will keep the above in mind when taking buys from dips. Our updated levels and weighted levels will allow us to track the movement down and then catch bounces up.
We will continue to buy dips using our support levels taking 30 to 40 pips. As stated before each of our level structures give 20 to 40 pip bounces, which is enough for a nice entry and exit. If you back test the levels we shared every week for the past 24 months, you can see how effectively they were used to trade with or against short/mid term swings and trends.
BULLISH TARGET
2889
EMA5 CROSS AND LOCK ABOVE 2889 WILL OPEN THE FOLLOWING BULLISH TARGET
2914
EMA5 CROSS AND LOCK ABOVE 2914 WILL OPEN THE FOLLOWING BULLISH TARGET
2947
BEARISH TARGETS
2853
EMA5 CROSS AND LOCK BELOW 2853 WILL OPEN THE FOLLOWING BEARISH TARGET
2813
EMA5 CROSS AND LOCK BELOW 2813 WILL OPEN THE FOLLOWING BEARISH TARGET
2771
EMA5 CROSS AND LOCK BELOW 2771 WILL OPEN THE SWING RANGE
SWING RANGE
2744 - 2712
As always, we will keep you all updated with regular updates throughout the week and how we manage the active ideas and setups. Thank you all for your likes, comments and follows, we really appreciate it!
Mr Gold
GoldViewFX

GOLD DAILY CHART MID/LONG TERM UPDATEHey Everyone,
This is an update on our daily chart idea that we are now tracking and playing out perfectly, as analysed.
After completing our Bullish targets we stated that the channel top will act as resistance confirmed with ema5 rejection. A break of the channel top with ema5 would confirm a continuation and failure would confirm rejection. This allowed us to identify true breakouts against fake outs.
We also stated that we need to keep in mind the channel half line below to establish floor to provide support for the range, should we continue to track further up. A break below the half line will open the lower part of the channel to establish floor on the channel bottom. The safest way to track this movement is by buying dips.
- Once again this played out perfectly as we got the rejection on the channel top followed with the channel half line test, which gave the perfect bounce like we stated. We will now either look for a continuation from this bounce or a cross and lock below the half line for a break into the lower channel floor.
This is the beauty of our Goldturn channels, which we draw in our unique way, using averages rather than price. This enables us to identify fake-outs and breakouts clearly, as minimal noise in the way our channels are drawn.
We will use our smaller timeframe analysis on the 1H and 4H chart to buy dips from the weighted Goldturns for 30 to 40 pips clean. Ranging markets are perfectly suited for this type of trading, instead of trying to hold longer positions and getting chopped up in the swings up and down in the range.
We will keep the above in mind when taking buys from dips. Our updated levels and weighted levels will allow us to track the movement down and then catch bounces up using our smaller timeframe ideas.
Our long term bias is Bullish and therefore we look forward to drops like this from rejections, which allows us to continue to use our smaller timeframes to buy dips using our levels and setups.
Buying dips allows us to safely manage any swings rather then chasing the bull from the top.
Thank you all for your likes, comments and follows, we really appreciate it!
Mr Gold
GoldViewFX
