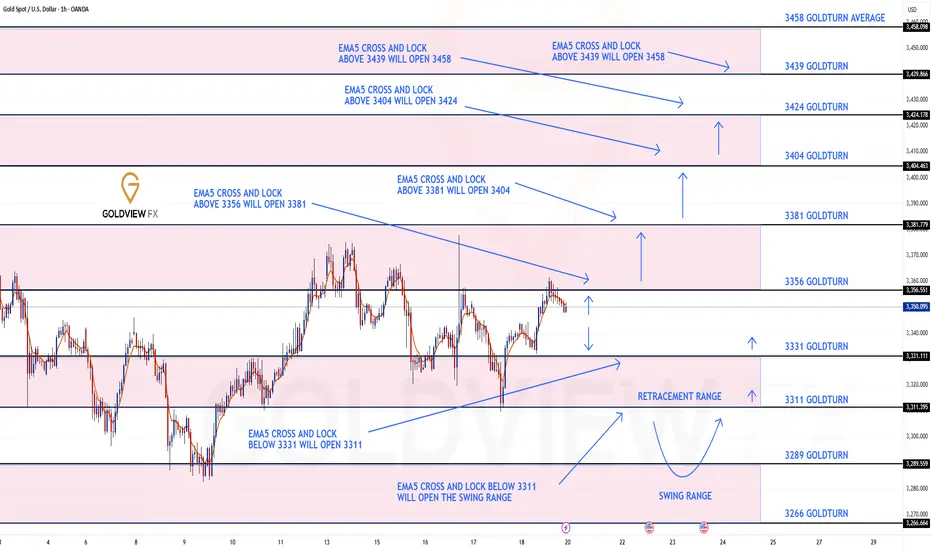
GOLD 1H CHART ROUTE MAP UPDATE & TRADING PLAN FOR THE WEEKHey Everyone,
Please see our updated 1h chart levels and targets for the coming week.
We are seeing price play between two weighted levels with a gap above at 3356 and a gap below at 3331. We will need to see ema5 cross and lock on either weighted level to determine the next range.
We will see levels tested side by side until one of the weighted levels break and lock to confirm direction for the next range.
We will keep the above in mind when taking buys from dips. Our updated levels and weighted levels will allow us to track the movement down and then catch bounces up.
We will continue to buy dips using our support levels taking 20 to 40 pips. As stated before each of our level structures give 20 to 40 pip bounces, which is enough for a nice entry and exit. If you back test the levels we shared every week for the past 24 months, you can see how effectively they were used to trade with or against short/mid term swings and trends.
The swing range give bigger bounces then our weighted levels that's the difference between weighted levels and swing ranges.
BULLISH TARGET
3356
EMA5 CROSS AND LOCK ABOVE 3356 WILL OPEN THE FOLLOWING BULLISH TARGETS
3381
EMA5 CROSS AND LOCK ABOVE 3381 WILL OPEN THE FOLLOWING BULLISH TARGET
3404
EMA5 CROSS AND LOCK ABOVE 3404 WILL OPEN THE FOLLOWING BULLISH TARGET
3424
EMA5 CROSS AND LOCK ABOVE 3424 WILL OPEN THE FOLLOWING BULLISH TARGET
3458
BEARISH TARGETS
3331
EMA5 CROSS AND LOCK BELOW 3331 WILL OPEN THE FOLLOWING BEARISH TARGET
3311
EMA5 CROSS AND LOCK BELOW 3311 WILL OPEN THE SWING RANGE
3289
3266
As always, we will keep you all updated with regular updates throughout the week and how we manage the active ideas and setups. Thank you all for your likes, comments and follows, we really appreciate it!
Mr Gold
GoldViewFX
Tradingideas
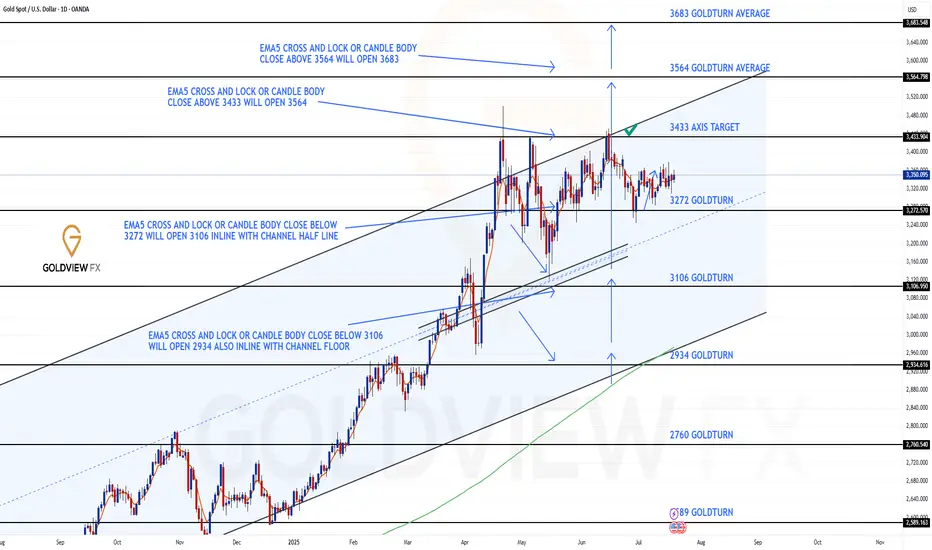
GOLD DAILY CHART ROUTE MAPHey Everyone,
Daily Chart Follow-Up – Structure Still in Full Control
Just a quick update on our daily structure roadmap. Price continues to respect our Goldturn levels with surgical precision.
After the previous bounce off 3272, we saw over 800 pips of upside follow through. That level once again proved its weight, holding beautifully as support and launching price firmly back toward the upper boundary.
Since last week’s update, nothing has changed structurally – the range remains intact and fully respected. Price is still trading between the well defined 3272 support and the untested 3433 resistance. We’ve yet to revisit 3433, which remains our key upside target and a potential inflection point.
Here’s what we’re focusing on next:
🔹 Range scenario active:
Until price breaks out cleanly, we anticipate continued swings between 3433 resistance and 3272 support. This remains the active range setup.
🔹 EMA5 cross and lock:
We’re still watching for a decisive EMA5 break and lock. Without that, we expect more range-bound action rather than a breakout.
🔹 Structure remains intact:
No EMA5 breakdown off 3272 during the recent retest means buyers are still in control. Dips into 3272 remain valid long entries within this structure.
Key Levels This Week
📉 Support – 3272
Proven bounce zone. Continues to hold structure. As long as this holds, the bias remains constructive.
📈 Resistance – 3433
Open gap + channel top confluence. Still untested. Watching for a reaction or breakout confirmation here.
Thanks again for all the continued support, your likes, comments, and follows mean the world.
Wishing you another focused and profitable week ahead!
Mr Gold
GoldViewFX
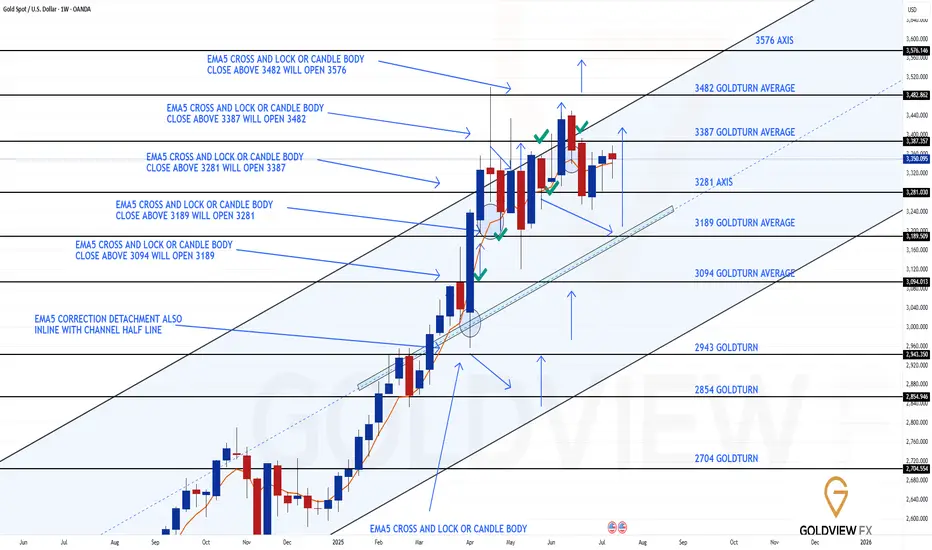
GOLD WEEKLY CHART MID/LONG TERM ROUTE MAPHey Everyone,
Please see update on our Weekly Chart idea.
As of now, nothing has changed structurally, the framework remains fully intact, and price continues to trade cleanly within the defined range.
After delivering a rejection at the channel top, price pulled back into 3281 support, where buyers once again stepped in decisively. That level held firm on a weekly closing basis, validating it as a reliable pivot and launching price back into bounce mode.
Despite the progress, we’ve yet to test the 3387 gap, which continues to act as a short term magnet. The longer range gap at 3482 also remains open and in focus as the larger objective.
Key takeaways from the current structure:
🔹 Structure unchanged:
The rising channel remains orderly. EMA5 still hasn’t locked bearishly, and the mid-line continues to climb beneath price, maintaining a constructive bias.
🔹 Support confirmed – 3281:
Held for a second time, reaffirming its significance in the broader structure.
🔹 3387 gap still in play:
While price is gravitating toward this zone, it has not yet been tested. Expect a reaction on first contact.
Updated Levels to Watch:
📉 Immediate Support – 3281
Held again, reinforcing its status as the key structural axis.
📈 Resistance 1 – 3387
Still untested. Remains the active near term target.
📈 Resistance 2 – 3482
Unfilled weekly gap and broader objective.
Plan:
As long as 3281 continues to hold, the bias remains for a measured grind higher toward 3387 and, eventually, 3482. If 3281 fails, we’ll reassess at the rising mid line for the next structured long opportunity.
As always, we will keep you all updated with regular updates throughout the week and how we manage the active ideas and setups. Thank you all for your likes, comments and follows, we really appreciate it!
Mr Gold
GoldViewFX
Quantum's BA Weekly Outlook 7/19/25🚀 G.O.D. Flow Certified Trade Blueprint – Boeing (BA)
1. 🧩 Summary Overview
Ticker: BA
Current Price: $229.34
Trade Type: Day Trade / 0–2 Day Swing
System: G.O.D. Flow (Gamma, Orderflow, Dealer Positioning)
2. 🔬 Flow Breakdown
🔵 GEX (Gamma Exposure):
Highest negative GEX at $230 = possible resistance or sticky zone.
However, +GEX2 at $235 and +GEX3 at $240 outweigh $230 → suggests dealer hedging will push price upward through gamma bands.
🟡 DEX (Delta Exposure):
+DEX peaks at $230 then fades toward $240 and reappears at $250 → bullish flow decay confirms momentum needs volume through $235–240 to continue upward push.
🟣 Vanna:
Flip zone at $232.50 → if IV rises and price pushes upward, dealers must buy, adding tailwind.
Major positive clusters at $240 & $250 = major squeeze potential if IV increases intraday.
🔴 Charm:
Flip zone at $227.50 = above this level, morning decay benefits bulls.
Negative charm at $240 & $250 = expect afternoon fade into these zones — ideal trim targets.
⚪ Volatility:
Volatility decreasing weekly = less explosive risk, more structured/predictable flow.
Dealers will likely have cleaner hedging paths without IV shocks.
🟢 Open Interest:
Stacked calls at $230, $235, $240, $250.
Aligns with GEX/Vanna targets → confirms upside skew.
3. 🧭 Chart Structure Setup
Daily: Consolidation breakout attempt.
Hourly: Bounce off support with bullish stochastics crossover.
10M OR: Mark OR High/Low — use reclaim of OR High + VWAP as entry signal.
Resistance: $235–240 (flow + OI + chart confluence) = ideal trim zone.
4. 🎯 Trade Plan
Bias: Bullish
Trigger Entry: Break and reclaim of $232.50 (Vanna Flip)
Contract Suggestion:
235c or 240c, 0–2 DTE (Friday expiry if early week)
Stop-Loss:
VWAP loss or break below $230
Target Zones:
🎯 T1: $235 (GEX2 + OI cluster)
🎯 T2: $240 (GEX3 + Vanna/Charm confluence)
5. 🔁 Intraday Adjustment Triggers
If This Happens: Then Do This:
GEX flips positive above $232.50 Strengthen conviction
Vanna clusters weaken + IV drops Trim / De-risk
Charm flips heavily negative by 12pm Expect fade into highs
Large sweeps hit 235c/240c strikes Ride momentum with size confidence

GOLD ROUTE MAP UPDATEHey Everyone,
End of week update following up on yesterday’s 1H chart outlook.
✅ 3353 was hit and respected to the pip, just as we mapped out and highlighted yesterday.
We saw the EMA5 cross and lock above 3328, confirming continuation.
The market respected structure beautifully
Rejections gave us clean dip buying entries
EMA5 methodology guided our execution
High probability Goldturn levels played out exactly as planned
Our discipline and patience were rewarded, yet again. Another strong end to the week.
We will now come back Sunday with a full multi timeframe analysis to prepare for next week’s setups, including updated views on the higher timeframes, EMA alignments, and structure expectations going forward.
Thanks again for all your likes, comments, and follows.
Wishing you all a fantastic weekend!!
Mr Gold
GoldViewFX
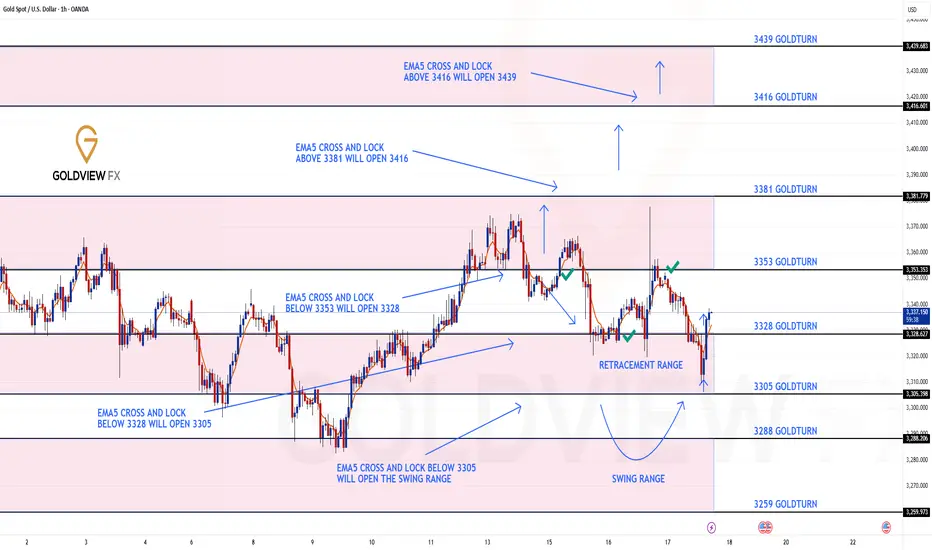
GOLD ROUTE MAP UPDATEHey Everyone,
Quick follow-up on yesterday’s 1H chart update
After hitting 3353, we did not see an EMA5 cross and lock above this level. That lack of confirmation was key and it validated a rejection right at 3353, leading to another drop into the retracement zone.
As per plan, that retracement provided yet another clean bounce, perfectly in line with our dip buying strategy.
We are once again looking toward 3353, and just like before, we will be closely watching for an EMA5 cross and lock confirmation to validate any continuation.
This kind of movement continues to confirm the power of patience, structure, and disciplined execution. No chasing just clean planned executions with high probability setups based on our EMA5 methodology.
We’re also still watching the 3381 gap a key magnet above, and a level we’ve been tracking since the Monday outlook. The roadmap remains unchanged. We’re trading the structure, managing risk, and letting confirmations guide the execution.
Updated Reminder of Key Levels:
BULLISH TARGET
3381
EMA5 CROSS & LOCK ABOVE 3381 opens
3416
EMA5 CROSS & LOCK ABOVE 3416 opens
3439
BEARISH TARGETS
3353 ✅ HIT
EMA5 CROSS & LOCK BELOW 3353 opens
3328 ✅ HIT
EMA5 CROSS & LOCK BELOW 3328 opens
3305
EMA5 CROSS & LOCK BELOW 3305 opens Swing Range:
3288
3259
As always, we’ll continue monitoring and sharing updates, as price reacts around these zones. Thank you all for the continued support, your likes, comments, and follows are genuinely appreciated!
Mr Gold
GoldViewFX
Good bullish signOn weekly tf, previous ath broken and trying to sustain. And if it breaks 15 mins tf with better volume, it may go up. This is only for educational purposes. Do your own analysis and do trade
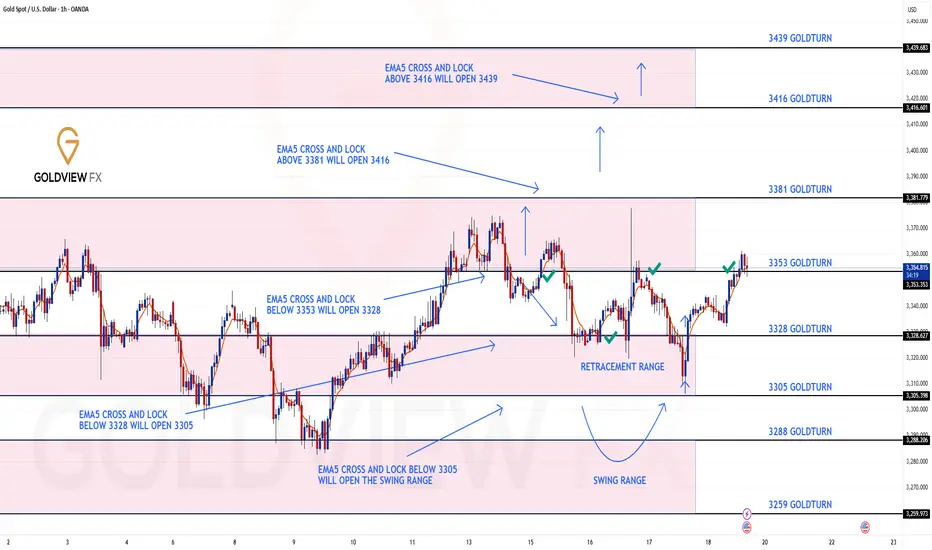
1H CHART ROUTE MAP UPDATEHey Everyone,
Quick follow up on yesterday’s 1H chart update
Today, we saw exactly the type of reaction we were looking for at the 3328 retracement level. Price respected the zone perfectly, offering a clean bounce, just as we anticipated and stated yesterday. There was no EMA5 cross and lock below 3328, confirming a strong rejection and aligning perfectly with our plan to buy dips into 3355 and above.
This move further validates our structure and the importance of waiting for confirmations rather than jumping the gun. As always, EMA5 cross and lock levels remain key in tracking momentum shifts. We’ll continue to monitor for a cross and lock above each Goldturn level to confirm the next move.
Also, let’s not forget the 3381 gap we highlighted in Monday’s outlook, it remains a magnet above, and we’re keeping it firmly on our radar.
The plan remains the same: We are buying dips at key levels with solid risk management and using EMA5 confirmations to confirm the moves.
Updated Reminder of Key Levels:
BULLISH TARGET
3381
EMA5 CROSS & LOCK ABOVE 3381 opens
3416
EMA5 CROSS & LOCK ABOVE 3416 opens
3439
BEARISH TARGETS
3353 ✅ HIT
EMA5 CROSS & LOCK BELOW 3353 opens
3328 ✅ HIT
EMA5 CROSS & LOCK BELOW 3328 opens
3305
EMA5 CROSS & LOCK BELOW 3305 opens Swing Range:
3288
3259
As always, we’ll continue monitoring and sharing updates, as price reacts around these zones. Thank you all for the continued support, your likes, comments, and follows are genuinely appreciated!
Mr Gold
GoldViewFX

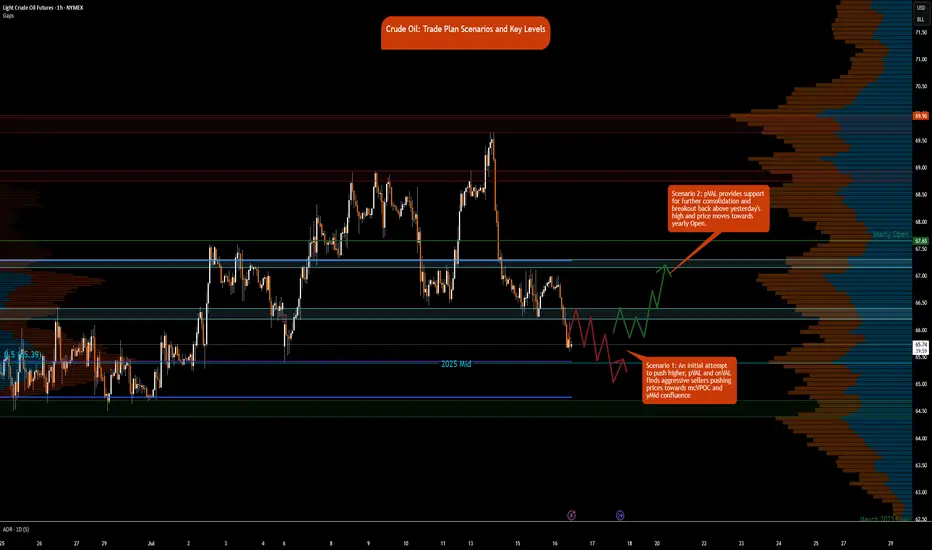
Crude Oil Trade Plan Scenarios and Key Levels
NYMEX:CL1!
It’s Wednesday today, and the DOE release is scheduled for 9:30 a.m. CT. This may provide fuel—pun intended—to push prices out of the two-day consolidation. Also, note that the August contract expires on July 22, 2025. Rollover to the September contract is expected on Thursday/Friday. You can see the pace of the roll here at CME’s pace of roll tool . The chart shows that rollover is about 70% complete, and CLU25 has higher open interest. Note, the front-month August contract is still trading at higher volume.
What has the market done?
Crude oil is in a multi-distribution profile since the peak witnessed during the Iran-Israel conflict. Crude oil formed a strong base above the 64s and traversed towards the 69s. Prices were rejected at these highs and have since reverted back towards the monthly Volume Point of Control, monthlyVPOC.
What is it trying to do?
The market is in active price discovery mode and has formed multi-distributions since June 23. The market has been consolidating after prices at highs were rejected.
How good of a job is it doing?
The market is active and is also providing setups against key levels. Patience to take trades from these higher time frame levels is what is required to trade crude oil currently. Otherwise, there is a lot of volatility and chop that can throw traders off their plan.
Key Levels:
• Yearly Open: 67.65
• Neutral zone: 67.15–67.30
• 2-Day VAL (Value Area Low): 66.40
• Neutral zone: 66.40–66.20
• 2025 Mid-Range: 65.39
• Key Support: 64.40–64.70
What is more likely to happen from here?
Scenario 1: An initial attempt to push higher, pVAL and onVAL finds aggressive sellers pushing prices towards mcVPOC and yMid confluence
Scenario 2: pVAL provides support for further consolidation and break back above yesterday's high and price moves towards yearly Open.
Glossary:
pVAL: Prior Value Area Low
onVAL: Overnight Value Area Low
yMid: 2025 Mid-Range
mcVPOC: Micro Composite Volume Point of Control
GOLD 1H CHART ROUTE MAP UPDATEHey Everyone,
Quick follow up on our 1H chart idea
We had a nice push up on the chart at the start of the week, coming close but just short of the 3381 gap. Still, it was a solid catch that respected our levels beautifully.
Following that, we cleared our 3353 Bearish Target, which also triggered the EMA5 cross and lock, confirming the move toward our 3328 retracement range, a level we hit perfectly.
As expected, we're now seeing a reaction in this 3328 zone, which remains key. We are watching this closely for a potential bounce. However, if price crosses and locks below 3328, the swing range will open, setting up the potential for a larger swing bounce from deeper levels.
We’ll continue using dips and key support zones for scalps and intraday bounces, aiming for 20–40 pips per level. The structure remains valid, and as mentioned before, our back-tested levels have consistently shown strong reaction zones over the past 24 months.
Updated Reminder of Key Levels:
BULLISH TARGET
3381
EMA5 CROSS & LOCK ABOVE 3381 opens
3416
EMA5 CROSS & LOCK ABOVE 3416 opens
3439
BEARISH TARGETS
3353 ✅ HIT
EMA5 CROSS & LOCK BELOW 3353 opens
3328 ✅ HIT
EMA5 CROSS & LOCK BELOW 3328 opens
3305
EMA5 CROSS & LOCK BELOW 3305 opens Swing Range:
3288
3259
As always, we’ll continue monitoring and sharing updates, as price reacts around these zones. Thank you all for the continued support, your likes, comments, and follows are genuinely appreciated!
Mr Gold
GoldViewFX

GOLD 4H CHART ROUTE MAP UPDATEHey Everyone,
Great start to the week with our chart idea playing out as analysed.
We started the week with our Bullish target 3364 HIT, followed with no ema5 lock confirming the rejection. Bearish target remains open and may complete with the rejection.
We will continue with our plans to buy dips, utilising the support levels from the bearish targets and/or Goldturns. Also keeping in mind our 1h chart, although gave a nice push up , the full Bullish gap remains open.
We will keep the above in mind when taking buys from dips. Our updated levels and weighted levels will allow us to track the movement down and then catch bounces up.
We will continue to buy dips using our support levels taking 20 to 40 pips. As stated before each of our level structures give 20 to 40 pip bounces, which is enough for a nice entry and exit. If you back test the levels we shared every week for the past 24 months, you can see how effectively they were used to trade with or against short/mid term swings and trends.
The swing range give bigger bounces then our weighted levels that's the difference between weighted levels and swing ranges.
BULLISH TARGET
3364 - DONE
EMA5 CROSS AND LOCK ABOVE 3364 WILL OPEN THE FOLLOWING BULLISH TARGETS
3429
EMA5 CROSS AND LOCK ABOVE 3429 WILL OPEN THE FOLLOWING BULLISH TARGET
3499
EMA5 CROSS AND LOCK ABOVE 3499 WILL OPEN THE FOLLOWING BULLISH TARGET
3561
BEARISH TARGETS
3297
EMA5 CROSS AND LOCK BELOW 3297 WILL OPEN THE SWING RANGE
3242
3171
EMA5 CROSS AND LOCK BELOW 3171 WILL OPEN THE SECONDARY SWING RANGE
3089
3001
As always, we will keep you all updated with regular updates throughout the week and how we manage the active ideas and setups. Thank you all for your likes, comments and follows, we really appreciate it!
Mr Gold
GoldViewFX

GOLD 1H CHART ROUTE MAP UPDATE & TRADING PLAN FOR THE WEEKHey Everyone,
Please see our updated 1h chart levels and targets for the coming week.
We are seeing price play between two weighted levels with a gap above at 3381 and a gap below at 3353. We will need to see ema5 cross and lock on either weighted level to determine the next range.
We will see levels tested side by side until one of the weighted levels break and lock to confirm direction for the next range.
We will keep the above in mind when taking buys from dips. Our updated levels and weighted levels will allow us to track the movement down and then catch bounces up.
We will continue to buy dips using our support levels taking 20 to 40 pips. As stated before each of our level structures give 20 to 40 pip bounces, which is enough for a nice entry and exit. If you back test the levels we shared every week for the past 24 months, you can see how effectively they were used to trade with or against short/mid term swings and trends.
The swing range give bigger bounces then our weighted levels that's the difference between weighted levels and swing ranges.
BULLISH TARGET
3381
EMA5 CROSS AND LOCK ABOVE 3381 WILL OPEN THE FOLLOWING BULLISH TARGETS
3416
EMA5 CROSS AND LOCK ABOVE 3416 WILL OPEN THE FOLLOWING BULLISH TARGET
3439
BEARISH TARGETS
3353
EMA5 CROSS AND LOCK BELOW 3353 WILL OPEN THE FOLLOWING BEARISH TARGET
3328
EMA5 CROSS AND LOCK BELOW 3328 WILL OPEN THE FOLLOWING BEARISH TARGET
3305
EMA5 CROSS AND LOCK BELOW 3305 WILL OPEN THE SWING RANGE
3288
3259
As always, we will keep you all updated with regular updates throughout the week and how we manage the active ideas and setups. Thank you all for your likes, comments and follows, we really appreciate it!
Mr Gold
GoldViewFX

GOLD 4H CHART ROUTE MAP UPDATE & TRADING PLAN FOR THE WEEKHey Everyone,
Please see our updated 4h chart levels and targets for the coming week.
We are seeing price play between two weighted levels with a gap above at 3364 and a gap below at 3297. We will need to see ema5 cross and lock on either weighted level to determine the next range.
We will see levels tested side by side until one of the weighted levels break and lock to confirm direction for the next range.
We will keep the above in mind when taking buys from dips. Our updated levels and weighted levels will allow us to track the movement down and then catch bounces up.
We will continue to buy dips using our support levels taking 20 to 40 pips. As stated before each of our level structures give 20 to 40 pip bounces, which is enough for a nice entry and exit. If you back test the levels we shared every week for the past 24 months, you can see how effectively they were used to trade with or against short/mid term swings and trends.
The swing range give bigger bounces then our weighted levels that's the difference between weighted levels and swing ranges.
BULLISH TARGET
3364
EMA5 CROSS AND LOCK ABOVE 3364 WILL OPEN THE FOLLOWING BULLISH TARGETS
3429
EMA5 CROSS AND LOCK ABOVE 3429 WILL OPEN THE FOLLOWING BULLISH TARGET
3499
EMA5 CROSS AND LOCK ABOVE 3499 WILL OPEN THE FOLLOWING BULLISH TARGET
3561
BEARISH TARGETS
3297
EMA5 CROSS AND LOCK BELOW 3297 WILL OPEN THE SWING RANGE
3242
3171
EMA5 CROSS AND LOCK BELOW 3171 WILL OPEN THE SECONDARY SWING RANGE
3089
3001
As always, we will keep you all updated with regular updates throughout the week and how we manage the active ideas and setups. Thank you all for your likes, comments and follows, we really appreciate it!
Mr Gold
GoldViewFX

GOLD DAILY CHART ROUTE MAPHey Everyone,
Daily Chart Follow Up – Structure Still in Full Control
Just a quick update on our daily structure roadmap. Price continues to respect our Goldturn levels with surgical precision.
After the previous bounce off 3272, we’ve now seen over 800 pips of upside follow through. That level once again proved its weight, holding beautifully as support and launching price firmly back toward the upper boundary.
We now have a clear gap overhead at 3433, which sits right near the channel top a familiar rejection zone. With that in play, we’re expecting a range bound dynamic to develop between 3272 and 3433 in the short term.
Here’s what we’re focusing on next:
Range scenario active:
Until price breaks out cleanly, we anticipate swings between 3433 resistance and 3272 support to play out. This is the working range for now.
EMA5 cross and lock:
Watch for a clean EMA5 break and lock, this will be our technical confirmation for whether we’re breaking out of this range or just ping ponging inside it.
Structure remains intact:
No EMA5 breakdown off 3272 during the recent test means buyers remain in control. Until that changes, dips into 3272 continue to offer structured long setups.
Key Levels This Week
Support 3272 Proven bounce zone. As long as this holds, the structure favours upside.
Resistance 3433 Open gap + channel top confluence; expect reaction and potential fade unless we break cleanly with EMA5 confirmation.
As always, we continue to let structure guide the way, measured, deliberate, and data-driven.
Thanks again for all the continued support, every like, comment, and follow is truly appreciated.
Wishing you all a focused and profitable week ahead!
Mr Gold
GoldViewFX

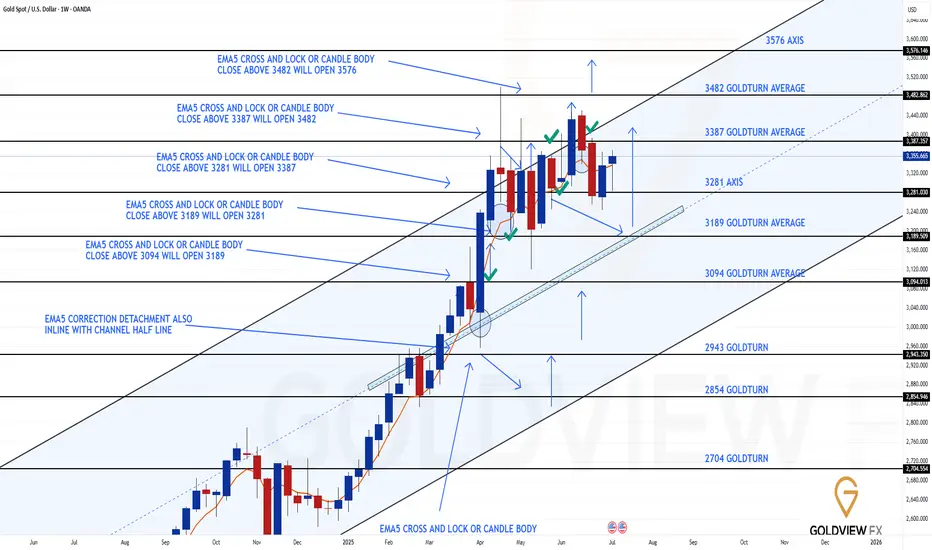
GOLD WEEKLY CHART MID/LONG TERM ROUTE MAPHey Everyone,
Please see update on our weekly chart idea.
Price delivered the rejection at the channel top, so our longer range gap at 3482 remains open overhead. The pullback rejection from channel top extended to 3281 axis precisely where buying interest stepped in, just before the rising channel mid-line, which is edging higher in tandem with price and keeping the broader structure intact.
Key take aways from the latest swing:
Support confirmed:
3281 held on a weekly closing basis, giving us the springboard we needed.
Bounce in motion:
We’ve already reclaimed the prior pivot zone and are now working on the 3387 gap fill; this is the near-term magnet before any attempt at the larger 3482 imbalance.
Structure unchanged:
The channel is still orderly, the EMA5 has curled but hasn’t locked bearishly, and the mid-line continues to ascend beneath price, favouring a measured, step wise climb.
Updated Levels to Watch:
Immediate Support 3281 Proven axis support
Resistance 1 3387 Gap fill target in progress; expect reaction.
Resistance 2 3482 Long standing weekly gap remains the bigger picture objective.
Plan: While 3281 holds, bias remains for a grind higher toward 3387 and ultimately 3482. Should 3281 fail, we reassess at the mid-line for the next structured long setup.
We remain patient and continue reacting to clean structure backed opportunities.
Mr Gold
GoldViewFX
EURUSD. The plan for the next few days.The nearest resistance zones are where it's interesting to look for purchases. We are waiting for a reaction and looking for an entry point.
The post will be adjusted if there are any changes.
Don't forget to click on the Rocket! =)

GOLD ROUTE MAP UPDATEHey Everyone,
Great finish to the week!!!
After completing our Bearish targets throughout the week, we got the swing perfectly, like we analysed and was waiting for our Bullish target to be complete.
- We got the Bullish target at 3358 HIT perfectly completing this range!!
BULLISH TARGET
3358 - DONE
BEARISH TARGETS
3330 - DONE
EMA5 CROSS AND LOCK BELOW 3330 WILL OPEN THE FOLLOWING BEARISH TARGET
3306 - DONE
EMA5 CROSS AND LOCK BELOW 3306 WILL OPEN THE SWING RANGE
3283 - DONE
We will now come back Sunday with a full multi timeframe analysis to prepare for next week’s setups, including updated views on the higher timeframes, EMA alignments, and structure expectations going forward.
Thanks again for all your likes, comments, and follows.
Wishing you all a fantastic weekend!!
Mr Gold
GoldViewFX

Gold Price Analysis July 10🔹 XAUUSD Analysis – D1
Yesterday's D1 candle showed a strong recovery, closing above 3313, thereby significantly weakening the previous downtrend structure. Currently, the price is reacting very strongly at the trendline around 3284. Buying pressure is clearly appearing, pushing gold back to trading in a wide range.
In the short term, the 3328 area will play an important resistance role. If the price cannot break this area, the possibility of a correction down to the Gap price area this morning is quite high. The peak-bottom trading method is still giving suitable signals in the current market context.
🔹 Important zones:
Support: 3312 – 3295 – 3279
Resistance: 3328 – 3339 – 3349 – 3363
💡 Strategy:
Confirm the trading signal when the price clearly rejects the resistance zones to ensure the highest winning rate.

GOLD ROUTE MAP UPDATEHey Everyone,
Another PIPTASTRIC day on the markets with our chart idea and levels playing out and being respected, as analysed.
After completing the swing range test and full swing into 3306, we stated yesterday that we will now look for ema5 cross and lock above 3306 to open 3330. This was locked and loaded and completed the 3330 target today.
We will now continue to look for ema5 lock above 3330 for a continuation into the bullish targets above or failure to lock will see rejections into the lower Goldturns for support and bounce inline with our plans to buy dips.
We will keep the above in mind when taking buys from dips. Our updated levels and weighted levels will allow us to track the movement down and then catch bounces up.
We will continue to buy dips using our support levels taking 20 to 40 pips. As stated before each of our level structures give 20 to 40 pip bounces, which is enough for a nice entry and exit. If you back test the levels we shared every week for the past 24 months, you can see how effectively they were used to trade with or against short/mid term swings and trends.
The swing range give bigger bounces then our weighted levels that's the difference between weighted levels and swing ranges.
BULLISH TARGET
3358
EMA5 CROSS AND LOCK ABOVE 3358 WILL OPEN THE FOLLOWING BULLISH TARGETS
3389
EMA5 CROSS AND LOCK ABOVE 3389 WILL OPEN THE FOLLOWING BULLISH TARGET
3416
EMA5 CROSS AND LOCK ABOVE 3416 WILL OPEN THE FOLLOWING BULLISH TARGET
3439
BEARISH TARGETS
3330 - DONE
EMA5 CROSS AND LOCK BELOW 3330 WILL OPEN THE FOLLOWING BEARISH TARGET
3306 - DONE
EMA5 CROSS AND LOCK BELOW 3306 WILL OPEN THE SWING RANGE
3283 - DONE
3254
As always, we will keep you all updated with regular updates throughout the week and how we manage the active ideas and setups. Thank you all for your likes, comments and follows, we really appreciate it!
Mr Gold
GoldViewFX

Crude Oil Trade Idea: Intraday mechanicsNYMEX:CL1! NYMEX:MCL1!
Bigger Picture:
Traders should note that news headlines do not always drive the price action. More often, news outlets look for narrative to align with the price action.
Previously, it was about the supply glut and worsening demand due to an uncertain outlook. Now the latest news flow is about Aramco OSP rising, OPEC+ adding another 548K bpd in August — higher than anticipated 411K — of the wounding of involuntary cuts. News outlets now view this as signs of demand growth and low inventories.
What has the market done?
Market has consolidated, building acceptance around microComposite Volume Point of Control at 65.50 (mcVPOC). Market then broke out of this balance.
What is it trying to do?
Market is building value higher; 2-day mcVPOC is at 68.29.
How good of a job is it doing?
Market is holding support and has tested resistance multiple times. It has also held support.
What is more likely to happen from here?
Further movement higher as long as it holds above support and yearly open confluence in the short term.
Key Levels:
• Resistance zone: 68.95 - 68.85
• pHi: 68.87
• 2-day VPOC: 68.29
• pSettlement: 68.38
• yOpen: 67.65
• Support zone: 67.70 - 67.50
• pLow: 67.89
Primary Scenario:
Crude oil pit session begins with open auction in yesterday’s range. Prices move lower to test prior day's low, 2-day balance support in confluence with yearly open. Prices push back higher towards yesterday's settlement and 2-day Volume Point of Control (VPOC) at 68.33.
Secondary Scenario:
Crude oil pit session begins with open auction in yesterday’s range. Market consolidates and chops around pSettlement and 2-day VPOC. Market takes out overnight high, fails to go further higher, and reverts lower. Settles below overnight low, however staying above prior low to continue one-time framing higher for the regular trading hours (RTH).

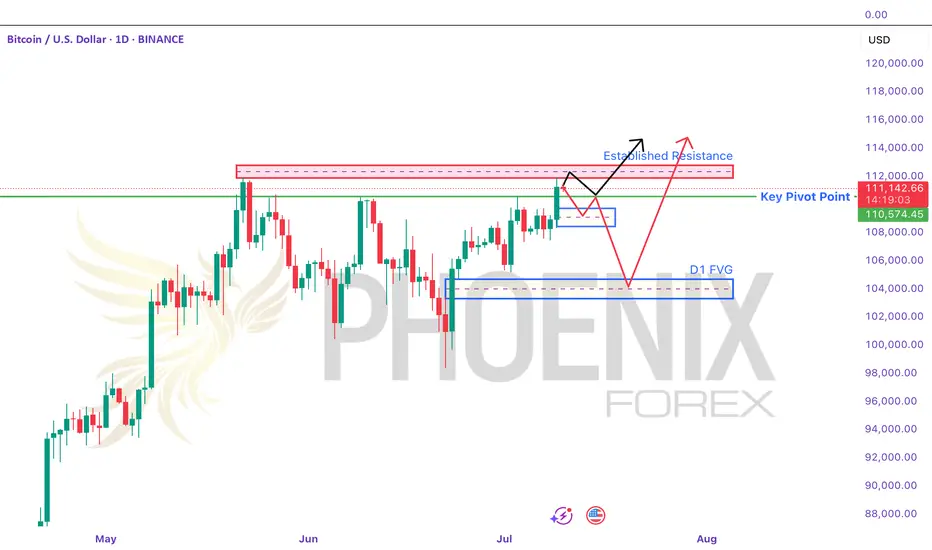
BTCUSD At Crucial Pivot Point. Is This The Ceiling? - PhoenixFX BTCUSD Price-Action Analysis & Scenarios
Below is an overview of the two possible paths for Bitcoin over the coming days, as sketched out by the black and red arrows on your chart. We’ll also highlight the key pivot level and resistance zone that will decide which scenario plays out.
🔵 Key Levels to Watch
Established Resistance (~$111,800–$112,500)
This zone marks multiple failed attempts to break higher in recent weeks. It’s where large stop-runs and sell-side limit orders tend to cluster. A decisive daily close above $112K is required to signal genuine bullish continuation.
Daily Pivot Point (~$110,600)
Acting as the “battle line” between bulls and bears, this pivot is the first level to confirm market bias.
Above $110.6K: Tends to favor buyers, suggesting strength and higher-high attempts.
Below $110.6K: Gives the bears the edge, increasing the odds of deeper retracements.
📈 Black-Arrow (“Bullish Continuation”) Scenario
Break & Hold Above Resistance
Price thrusts cleanly above $112K on strong volume.
Retest the H4 Order Block (~$111,000–$111,200)
A shallow pullback into the highlighted H4 demand zone (blue box) offers a lower-risk long entry.
New Highs
From there, Bitcoin resumes its uptrend, closing the week with fresh highs above the prior $113K peak.
Key Trigger: Sustained daily close above $112K, followed by a successful retest of that level.
📉 Red-Arrow (“Bearish Rejection & Dip”) Scenario
Rejection at Resistance
Price stalls and reverses somewhere between $111,800–$112,500, forming a bearish reversal candle.
Drop to Daily FVG Zone (~$104,000–$105,000)
This larger Daily Fair-Value Gap (blue box lower on the chart) coincides with strong weekly support—an ideal zone for dip buyers.
Recovery Rally
After absorbing selling pressure in the FVG, BTC bounces back toward the established resistance, setting up a second test of $112K.
Key Trigger: Clear bearish price action (e.g., engulfing or pin-bar) in the $111.8K–$112.5K zone, followed by a daily close below the pivot at $110.6K.
🎯 How to Trade These Setups
Bullish Entry:
Wait for daily close > $112K
Enter on pullback into $111K–$111.2K (H4 order block)
Stop below $110.6K pivot; target new highs above $113K+
Bearish Entry:
Look for bearish reversal signals in $111.8K–$112.5K
Enter on break & close below $110.6K pivot
Target $104K–$105K (Daily FVG); stop above $112.5K
Note: The pivot at $110.6K is your first “line in the sand” for bias—trade in the direction of the break, and use the major resistance zone to confirm strength or failure. Always manage your risk and adjust to how price actually unfolds!
Just a Heads-Up:
This is my take on the charts—not gospel, not financial advice, and definitely not a crystal ball 🔮. Trading is part skill, part patience, and part “what just happened?” 😅
We all see things a little differently, and that’s the beauty of it. So if you’ve got a hot take, wild theory, or just want to drop some chart wisdom—hit the comments!
Let’s grow, learn, and laugh through the madness together. 🚀📈
Each one, teach one.
— Phoenix FX Team 🔥🦅
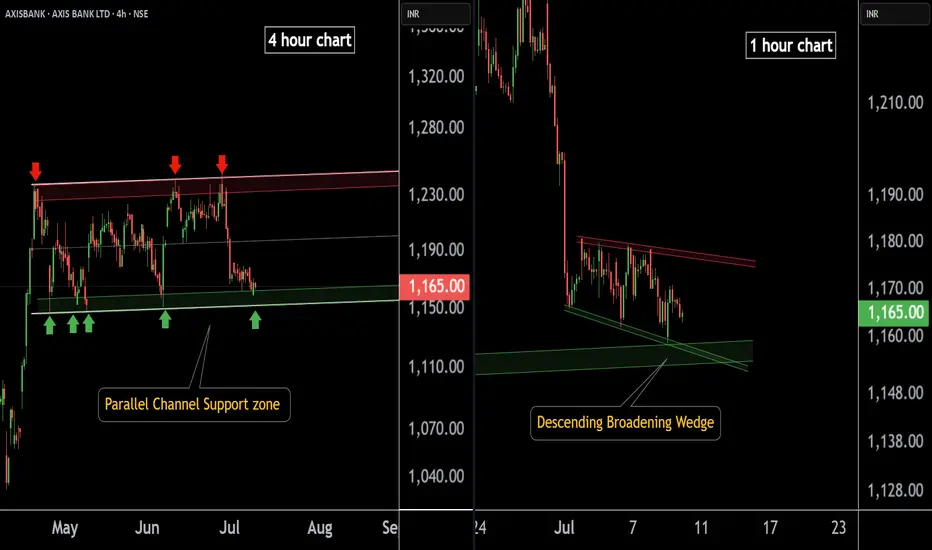
AXIS BANK at Best Support !!Here are two charts of Axis Bank — one in the 4-hour timeframe and the other in the 1-hour timeframe.
4-Hour Timeframe Chart:
In this chart, Axis Bank is moving within a parallel channel, with the support zone lying in the 1150–1160 range.
1-Hour Timeframe Chart:
Axis Bank is forming a descending broadening wedge pattern, with support near the 1150–1155 zone.
If this level is sustain ,then we may see higher prices in Axis Bank.
Thank You !!
GOLD ROUTE MAP UPDATEHey Everyone,
Absolutely beautiful to see our 1h chart idea playing out perfectly. After completing the bearish targets earlier this week, we had the ema5 cross and lock below 3306 opening the swing range.
- This played out perfectly hitting the first swing range level and doing exactly what it say son the tin giving the full swing into 3306 just like we highlighted.
We will now look for ema5 lock above 3306 for a continuation into the bullish targets above or failure to lock will see rejections into the lower Goldturns for suport and bounce.
If it continues to fail breakout above, into the first Bullish target, then we are likely to see the full swing range tested on the rejections.
We will keep the above in mind when taking buys from dips. Our updated levels and weighted levels will allow us to track the movement down and then catch bounces up.
We will continue to buy dips using our support levels taking 20 to 40 pips. As stated before each of our level structures give 20 to 40 pip bounces, which is enough for a nice entry and exit. If you back test the levels we shared every week for the past 24 months, you can see how effectively they were used to trade with or against short/mid term swings and trends.
The swing range give bigger bounces then our weighted levels that's the difference between weighted levels and swing ranges.
BULLISH TARGET
3358
EMA5 CROSS AND LOCK ABOVE 3358 WILL OPEN THE FOLLOWING BULLISH TARGETS
3389
EMA5 CROSS AND LOCK ABOVE 3389 WILL OPEN THE FOLLOWING BULLISH TARGET
3416
EMA5 CROSS AND LOCK ABOVE 3416 WILL OPEN THE FOLLOWING BULLISH TARGET
3439
BEARISH TARGETS
3330 - DONE
EMA5 CROSS AND LOCK BELOW 3330 WILL OPEN THE FOLLOWING BEARISH TARGET
3306 - DONE
EMA5 CROSS AND LOCK BELOW 3306 WILL OPEN THE SWING RANGE
3283 - DONE
3254
As always, we will keep you all updated with regular updates throughout the week and how we manage the active ideas and setups. Thank you all for your likes, comments and follows, we really appreciate it!
Mr Gold
GoldViewFX
