BTCUSD 4H charts (6/5/2019)Good morning, traders. In yesterday's update, I outlined what I was watching for and what I wanted to see for price to continue higher. The daily candle did not close as bullishly as I had hoped it would, however the pivot held and we saw a strong rebound off the 4H S2 pivot. Usually, if the move is corrective and not a reversal, we expect to see price bouncing somewhere between the S1 and S2 pivot (usually closer to the latter) like it did. Additionally, price has printed what appears to be a well-defined ABC pattern which is corrective. We don't know for sure if it's an ABC or just the first 3 waves of a set, but the fact that the 3rd or C wave did not exceed the 1.618% extension of the first wave means that the ABC is a possibility. We could also see a complex correction as described below. If it is a simple ABC corrective set, then we should expect price to continue heading toward new 2019 highs.
When it comes to the daily, I would like to see today's candle close above the 21 EMA. If it does, then that means that the 21 EMA held as support because yesterday's and today's candle spread would be on that 21 EMA. If it closes below it then that opens the door to more possible downside, but doesn't guarantee it. Beyond that, we need to see price continue above the 4H pivot at $8600. If it fails to get above this point, then it's possible that we are seeing a larger, complex correction and we should be able to note an ABC pattern from the bounce. This would have me looking for support around the $6900-$7000 level. The 4H RSI breaching its red descending resistance should be a good indication of price solidly moving up at that time.
The 4H Coinbase chart shows the expected movement according to EW, the pitchfork, and the pivots. That doesn't mean that price will move exactly as shown. This is especially important to remember on the pullbacks because if demand is significantly more than the supply, we won't see the deeper usual retracements that we expect. The 4H Bitstamp chart shows another way of looking at this area. As I have been mentioning, price has been moving sideways for the past 3 weeks. I have labeled this TR as reaccumulation for now however, depending on just how far the final thrust goes, it may be a form of distribution. If it is the latter, then I think price will likely find a top closer to the ~$10,500/$10,600 level. Because of the parabolic advance, though, I'm still thinking we need to see a blow-off top, which would likely have price reaching the box on the Coinbase chart at least. This would result in a hypodermic distribution, similar in structure at the top to what we saw at the end of 2017.
Every day, we have a choice to act positively or negatively, so if you get a chance, do something decent for someone today which could be as simple as sharing a nice word with them. You just might change their day, or even their life.
You can always click on the "share" button in the lower right hand of the screen, under the chart, and then click on "Make it mine" from the popup menu in order to get a live version of the chart that you can explore on your own.
Tradingrange

BTCUSD 1D chart (6/4/2019)Good morning, traders. Yesterday's drop has, again, scared retail into immediate bearishness. Remember, emotions will most often lose you money in the market. So should you be worried? I mentioned yesterday that "A breakdown below the $7900 demand zone should indicate that price will, instead, continue correcting toward the $6000 level." Just so we are clear, when I say a breakdown I mean a larger TF candle close below the level mentioned. In this case, I would be looking for a daily close below $7900. At this time, the daily candle is looking quite bullish as it is printing a hammer with a long lower wick just above the daily pivot/EQ of the recent demand zone. Additionally, we see the 21 EMA and higher volume node providing support to the candle body. If the daily closes like this or better, I see little reason to believe that price won't head up once more. Again, the EW count is tricky as there are multiple ways to view it, but taking everything else into consideration, it seems unfinished, hence my labels as they currently sit. The grey zones are supply and demand while the red and green horizontal lines are support levels.
It still bothers me, if this count is correct, that wave 4 is so significantly asymmetrical to wave 2 in regards to the wave's length of time to develop. However, the shorter TF wave count seems to be working out so far with the recent drop finding support between the 50% and 61.8% retracement of what may potentially be the first subwave of the next wave set up. I have also outlined what I was referring to yesterday when I said that the current price action may be following the pattern we saw as price pushed above the $6K level. As we can see, the last time price dipped below the 21 EMA it was near the end of that lower green box with price ultimately finding support on the EMA before pushing up. RSI and Stoch RSI are very similar as well. Finally, that prior drop through the EMA occured at the outer edge of the pitchfork and this one is happening at the median of the pitchfork. In either case, it is an area of pirchfork significance.
As I continue to warn traders, none of this guarantees upward momentum from here. It does, however, provide a strong opposing narrative to the kneejerk emotional bearishness that springs up across social media immediately following any movement down. If price loses pivot support, I will be watching for a bounce off the red line, but really expecting price to target the next HVN at $6400-$6600 with a possible wick near the S1 pivot at $6175. Further fallling will have me watching the $5300 level for support. Don't forget, the $8000 level is the monthly pivot so all price really has been doing between $7600 and $9100 is consolidating around that pivot. In that case, maybe the EW count is similar to what I have and this sideways consolidation for almost 3 weeks is wave 4 which would then be much more symmetrical to wave 2. Until we get definitiveness of movement (i.e. movement above the swing high around $9100 or below the swing low around $6600 on this Coinbase chart) nobody knows for sure what is going on and the best we can do is prepare either way while looking for clues as price moves.
Every day, we have a choice to act positively or negatively, so if you get a chance, do something decent for someone today which could be as simple as sharing a nice word with them. You just might change their day, or even their life.
You can always click on the "share" button in the lower right hand of the screen, under the chart, and then click on "Make it mine" from the popup menu in order to get a live version of the chart that you can explore on your own.

BTCUSD 1D/1H charts (6/3/2019)Good morning traders. Over the weekend, price hit my immediate target of $8700 and then a bit more, topping out at $8833. After the short correction overnight, which saw price retest the blue TR support, it looks like price is headed higher once more. At this time, I am looking for price to target the 1H R1 pivot at $9220 as it prints the JAC and then an SOS. We should then generally expect price to retrace toward the TR to print the BUEC/LPS, but I wouldn't expect it to drop below the pivot/red line. The ensuing leg up should take price to the daily R1 pivot at $10,000. However, I expect price to ultimately hit $10,500/$10,600 at least (potentially up to ~$12,900 which is the weekly R1 pivot), if it does make it to $10,000. We have to see what price action and volume look like as it gets to that point.
Looking at the bigger picture, this morning's swing low bounced just above the dashed purple line which is the EQ of the large 2018 TR. Price has also, so far, remained in the top half of the large ascending channel. More recently, this morning's swing low printed the bottom of what appears to be a local ascending channel. Getting above the pivot puts price above that short ascending channel's EQ, as well as the blue TR's EQ and the red S/R flip. The 1H RSI and Stoch RSI resets lend support to this possible upward trajectory toward the 1H R1 pivot. A breakdown below the $7900 demand zone should indicate that price will, instead, continue correcting toward the $6000 level.
The daily chart reminds us that price is ranging between demand and supply zones. The May 30th dip bounced off the demand zone's EQ and the current daily candle is possibly printing a higher low by bouncing off the top of the demand zone/black TR resistance/2018 TR EQ. The 3D chart shows price consolidating ON TOP of the 2018 TR EQ over the past 9 days which would seem to be more bullish than bearish and could lead to a significant pop. The weekly candle is a bit more indecisive, printing what appears to be a northern doji with price closing the week a mere $1 above where it opened. While often touted as a bearish reversal pattern by amateur traders, the reality is that the breakout direction is random at best (about 50/50), so traders should consider it a pause. The fact that it occurred on top of a demand zone seems to suggest upward price continuation. Of course there are no guarantees and all we can do is look at the data and attempt to extract a higher probability course of action. Overall weekly demand volume has also continued to rise during this, what I believe is, wave 3.
Every day, we have a choice to act positively or negatively, so if you get a chance, do something decent for someone today which could be as simple as sharing a nice word with them. You just might change their day, or even their life.
You can always click on the "share" button in the lower right hand of the screen, under the chart, and then click on "Make it mine" from the popup menu in order to get a live version of the chart that you can explore on your own.

BTCUSD 4H chart (5/31/2019)Good morning traders. Price had a minor setback yesterday. After popping up $360 to a high of $9096.79, just $100 shy of the immediate 4H R1 pivot target, price dropped down and bounced off $8000. However, it did hit the TR target (height of the TR added to the point of breakout) and then some. This is exactly why I have been warning traders to consider not trading in this area. The lack of liquidity as a result of cyclical accumulation that occurred last year, as well as price nearing the end of its bullish run, makes volatility like this a strong reality and most retail traders don't have a clue how to trade it. I have talked time and again about locking in shorter term profits if a trader insists on entering and trading this range. Lord knows I am constantly preaching risk management. Yet, even with all of this, I still get the idiotic comments about "newbs are rekt because of you." Make sure you understand, if you are getting rekt in a financial market it is absolutely nobody else's fault but your own unless they are trading for you. Furthermore, if you choose to ignore the warnings about market conditions in this area and risk management that I have provided, as mentioned above, then you truly have no leg to stand on. I am never rude, but I am direct and trading requires that you take responsibility for your actions (it's part of being an adult). It's absolutely ridiculous that I need to speak to adults about taking responsibility for their own actions. Consider this your reality check. So, now that I've gotten that out of the way...
In the grand scheme of things, in spite of the whole of cryptotwitter turning mega bearish yesterday, all that really happened was that price returned to previous resistance and tested it as support while bouncing out of the demand zone in blue as the daily bearish divergence I mentioned was printing played out. Furthermore, we can see that it took supply more effort and produced less result to get there than the large demand candle leaving the blue zone on May 26th. Large, sudden drops like that are often initiated by professional traders attempting to scare retail into selling them their assets. Guess what? It worked. Nothing that has happened gives me reason to believe we will be dropping below $8000 at this time. Now that can change as new information comes in (i.e. price action and volume changes) but it seems more likely than not that price will return to the previous swing high and continue its trek toward $10,000. Interestingly, you may remember that I spoke recently about a possible push to $10,000 followed by a sudden drop toward $8500/$9000 and then a push through the $10,000 level -- basically, what we just saw happen yesterday. It is possible that this grab for liquidity and scooping up of retail's weakly-held assets was that move, just $1000 lower.
For now, my immediate target is $8700. This will bring price right back to midrange of the shorter TF blue TR that price fell out of yesterday. Reclaiming that level will have price back above the 21 EMA and should have it targeting the top of the TR at $8939, followed by the swing high at $9096, and then the higher targets through $10,000 that I have mentioned previously. The 4H RSI is slightly bearish at 45, but is curled up suggesting increased demand momentum. The 4H Stoch RSI has recently bounced off the bottom and crossed bullishly while still in oversold. This suggests that demand strength is just starting to build which should lead to the higher prices mentioned above.
Contrary to what cryptotwitter says, this type of analysis doesn't make me a permabull, rather it is just a reading of the market. I reitterate, what happened yesterday was just a blip in the slightly larger picture. However, most retail traders will feel differently because they are not looking at the bigger picture, they aren't practicing intelligent risk management, and they have little-to-no understanding of what's even going on in the market. The market is not bearish and a correction in a bull market is not bearish. The sooner you can learn to leave the words "bull" and "bear" out of your thoughts and usage, the sooner you can become less emotional in the market. The use of emotional language necessarily leads to increasing emotional response. Trading is a psychological game of composure and those with the least emotional attachment to it are the ones most well-positioned to win at the end.
Every day, we have a choice to act positively or negatively, so if you get a chance, do something decent for someone today which could be as simple as sharing a nice word with them. You just might change their day, or even their life.
You can always click on the "share" button in the lower right hand of the screen, under the chart, and then click on "Make it mine" from the popup menu in order to get a live version of the chart that you can explore on your own.

BTCUSD 4H chart (5/30/2019)Good morning traders. While the rest of cryptotwitter is freaking out and yelling that the sky is falling, you're paying attention to what's really going on, right? The 4H chart shows that price printed a Spring and a Test recently within the red descending, broadening wedge. This pattern took price just beyond the original channel that I had pointed out, which is fine. The 4H 21 EMA continues to support price as the latter prints higher lows toward the resistance at $8770. The ascending wedge that has resulted at the end of the descending broadening wedge is expected to result in a pop toward the R1 pivot at least. That would take price to the $9200 level. This target aligns with the local TR target. The flagpole leading up to this flag continues to have a target of $9750/$9800 which gets price just above the R2 pivot.
As I have been mentioning, that $9800-$10,000 level is my initial conservative price top expectation, with the latter end of it being the general level of the large ascending triangle target from the two week May consolidation. If we consider that the large ascending triangle may have, in fact, been a pennant (which is where I'm leaning at this time and I outlined it in red for you), then the height of the flagpole leads to a target of $11,450 which is also just above the R4 pivot at $11,400. However, I am not ruling out a possible push higher either before a correction of this first wave set.
If you've been following me, then you know that our inability to draw a parallel line from wave 2 to what I have been considering as a possibility of being wave 4, without cutting out various candles, is troubling me. More importantly, so is the fact that wave 2 was 1.5 months long while wave 4 was only a couple of days. This continues to have me considering the idea that we are only completing wave 3 at this time. So the targets discussed above would result in a wave 4 retracement of about a month, before completing wave 5.
In terms of the 2018 accumulation TR, the higher target of this wave 3 would have price targeting anywhere from just under the top of the TR ($11,780 on Bitstamp) to the 2018 large descending wedge target ($14,000-$14,500) which is what we should normally expect for the JAC (Jump Across the Creek) as price prints an SOS (Show of Strength). The monthly R1 pivot is around $12,900 as well. The retracement for wave 4 would then print the BUEC/LPS (Back-Up to the Edge of the Creek/Last Point of Support) and wave 5 would print another SOS. Wave 5 could then target the monthly R2 pivot around $22,000, or even a bit higher. This would allow the larger correction afterward to remain above the $10,000 level while still retreating 50%-61.8% as we would normally expect.
In all, this would give us a wave 4 correction from June-August with wave 5 possibly topping out at the end of the year, thereby fitting into our normally-expected cycle. But, remember, this is all highly speculative and is just meant to make you think beyond simple kneejerk emotional reactions. It combines Elliott Wave with Wyckoff and market cycles. But until it begins playing out, traders should remain cautious. I often hear arguments that cryptotwitter is too bullish so we have to correct. While derived from truisms, the fact is that most of cryptotwitter doesn't truly understand how to apply herd mentality to market action. So what they believe to be as "everyone is too bullish" doesn't translate into their expected movement (below $5000). Again, the bullishness can be corrected by a wave 4 retracement toward $8000 after a touch of $14,000 as well.
Every day, we have a choice to act positively or negatively, so if you get a chance, do something decent for someone today which could be as simple as sharing a nice word with them. You just might change their day, or even their life.
You can always click on the "share" button in the lower right hand of the screen, under the chart, and then click on "Make it mine" from the popup menu in order to get a live version of the chart that you can explore on your own.

BTCUSD 1H chart (5/29/2019)Good morning traders. Supply was too dominant so we did end up seeing that dip I suggested yesterday had a slight chance of happening. Price ultimately bounced off $8421, immediately above the D1 R4 pivot. This has printed bullish divergence on the 1H RSI as shown by the red arrows. Price should be good to go to the top of the local TR around $8930 before pulling back $100-$150 and then finally heading through the TR's resistance.
At this time, nothing has changed from what I wrote yesterday, except that the flag's target is a bit lower at $9750 now and the ascending blue channel target has risen just a bit. As always, the target will be dependent on when price breaks through the channel's resistance, but the longer it takes price to do so, the higher that target necessarily becomes as the channel advances. I did caution traders yesterday that there is no guarantee that price will reach that blue ascending channel target, rather price may just pop out to $9,750-$10,000 and print a bull trap before reversing. But if it does continue higher, then that target is the one I will be watching next. If price does push beyond $10,000, it will likely require a recount of the waves leading up to it from May 16th -- a shifting of the waves to the right -- which would mean we could be starting the 5th subwave of the 3rd subwave of wave 5, rather than the 5th subwave of wave 5.
In the near term, we are seeing price consolidating just below the TR support, along the 21 EMA on the 1H chart. This consolidation is printing a small flag with a target at the top of the local TR, as mentioned above. The 4H Stoch RSI is crossing bullishly in oversold after bouncing off the bottom and RSI is bullish at 58.7. I continue to believe that if we get the blow off top, then price will head higher than $10,000 in order to produce the FOMO required for such a move. Again, the expectation from cryptotwitter's armchair "analysts" is a reversal at that level, so we should expect that many people will be attempting to short, what they believe to be, the top. Price continuing higher would create real FOMO and trap those shorts thereby resulting in a blow off top. As discussed yesterday, we could also just see a general distribution TR develop, but for now I'm still looking at the blow off top as the more likely event.
Every day, we have a choice to act positively or negatively, so if you get a chance, do something decent for someone today which could be as simple as sharing a nice word with them. You just might change their day, or even their life.
You can always click on the "share" button in the lower right hand of the screen, under the chart, and then click on "Make it mine" from the popup menu in order to get a live version of the chart that you can explore on your own.

BTCUSD 1H chart (5/28/2019)Good morning traders. I am back from our Memorial Day Weekend holiday, here, in the U.S. and price has continued trending upward as suggested it was likely to do. We saw a breakout of the ascending triangle to a high of $8939 on Bitstamp, so far, just a couple of days ago. Since then price has been printing a flag which should have a target of just over $9850.
We can see that the 1H Stoch RSI is in oversold and RSI is slightly bearish at 46.5. There is a very slight chance that we could see price dip down toward $8335 (1H pivot) to $8415 (1D R4 pivot) first, but I doubt it will happen. Ultimately I expect this final move up toward $10,000 before we get our much needed, much larger correction. The daily RSI should print bearish divergence to confirm the reversal. The first bit of resistance on a break through the recent swing high should be the R1 pivot at $9200. In terms of the local 1H TR, price likely just printed a Spring and should be headed up with the R1 pivot possibly providing the SOS target before some more consolidation and further upward movement.
Generally, I am expecting price to hit the green box before beginning the large reversal. But will we get a blow off top or just a larger distribution TR? I have been expecting the former but am in no way sure of that at this time. That being said, most of cryptotwitter is assuming that price will reverse at $10,000, but a breakout of the blue channel may indicate a slightly higher target of ~$10,500-$10,700, based on the height of that channel. The 1H R5 pivot sits at $12,270, so I wouldn't be surprised to see price accelerating toward this area as the FOMO kicks in either. Price continuing toward this level would have the added benefit of liquidating those who short around $10,000 as well as causing FOMO as traders jump in long once more, afraid they are going to miss further upside, and then trapping them as price suddenly reverses. On the other hand, if a large TR forms around the $10,000-$11,000 area, traders should be extremely cautious and attempt to analyze the price action and volume. Again, my initial expectation would be distribution if a large TR forms. The only other thing I can really caution traders on, is to be aware of the blue channel's resistance. While most are now expecting $10,000, it is possible that price does not break the resistance and, instead, reverses from there.
Every day, we have a choice to act positively or negatively, so if you get a chance, do something decent for someone today which could be as simple as sharing a nice word with them. You just might change their day, or even their life.
You can always click on the "share" button in the lower right hand of the screen, under the chart, and then click on "Make it mine" from the popup menu in order to get a live version of the chart that you can explore on your own.

BTCUSD 4H chart (5/24/2019)Good morning traders. Price has been heading up as expected for another attempt at a higher high, however we still have heavy supply through $8400. As we can see, price is near the top of the HVNs. If price can get on top of these HVNs, then they should act as support. What is worth noting this time around is that the orderbooks are showing stronger nearby bids than asks for the first time.
We have been watching multiple possible patterns play out for a while now and at this time I am leaning toward the descending wedge and/or ascending triangle. This latter pattern is noted with the dashed red lines. It isn't an easy 3 or 5 wave count, but in either case for those patterns I expect to see price target the TR's resistance before dropping back a bit and then pushing through. As I have continued to do this past week or two, I have noted the possible targets as price moves: pattern targets in red, daily pivots in blue, and weekly pivots in green, as well as supply zones in grey.
Generally, I expect price to at least meet the TR target which, in this case, would have price reaching the EQ of the supply zone at around $10,000-$10,100. This price level seems to be the general consensus among cryptotwitter as well (or at least among those who believe price will rise a bit further), but it is most certainly not guaranteed. I remain cautious as we have not seen a blow off top, although price is moving parabolically. This means that we could actually see price push even higher than $10,000. If we get that kind of move, then traders need to be extremely cautious as price will suddenly turn and drop hard when top blows off, trapping and/or liquidating late FOMO longs. Levels of confluence among possible targets are of stronger interest to me than the targets sitting by themselves. If price is rejected at the top of the TR and then falls below the recent $7467.10 swing low, we may see this play out as a double top. Just remember that the double top pattern doesn't confirm until price closes below the swing low between the two peaks.
The 4H Stoch RSI is overbought at this time and appears to be rounding down, so we may see a bit of a pullback before price continues its advance. In that case, if price intends to continue higher, then I would expect the 21 EMA currently sitting at $7850 to ultimately provide support. The daily RSI is bullish at 66 and Stoch RSI remains oversold at this time, but is curling up, suggesting that we may see this final leg up that I have been expecting.
Every day, we have a choice to act positively or negatively, so if you get a chance, do something decent for someone today which could be as simple as sharing a nice word with them. You just might change their day, or even their life.
You can always click on the "share" button in the lower right hand of the screen, under the chart, and then click on "Make it mine" from the popup menu in order to get a live version of the chart that you can explore on your own.

BTCUSD 1H chart (5/23/2019)Good morning traders. Good ol' volatility showing up some more yesterday has returned price to the $7400/$7500 level, depending on which exchange you are looking at. Today, I am looking at Coinbase. The big points to remember are that there are multiple patterns we could be seeing playing out on the larger TFs, which I have discussed over the past week. These include the double top (for all you bearish traders out there) which will not be confirmed until price closes below the swing low between the two peaks, ascending triangle, pennant, flag, and now this descending wedge. The reality of what's going on is that price has continued to remain above the EQ of this very large trading range, so while most retail traders are freaking out and shorting because they are sure that price is headed below $6000, I am taking a much more measured approach to price action at this time.
The big tell for me, at the moment, is that the daily Stoch RSI is oversold. While it can remain oversold or overbought for extended periods, the few times it has happened in the past while daily RSI was overbought or just leaving overbought, price has continued up. The 4H Stoch RSI is also oversold. It is only these smaller TFs that are showing Stoch RSI at overbought. Price is currently attempting to exit the red descending wedge's resistance as shown with a target of $7870 based on the height of that wedge. This is within the larger black descending wedge which has a likely target of around $8600, based on the height of the wedge, depending on when price breaks through its resistance.
What I don't like about the current situation is that price has dropped through the pivot. Because of the sideways action, we may be able to assume that price is just consolidating around that pivot, but we need to see it push above the pivot resistance. Rejection at the pivot would likely indicate further downside. However, as mentioned above, the large patterns that may be printing make is most probable that price would not fall to $6000 or lower at this time. The red descending channel which is holding the large descending wedge shows price back above its EQ, which is bullish and should have traders expecting a return trip to the top of the channel. Before price can do that, it must get above the 21 EMA which is currently holding it in check. As you can see, from the 1H to the daily TF, we really have no definitive direction. It is supply and demand fighting it out. This is why I have continued to caution traders against trading in this range. Support levels to watch on Coinbase are the large TR EQ at $7425, red descending channel support, S1 pivot at $7070, and large TR support at $6600.
The CME Bitcoin Futures chart looks the most bullish as price pushed up through the 4H pivot, was rejected at the R1 pivot, and is now just retracing above the pivot. As far as the daily chart is concerned, price is bouncing off the R3 pivot after being rejected at the R4 pivot. Again, this is bullish. While futures volume has fallen off from its ATH on May 13th, today's volume is already almost equivalent to yesterday's and is showing demand in control first thing this morning. Follow through for the rest of the day could be quite bullish for the weekend. However, supply is showing heavy in the orderbooks around $7800, so traders beware. If price can get above $8000, the HVN should provide support once more.
Every day, we have a choice to act positively or negatively, so if you get a chance, do something decent for someone today which could be as simple as sharing a nice word with them. You just might change their day, or even their life.
You can always click on the "share" button in the lower right hand of the screen, under the chart, and then click on "Make it mine" from the popup menu in order to get a live version of the chart that you can explore on your own.

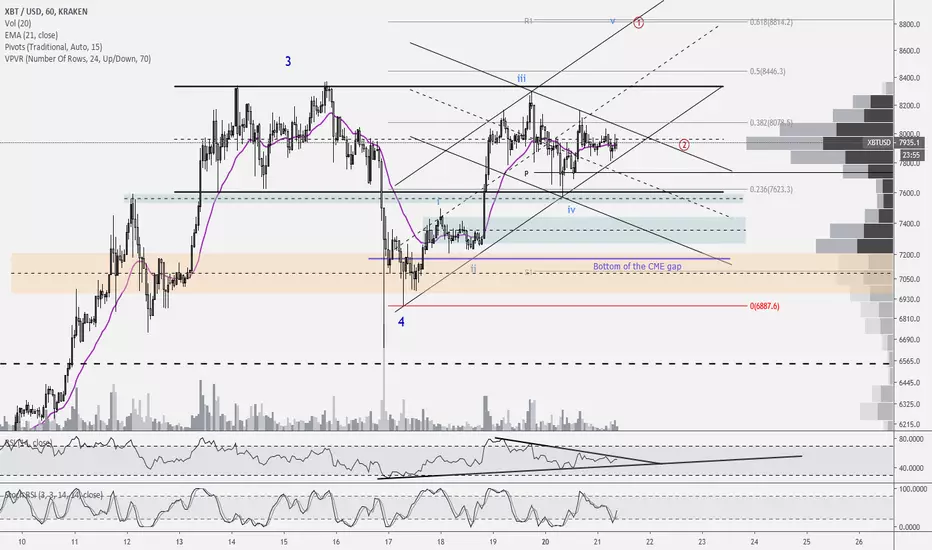
BTCUSD 1H chart (5/21/2019)Good morning traders. Yesterday's chart has been hidden by Tradingview because I inadvertently mentioned other social media sites that I am on. So we will be using the same chart today. Overall, price remains in the TR it began printing on May 13th. Price's current location appears to be printing a diamond. Often diamond tops result in reversals, but not always. Whichever direction price moves, traders can usually expect that the ascending resistance, or descending support, lines will keep price in check.
If it does break down through support, then traders should watch for a possible pullback at the demand zone/bottom of the TR around $7600. Price continuing through that area sets up the possibility of price filling the CME gap fully. However, this does not mean that price is headed to $5000. On the contrary, my expectation would be for price to bounce off the S1 pivot and head back up while continuing to print an ascending triangle. If price drops into the lower demand zone around $7400, this would invalidate my light blue wave count but would still keep the dark blue wave 4 intact. If price breaks up, then I would expect it to be a short-liquidating push up and target the R1 pivot. Can price head higher in this scenario? Sure it can, especially because I expect that a lot of people are short in this area. With that in mind, although we usually expect price to be kept in check by the resistance line, it is possible that price could surge through that ascending channel's resistance.
For now, the 1H RSI is neutral with support and resistance lines noted. A close below support or above resistance on the 1H TF should indicate that price will continue in that direction. The 21 EMA and HVN are supporting currently supporting price. Stoch RSI just bounce out of oversold which means it has room to drop just a bit. The 4H RSI remains slightly bullish, but is sitting on its support. Stoch RSI on that TF is just now dipping into oversold. Daily RSI is bullish at 67 and the Stoch RSI is just now attempting to bounce out of oversold. With all of this in mind, I wouldn't be surprised to see price break to the downside, but I do believe that it would be limited in duration due to Stoch RSI being so close to bottoming out on all those TFs and RSI being neutral to bullish. Daily R3 pivot is at $7520. The orange zone indicates the daily demand zone which, again, I expect to ultimately support price on any attempted drop.
While it does appear that we could be seeing a double top possibly forming over the past week, I'm hesitant right now to see the follow through since the various exchanges have significant differences in their May 16th swing low. The double top would not be confirmed until price closes below that swing low, so it would confirm on Binance first and Bitstamp last, with almost $1000 difference in pricing. More importantly, the target of the double top is the height of the swing high to swing low subtracted from the swing low. So not only would Bitstamp have to wait almost $1000 more to just confirm the double top, but then it would also have a $1000 lower target. Binance would be hitting its double top target just around the time Bitstamp confirms its own double top. The price target variance is just too large for me to give much consideration to a possible double top pattern at this time.
Remember, Wave 2 was 1.5 months in duration and I have been saying since then that I expected Wave 4 to be at least 2 weeks long, but potentially up to 4 weeks. We are just over a week into Wave 4 at this time. While a sudden thrust through the resistance found at the $8000-$8300 level would have price exiting Wave 4 earlier than expected, with the volatility we have seen, I wouldn't be overly surprised. With all this being said, I remain long from ~$6830.
Every day, we have a choice to act positively or negatively, so if you get a chance, do something decent for someone today which could be as simple as sharing a nice word with them. You just might change their day, or even their life.
Remember, you can always click on the "share" button in the lower right hand of the screen, under the chart, and then click on "Make it mine" from the popup menu in order to get a live version of the chart that you can explore on your own.
BTCUSD 15 minute chart (5/16/2019)Good morning traders. Last night saw price drop almost $700 (or just under 10%) which has traders scared of further downward movement. However, looking at the 15 minute chart, we can see that volume was lackluster at best. In other words, we should've seen a lot greater volume on that drop if supply was in control. Instead, we see supply volume has continued to contract throughout this entire consolidation/sideways movement while demand volume has expanded. Furthermore, the demand volume that showed up at the bottom of the drop is significant (2x what the supply volume was), indicating that demand is in control.
As we can see, bullish divergence printed on RSI recently so we should expect price to head up rather than down. But this is a short TF, so I will be watching for confirmation in the form of price moving above the descending wedge's resistance. This will also take price above the 21 EMA and back above the S1 pivot. A close above the pivot at $8115 is bullish and would have price above the HVN once again. Overall, price has just continued to consolidate around the monthly pivot denoted by the green horizontal line while printing higher lows and highs.
Many people have asked about the huge drop in Bitfinex shorts but lack of volume on the exchange. The most likely answer is that the individual settled their position, or "claimed" it as it is known on Bitfinex (support.bitfinex.com). From the FAQ: ....Claiming a position is essentially converting from a margin trade into an exchange trade; closing the position by buying it yourself and settling your funding costs to the lender. Because of this, there is no trade activity on the order book. Claiming your position does not involve trading." This is a bullish signal to me as it suggests that the individual is looking for price to go higher, so I am expecting another move to the upside.
A close above the ascending triangle that appears to be printing would create a target of ~$9240 based on the height of the triangle. This gets price to my original target which is a good sign. However, if price does reach this point that doesn't mean it has to stop there, just that it is the target based on this pattern. Taking the height of the possible flagpole leading up to it would give us a target of ~$9900. This looks more possible based on Binance's BTC/USDT, for example, because it appears that a symmetrical triangle/pennant is printing there, so it's good to keep in mind. Either way, it's never a bad thing to lock in profit, especially in volatile areas like we are now. As an aside, the drop overnight has found support so far on the 4H 21 EMA and R1 pivot. This, again, would suggest that price is headed higher rather than lower for now. As always, risk management and confirmations should be strongly adhered to if traders intend to enter, whether long or short.
Every day, we have a choice to act positively or negatively, so if you get a chance, do something decent for someone today which could be as simple as sharing a nice word with them. You just might change their day, or even their life.
Remember, you can always click on the "share" button in the lower right hand of the screen, under the chart, and then click on "Make it mine" from the popup menu in order to get a live version of the chart that you can explore on your own.

BTCUSD 1D chart (5/15/2019)Good morning traders. Price continues to range sideways and, as it does, I am seeing and ever-growing list of "It's going to make a new low now," "The bear market isn't over yet," and "The bull market will begin, but not yet" arguments. Most retail traders are still in disbelief at the price advance for the past 5 months. Price must absolutely go way back down again, they say. This is in spite of all the indicators stating otherwise, not the least of which is price action and volume.
For those looking to milk some profits out of a final move up, this sideways movement can be frustrating and stressful. For those looking to scalp, however, this has provided the perfect trading environment. We've had several Discord members taking advantage of the scalping environment and raking in quite a bit of profit in the process. I continue to hold my long position, however. If it is frustrating you that price has moved sideways for a few days, just understand that we are sitting at the 1M pivot so the resistance shouldn't be a surprise. Will price continue higher into a blow off top? That remains my expectation at this time. If so, just how high can it go? We spent much of yesterday evening discussing technical possibilities in Discord.
The ~$8750-$9300/daily R5 pivot level is likely the safe bet, however zooming out to the 4H chart gives a possible wave count that takes price to ~$10,150-$10,350. Then of course there are other technical targets such as the H4 R4 pivot at $11,020, the top of the 2018 TR at $11,780, the H4 R5 pivot at $12,165, and 1M R1 pivot at $12,912. The corrective market fib levels are 61.8% at $9441.98, 50% at $11,394.14, 38.2% at $13,346.30, and 23.6% at $15,761.68. I would suggest that traders keep the monthly pivots and corrective market fib levels marked as significant areas of interest on their charts as price continues its move up through those levels, whenever it does finally happen.
The reality is that anyone who happens to get close to the top on this possible final move up will be more lucky than anything else, myself included, due to the parabolic advance and cyclical accumulation that took place. So locking in any profit along the way is a smart move. The more emotional, less experienced traders will likely attempt to ride it up as high as possible and then be unable to convince themselves to exit when price reverses. Do not be that person. With volatility back in town, there will be a plethora of opportunities for much less risky trades in this market. As a trader, your job is to limit your risk, so you can start looking for upcoming opportunities in other cryptocurrencies. We have posted numerous alt trading opportunities in Discord recently for traders to watch as Bitcoin finishes up, and you should be keeping track of alts as well. We continue to expect alts to make good moves when Bitcoin enters its pullback.
Currently, we see price finding resistance, and consolidating, at the 2018 TR EQ. It is possible that this consolidation is printing a pennant, but I wouldn't be surprised to see the reversal form here as well due to the 2018 TR EQ. We can see the parabolic advance noted on this daily chart but no large upper wick. Must it have this wick? No, but this is currently what I'm looking for to mark the blow off top and is why I believe we may still have some upside left in this movement. That being said, I'm also watching the current TR on the 1H and 4H TFs for signs of excessive weakness, in which case I would likely exit my position in anticipation of the reversal. Ultimately, price falling through the purple arc would be the signal that the parabolic movement is over. The noted demand zones in blue and grey are the support levels, as well as the TR at the pivot. Stoch RSI is crossing bullishly but we have a lot of hours left in this daily candle to change that.
Every day, we have a choice to act positively or negatively, so if you get a chance, do something decent for someone today which could be as simple as sharing a nice word with them. You just might change their day, or even their life.
Remember, you can always click on the "share" button in the lower right hand of the screen, under the chart, and then click on "Make it mine" from the popup menu in order to get a live version of the chart that you can explore on your own.

BTCUSD 1H chart (5/15/2019)Good morning traders. "Journalists" and "analysts" have littered social media lately with "explanations" of why price has reached the level it has, most often justifying it as a result of Fidelity, AmeriTrade, and Baakt entering the market. The reality is that price is exactly where I said it would be in January/February, long before all this news even hinted at coming out. As a matter of fact, at that time Baakt actually postponed its launch. As I have continued to state for the past year and a half, the news is already in the charts. Most traders just don't see the movement until it happens.
At this point, price is just grinding its way toward, what I believe will be, the blow off top. I remain long, holding for the $9000 level. If this final subwave count plays out as we generally expect the average wave set to do, then we should see price topping out around $9300. In terms of parabolic price action, Base 3 is around $4650. Since we generally expect price to double from Base 3, this would give us an expected target in the area of $9300 as well. If this final wave count prints an ending diagonal, then we should expect a shorter target as the waves will overlap each other. In that case, price is more likely to complete in the orange box between the R2 pivot and the green box ($8725-$9180). Please keep in mind, volume is low and the order books are thin as this is the final bit of the upward movement so price could always surge higher or stop just short of the targets. Attempting to trade this very last bit of movement most often causes traders to lose money so don't be afraid to take some profit and wait for the retracement.
As I've mentioned, I believe the initial retracement will be sharp and potentially bounce at the $7000-$7400 level, toward $8100, before falling further. This would complete the blow off top. So traders can attempt to short the drop but, as always, it's risky as you may not be able to log into your exchange due to server overload as other traders attempt to log in and short it as well. I have been looking for a bottom in the $6000s but have mentioned the possibility of heading a bit lower as well. Ultimately, I wouldn't expect price to drop below Base 3 between $4600 and $5600. My expectation would be for price to bounce in the $5300-$5600 range if it does get to that level and then consolidate in the $6000s before heading up once again. This drop and consolidation should likely take around 3-4 weeks during which time I expect that alts will have a bit of a party.
Every day, we have a choice to act positively or negatively, so if you get a chance, do something decent for someone today which could be as simple as sharing a nice word with them. You just might change their day, or even their life.
Remember, you can always click on the "share" button in the lower right hand of the screen, under the chart, and then click on "Make it mine" from the popup menu in order to get a live version of the chart that you can explore on your own.

BTCUSD 1H chart (5/10/2019)Good morning traders. Price printed a new 2019 high of $6336.93 in the past 24 hours. The more bearish among us continue to watch on in disbelief and reload shorts each time they're liquidated. The Bitfinex premium, which was recently almost $400, has now dipped to $120 while price has continued to rise. The Bitfinex Shorts/Long ratio remains at its highest levels ever. Overnight, price found resistance at the daily R2 pivot which had price hitting our target from May 8th. Among other more recent trading notations, I mentioned that as we were nearing the R1 pivot we would likely cross it, return to test it as support, and then target the R2 pivot. This is exactly what has happened. Price, during this time, has become increasingly parabolic which has me waiting for the final strong thrust up -- the last move before this leg is completed. I am not sure if we will get it, but even if we don't, I will stop out in fantastic profit.
I still believe, especially now that we've made it to $6300, that the most reasonable course of action is to see price shoot up toward the upper $6000s to complete that parabolic move, and then consolidate in the $6000s for wave 4 before completing wave 5. So I am currently holding for the $6800 level, but have no problem exiting around $6500 if price action dictates that I should. If we can get wave 5 to end around the weekly/monthly pivot at ~$8000 then we can potentially see price returning to $4900/$5000 before starting its next large leg up. I am torn, however, as $6000 seems more likely to support price since it held as the floor throughout 2018. But because that lower possibility is there, I want to be sure you note it. In either case, it should be an easy short.
This 1H chart shows price's current consolidation TR. Price has basically continued to trade in the upper half of the range which is generally considered bullish. That doesn't mean we can't see a Spring into the lower demand at $6160, but that is all that I would currently expect if price does drop lower. If it does happen to extend lower, then traders should be watching the demand noted at $6056 and $5890. For right now, a break through the top of the local horizontal TR should have price targeting the top of the ascending channel and a push through the channel's resistance should bring the ~$6800 target into play. I am watching for price to leave the descending red channel's resistance as an indication that price is likely ready to move up. The 1H Stoch RSI is oversold at this time suggesting a move up could come sooner (today) rather than later (tomorrow).
Every day, we have a choice to act positively or negatively, so if you get a chance, do something decent for someone today which could be as simple as sharing a nice word with them. You just might change their day, or even their life.
Remember, you can always click on the "share" button in the lower right hand of the screen, under the chart, and then click on "Make it mine" from the popup menu in order to get a live version of the chart that you can explore on your own.

BTCUSD 1D chart (5/9/2019)Good morning traders. Price continues to move as expected, notching a new 2019 high at $6099 on Bitstamp last night. I am zooming out to the 1D chart today to give my thoughts. I don't really have much to add to what I've been saying for the past 4 months, but I would like to reiterate what I'm thinking.
Not too long ago I discussed this parabolic "pop" as a growing possibility (dotted purple curve). I have added in wave counts to let you know what I'm looking at from this larger TF. As you can see, I do believe we are in the fifth subwave of wave 3. However, where it ends remains a question. My belief, at this time, is that we will see it end between $6800 and the daily R3 pivot at $7475. Which level depends on how hard this next push is (should be subwave 3 of subwave 5 of wave 3). As always, I'll outline my thoughts with fibs, etc. during this morning's video update.
Everybody else thought that price would get rejected hard at $6000 yet we see price consolidating on top of it, much like what we saw at $5600. This suggests another good push up which aligns with my thoughts. A parabolic move like we are seeing should result in a blow-off top at the end of wave 5. My current wave 5 target (blue line) is based on the wave 3 target shown and happens to be the weekly pivot. However, if wave 3 targets the R3 pivot instead, then the wave 5 target becomes the red line around $10,000. Retail traders continue to remain in disbelief at this year's rally and are ignoring the accumulation that occurred as well as the FOMO that will continue to flood in as price rises above $6000, making these targets more and more likely. However, this does not guarantee that we will reach them. At this point, there are many variables which makes it hard to pinpoint a really likely scenario. So, risk management remains the name of the game, folks.
A breakdown from the recent high would likely see price retracing toward the $4350-$5000 level. That is the 61.8%-78.6% extension area. We would have to see how price moves at the beginning of that breakdown to figure out which is the most likely retracement target. My initial soft target for wave 3 remains the $6300-$6500 level, with an increasing likelihood that we will see it tap that $6800 level. But I will be watching price action and volume because the more this plays out as it has been, the more likely those higher targets of ~$6800 and ~$7400 are becoming. Looking at the pivots and price action, we would normally expect price to blow off around the R5 pivot as it is, which only gives more credence toward those higher wave 5 targets. If wave 5 targets $8000, then we would expect a retracement toward $4900-$5600 which is the sideways movement during April. If wave 5 targets $10,000 then we would expect a retracement toward $5800-$6600. In either case, the expected larger wave 2 retracement would find support at key levels before beginning the larger wave 3.
Every day, we have a choice to act positively or negatively, so if you get a chance, do something decent for someone today which could be as simple as sharing a nice word with them. You just might change their day, or even their life.
Remember, you can always click on the "share" button in the lower right hand of the screen, under the chart, and then click on "Make it mine" from the popup menu in order to get a live version of the chart that you can explore on your own.

BTCUSD 1H chart (5/8/2019)Good morning traders. I hope my continued insistence on risk management over everything else has gotten through to everyone. Yesterday's surprise news -- the Binance "hack" -- was a good example of the importance of risk management. Price dropped just over $200, as a result of the news, which liquidated many traders. The positive side to this is that Binance will cover the lost funds so traders didn't really lose anything. Normally, we would've expected to see a $1000 drop due to the news yet we only saw a third of that, and this morning we have already seen price recover all but $25 so far.
During the drop, in our Discord last night, I mentioned that I wouldn't be surprised to see price rise back up and even make new 2019 highs pretty quickly. Why? Because accumulation has been occurring for quite a while which should mean that there isn't a lot of loose asset in the market. If much of the asset is in professional hands due to cyclical accumulation, then retail doesn't have the supply to cause price to drop significantly and stay down when they sell emotionally based on the Binance news. If this is the case, then the most likely result is that the professionals should be scooping up the retail selling. And here we are this morning, with a high that is just a few dollars off the price level when the news broke. Personally, I went long at $5772. I attempted to enter at $5720, after the 15 minute candle closed and confirmed a likely bounce, but couldn't get the order confirmed with the exchange until the higher price due to the overloaded servers. So I remain long toward my upper targets that I have mentioned numerous times in previous analysis.
The 1H chart shows a great reversal candle at the bottom of the drop. We can see that price ultimately bounced at the EQ of the May 3rd TR with the candle body being supported by the HVN at $5750. Note that the volume associated with this reversal candle was greater than the volume associated with the supply candle prior to it (demand is stronger than supply). But even that supply candle's volume was less than the volume of the similar $200 supply candle earlier that morning. This tells us that there isn't as much interest in selling at these lower prices which generally means that price is ready to continue moving higher. I have relabeled the recent price action to better fit the activity seen last night. Price is now back above the 21 EMA and the top of the May 3rd TR, and has reclaimed the ascending red channel's EQ, which is bullish. It should also be noted that the move down also helped price possibly play out the 4H bearish divergence that was printing. If price can close above $5910, then I believe we will be seeing $6000 much sooner than later. I continue to watch for a close above the swing high at $5970.
Every day, we have a choice to act positively or negatively, so if you get a chance, do something decent for someone today which could be as simple as sharing a nice word with them. You just might change their day, or even their life.
Remember, you can always click on the "share" button in the lower right hand of the screen, under the chart, and then click on "Make it mine" from the popup menu in order to get a live version of the chart that you can explore on your own.

BTCUSD 1H chart (5/7/2019)Good morning traders. Bitcoin price reached $5970 yesterday evening and, in typical retail trader fashion, now people are starting to think about entering. Unless you have a lot of experience and understand/employ strong risk management, it makes little sense to enter right now just as price is entering overheard resistance. There's too much risk associated with price suddenly dropping due to the resistance. While I do believe we have some further upward momentum coming, it is not guaranteed by any means. One of the most basic trading axioms is to never short support or long resistance -- traders should always wait for a break and confirmation of directional continuation. If price continues upward, as I expect, then we will likely see news reports about it thereby encouraging new retail money to enter the market and that leads us to the "theory."
There is a theory making its rounds through social media stating that professionals accumulated at $3100 and are going to sell it at $6000-$6500 after news hits the wires that price overcome $6K, because there will be a flood of new money to buy all that distribution. First, accumulation most likely appears to have occurred around $6000 and $3100 (after the hypodermic distribution, it's actually most likely that price entered, specifically, an accumulation with weakness phase where we see lower lows and highs as accumulation occurs in the form of a descending wedge). If that's the case, then there won't be a significant dumping at the $6000 level. Second, even if all the accumulation happened at $3100, the idea of major cycle accumulation is to hold, not sell it at 100%. As such, the professionals wouldn't be selling everything for a measly 100% profit. The nearest version of truth to this theory would be that price will make much lower new lows (think: sub-$2000). In that case, the strong accumulation that the theory states took place at $3100 wouldn't be true because professionals wouldn't be accumulating that heavily for just a 100% possible profit. There is a fundamental lack of understanding of market cycles and accumulation/distribution phases that runs rampant on cryptotwitter and tradingview. Continue following it at your own peril.
So what are we seeing at the moment? The 1H chart shows price printing a local TR/flag at the ascending channel's resistance. We want to see a close above last night's $5970 swing high now. If we can get that then, based on the height of the red ascending channel, price should be targeting the $6265 level, just under the R2 pivot (which is also just a couple of hundred dollars below the top of the large ascending channel.
With shorts continuing to build, at what point do you think people will stop shorting and start longing? Such a move has the potential to pop price significantly upward and establish the $6000 level as support, lower price never to be seen again. Until that close above the swing high, though, this could just be a bull trap above channel resistance. The 1H 21 EMA appears to be continuing to provide support and the current candle looks like a liquidity-generating Terminal Shakeout, but we will need to see how the candle closes.
For now, we should expect the HVNs at $5765-$5685 to provide support. Below that, we should be watching $5590 for support. If we don't see upward continuation today, then we may confirm the 4H bearish divergence that's printing. For now, I'm still expecting the November 18th supply/demand flip to ultimately provide support. So far, we are seeing strong demand devouring the incoming supply as this drop retested the larger, May 3rd, TR as support. This is likely printing a BUEC/LPS before the next move up. It's my belief that traders are concentrating on the very short TFs right now, rather than zooming out to the bigger picture and, as a result, will provide fuel to any upward movement from here as they continue to get shaken out by the lower TF noise.
Every day, we have a choice to act positively or negatively, so if you get a chance, do something decent for someone today which could be as simple as sharing a nice word with them. You just might change their day, or even their life.
Remember, you can always click on the "share" button in the lower right hand of the screen, under the chart, and then click on "Make it mine" from the popup menu in order to get a live version of the chart that you can explore on your own.

BTCUSD 4H/1H charts (5/6/2019)Good morning traders. We had a great weekly close and, so far, have seen the previous supply zone flip to demand and support price as I mentioned was most likely to happen. Price has continued to consolidate between the top of the demand zone and the top of the ascending channel, but upward overall. However, we need to see some more significant price appreciation sooner rather than later as too much time spent sitting in this zone will lead to a drop in price once the demand is taken out by supply pressure. The 4H chart printed a bullish engulfing candle with Stoch RSI bottomed out and crossing bullishly while RSI remains bullish at 52.6. Price is attempting to close above the 21 EMA as well as it sits just above the pivot.
While the 4H may look a bit ominous over the past three days (possible very narrow double top printing with a close below the purple line at $5510 confirming it), the 1H shows price currently printing a descending broadening wedge within a minor ascending channel within the greater 4H ascending channel. A breakdown of the minor ascending channel today or tomorrow would likely have price targeting the S1 pivot around $5240 to the ascending channel support just below it which would fill in the lower gaps. I will be watching for the 1H RSI to break through its descending resistance to suggest stronger upward momentum on the shorter TF. This should coincide with the 4H RSI doing the same, which would then give me reason to believe more significant upward momentum is on the way.
I do have some concerns. There are 1H gaps below price at $5514.53 and $5180.91, with the latter situated near the EQ of the demand zone. This doesn't mean that price must fill those gaps right now, but the longer price just "hangs out" at its current level the more likely they will be filled before further upward progression. There is also a gap above price at $5714.40. For now, price does appear ready to continue its journey upward toward the targets mentioned in my previous analysis. Will price surge through the resistance of the various ascending channels to reach those higher targets or will it just continue to move up a bit, consolidate, and move up some more? We will see, but the channels do give us an idea of the levels to watch along the way, especially where they find confluence with other resistance levels and/or targets.
Every day, we have a choice to act positively or negatively, so if you get a chance, do something decent for someone today which could be as simple as sharing a nice word with them. You just might change their day, or even their life.
Remember, you can always click on the "share" button in the lower right hand of the screen, under the chart, and then click on "Make it mine" from the popup menu in order to get a live version of the chart that you can explore on your own.

BTCUSD 1D chart (5/3/2019)Good morning traders. Price has now hit the three pattern targets and moved above the November 18th swing high. BTCUSD Shorts and Longs, both, dropped on the overnight move up but Longs have already started to recover this morning. I mentioned that Shorts were printing a daily bearish divergence and it seems to be playing out at this time. Daily Longs remain just above oversold and Stoch RSI is just now trying to push out of oversold. The Bitstamp and CME gaps have been filled at this point and the sideways movement through April appears to be re-accumulation with uprise as I have mentioned before.
Having now moved through the November supply zone, it is most reasonable to assume that it will provide support having flipped to demand. Spot order books show significant visible supply overhead through $6000, with most flashing at $5900-$6000. However, if price takes off upward then the likelihood of much of the orders being pulled is increased substantially as traders attempt to wring every last dollar of profit they can. The chart shows no real interest on the 12H chart until $6040, with the HVN at ~$6300 looking like a rejection point. Price is currently butting against the 2018 low prior to the drop through $6000.
The ascending red support line, on the 12H and smaller TFs, denotes a possible bottom to an ascending triangle with the November supply being the triangle resistance. The target based on the height of the triangle is the EQ of the next supply zone around the R2 daily pivot at $6460-$6550. This would put price around the 300% extension of Wave 1. We can see that daily RSI is just pushing through its descending resistance which should indicate further price advancement. Daily Stoch RSI is bullish at 56 with room to run as well.
Exiting anywhere between here and $6550 would not be shameful at this point. There is a lot of supply above which means price can be rejected at any point, and locking in profits in an area of no real confidence is never a bad move. I remain long at this time, looking at that $6460-$6550 target but have no problem exiting prior to that if the chart gives me reason to do so. It still seems most reasonable that price will top out between $6250 and $6550.
Every day, we have a choice to act positively or negatively, so if you get a chance, do something decent for someone today which could be as simple as sharing a nice word with them. You just might change their day, or even their life.
Remember, you can always click on the "share" button in the lower right hand of the screen, under the chart, and then click on "Make it mine" from the popup menu in order to get a live version of the chart that you can explore on your own.

BTCUSD 1H chart (5/2/2019)Good morning traders. Price continues to grind higher as expected with short sellers rigorously defending their positions above $5400 and $5600 but demand remaining relentless. As a result, price has now pushed through the blue TR's resistance. Having hit our first target, multiple targets still remain based on the patterns formed over the past week or so. The next target at $5435 is based on the ascending triangle and allows price to fill in the Bitstamp 1H gap at $5392.75 that was left as price dropped after the Tether news. But don't get too excited about shorting there as the CME Bitcoin futures gap remains at $5500 with the CME price tracking Bitstamp's price almost exactly. Would it be wise to short there?
Here's the thing, price hitting $5500 necessarily puts recent short sellers under water. With Bitfinex Shorts showing bearish divergence in highly overbought territory (with Stoch RSI recently topped out) and Bitfinex Longs just now leaving oversold (with Stoch RSI recently bottomed out) a sudden price move toward $5500 has a good chance of initiating a local short squeeze. But, as mentioned before, this would likely push price into the $5600s which would most likely begin a much larger short squeeze of November 2018 short positions. Shorts they have reached their double bottom target and Longs are printing a descending wedge of which they are recently bouncing off the bottom.
A quick look at this 1H chart shows us that price is currently finding support on the TR's resistance but it is also nearing the ascending channel's support. If that support fails to hold, then we could potentially see price targeting $5200/$5220 at the top of the demand zone. However, I would expect to see a bounce from there. If the support holds, then we should expect to see price target the top of the ascending channel which gets it to that $5500 level at the EQ of the November supply as well as just above the R2 pivot. This continues to seem like the most likely move, but traders who are entering in this area absolutely must have a good grasp of risk management otherwise they are gambling at best whether they are longing or shorting here.
Every day, we have a choice to act positively or negatively, so if you get a chance, do something decent for someone today which could be as simple as sharing a nice word with them. You just might change their day, or even their life.
Remember, you can always click on the "share" button in the lower right hand of the screen, under the chart, and then click on "Make it mine" from the popup menu in order to get a live version of the chart that you can explore on your own.

BTCUSD 4H chart (5/1/2019)Good morning traders. We saw a good daily candle print yesterday and are on our way to possibly confirming the checkmate pattern that I have been discussing. Ideally, I'd like to see another good daily candle close today, preferably at $5400 or higher. We had a good weekly close, keeping price within a narrow trading range and recovering the previous week's loses, but we had a great monthly close as well.
So far, we are seeing price take a bit of a breather after tagging the top of the month-long blue TR. In doing so, price has moved beyond our first target. The 4H RSI appears to be testing its previous ascending resistance as support while price tests the pivot as support. We continue to see demand showing up over the course of the past 6 hours as witnessed by the lower wicks on the current and previous candles. There is a strong defense of $5400 happening right now, most likely put on by those who shorted just above that level, but price continues to be bid up well. If price continues through $5400, then the defense at $5600 is the remaining wall. A convincing move through this latter level should see price easily pushing into $6000.
I would be concerned about failed upward progression if price falls below the demand at $5130. However, that doesn't mean that price necessarily must drop to $4000 and below from there. Rather, traders should pay attention to price action and volume as price approaches the bottom of the blue TR. Weak supply on a move down would suggest a possible Spring printing just below the TR followed by price moving back toward the top of that TR. As you are aware, I have been expecting May to be a retracement month, however it is possible we could see price spend most of the month moving sideways. I remain long at this time.
Every day, we have a choice to act positively or negatively, so if you get a chance, do something decent for someone today which could be as simple as sharing a nice word with them. You just might change their day, or even their life.
Remember, you can always click on the "share" button in the lower right hand of the screen, under the chart, and then click on "Make it mine" from the popup menu in order to get a live version of the chart that you can explore on your own.

BTCUSD 4H/1D charts (4/30/2019)Good morning, traders. It appears that we are getting some action this morning as price popped out of a few patterns and is testing the resistance of another. Tomorrow is the monthly close. This movement is not unexpected at all if you've been following my analysis. Price action and volume analysis across multiple TFs have suggested that this is the most likely movement, but can demand follow through? Price is now above the 21 EMA on the 4H chart once again, as well as being at the top of the HVN. It still remains a bit below the 4H pivot, though. So far, 4H RSI is trending within the ascending channel it printed. A fall through the channel support would most likely signal downward price progression. If the daily RSI pushes through its descending resistance, traders should be looking at higher targets.
There are four targets based on the patterns. The first is just above that pivot at $5265 and is based on the height of the red descending channel. The second is $5435 and will come into play once price exits through the purple ascending triangle's resistance. This second target is also at the ascending dotted channel's EQ. The third is $5660 and is based on the height of the red descending broadening wedge. This third target also puts price at the November 18th high which is important because continued movement above it sets into motion the possibility of liquidating the shorts initiated there at that time. The fourth target is at $5918 and is based on the height of the large blue TR, but will not activate until price closes above that upper blue horizontal line at the top of the TR. Will price make it to that fourth target and then be rejected, or will it continue toward $6300 and get rejected at the HVN? Nobody knows for sure, but the HVN argument makes a lot of sense. I have explained the higher targets over the past few weeks so feel free to look back through my previous analysis.
The possible checkmate pattern that I discussed yesterday should have price targeting the $5510 level, where it began, if it plays out. After the recent high almost taking out the whole of supply in that area, it doesn't seem likely that there will be enough supply there to suppress price if it gets to that level. The is a lot of defending of the $5200-$5300 level still happening suggesting that there are possibly some strongly over-leveraged shorts sitting just above. A sudden move above $5300 might just set them off causing a small squeeze toward the other cluster of shorts in the $5600 area which could lead to a much larger squeeze. However, the longer it takes price to get moving up that way, the less likely the squeeze becomes as traders start getting nervous and exiting their short positions.
Every day, we have a choice to act positively or negatively, so if you get a chance, do something decent for someone today which could be as simple as sharing a nice word with them. You just might change their day, or even their life.
Remember, you can always click on the "share" button in the lower right hand of the screen, under the chart, and then click on "Make it mine" from the popup menu in order to get a live version of the chart that you can explore on your own.

BTCUSD 4H chart (CME 4H chart also) 4/29/2019Good morning, traders. We have had a rather uneventful weekend which has been upsetting to many as the market has not provided direction. Tether Bitcoin pairs continue to print a premium over USD Bitcoin pairs. CME futures printed a gap at $5500 which will need to be filled, however this could come after price moves down first. Bitstamp has a 1H gap around $5400 as well. Price is not looking particularly strong at this time, however as price drops to $5100 the order books flash strong bids so we may be seeing retail selling into professional hands at that level. Currently, the daily candle has gapped down at $5161 so I expect that if we do drop it won't be long-lived. The recent weekly close printed a candle spread almost identical to the previous week's, just ending where that previous week began, and the weekly remains bullish at 55.5 at this time, though Stoch RSI is still overbought but finally falling.
We can see price has crossed above the EQ of the descending channel which is usually considered bullish. If price pushes through the channel's resistance then we should be expecting a target of $5800-$5900, depending on when it happens, based on the height of the channel. Price has remained on the topside of the TR as it continues to print higher lows overall. So the move up mentioned ultimately would result in a target between $5900 and $6000, based on the height of the TR. Of course this is all in addition to the older targets from larger patterns that we have previously discussed. In the near term, a close above $5206 should get the ball rolling on greater appreciation and would have price targeting the top of the ascending channel that it may current be printing, as well as have price exiting the descending channel and TR.
Everything else aside, the blue TR is the dominant pattern that traders should be watching. Secondary is the descending channel that price has been printing since the recent high. And third is the ascending channel within that descending channel. We have the monthly close tomorrow, so price may continue more sideways than anything else through that time. I have continued to mention that we are either at, or near, the top of this third wave and trying to trade this is often futile for most traders because they tend to hold for a big move and then get liquidated or scared off due to the noise before it happens. For most traders, this is not the time to be in a trade. It's best to wait for confirmation of this upward movement to be completed and then go long at the completion of the corrective wave 4.
My final thought is in regard to a short squeeze. There's a lot of talk about it due to the significant increase in shorts, their overbought level, and the strong shorts-to-long ratio, as well as the longs oversold level. Since short squeezes most often happen at support, we would need to consider the blue TR's EQ as support. But what else should have us considering that this may occur? We have printed three daily dojis after that strong drop. As a matter of fact, the daily chart, starting from the recent high, looks a lot like a checkmate pattern (can also see this on the 4H chart). The large candle's low at $4991.42 has not been reached since the initial drop last Thursday. Instead, price has been trapped in a narrow trading range of about $150 on top of the TR's EQ (i.e. support level). Confirmation of this pattern would be 1-2 strong bullish candles. The short squeeze wouldn't fully commence until around $5700, but the shorts that piled up just a few hundred dollars above the current price could be the fuel to get price to that level.
Every day, we have a choice to act positively or negatively, so if you get a chance, do something decent for someone today which could be as simple as sharing a nice word with them. You just might change their day, or even their life.
Remember, you can always click on the "share" button in the lower right hand of the screen, under the chart, and then click on "Make it mine" from the popup menu in order to get a live version of the chart that you can explore on your own.
