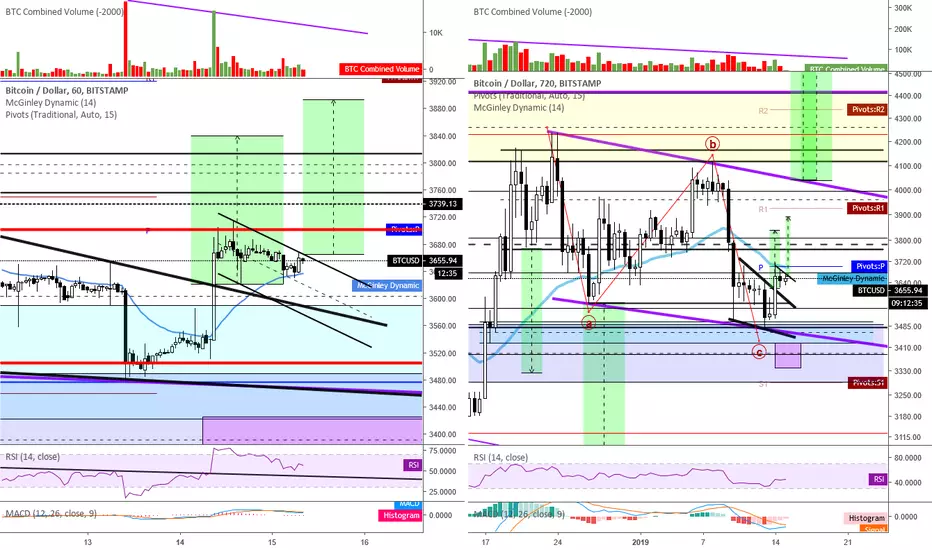
BTCUSD H4/D1 charts (2/1/2019)Good morning, traders. The battle between supply and demand rages on. Bitcoin's price dipped to near the bottom of the local TR at $3364 and has since rebounded back toward the top of it at around $3445 so far. The fact that much more demand is showing up at the bottom of the TR than supply at the top should have the bearish among us concerned. I'm still looking for price to target the blue box, but it begins looking even more interesting now as doing so all-but-guarantees to pull price through the orange wedge's resistance, setting up a target of the yellow resistance, depending on just how quickly price gets to that box. H4 RSI is now pushing through its own resistance as it sits at 49. D1 RSI is challenging its resistance as well. Both TF's RSIs have a lot of room for price to move upward which would likely catch retail traders off guard, if it were to do so, as they expect price to continue down from here. The weekly candle is currently printing as a bullish hammer. Traders should definitely be watching that candle. The higher price goes right now the more bullish the weekly TF becomes (i.e. much greater likelihood of a reversal from the current short down trend). The daily candle is looking pretty good at the moment, but with more than a third of the day left until it closes anything can still happen. The green resistance on the D1 chart, just above the orange, gives a secondary level that price needs to move through as well.
Do we go up from here? Do we print a large IHS? Do we range for the next few months? Does price drop even further and stay down? Absolutely nobody knows for sure. Trading is speculation and, as such, it is inherently risky. The goal is to eliminate as much risk as possible by identifying multiple possible paths of price movement and then deciding what confirmations are needed to signal that price is likely headed in one of the directions you identified, as well as what confirmations are needed that you are the wrong way in a trade. Anybody that tells you anything else is lying to you. Period.
Every day, we have a choice to act positively or negatively, so if you get a chance, do something decent for someone today which could be as simple as sharing a nice word with them. You just might change their day, or even their life.
Remember, you can always click on the "share" button in the lower right hand of the screen, under the chart, and then click on "Make it mine" from the popup menu in order to get a live version of the chart that you can explore on your own.
Tradingrange

BTC/USD H4/D1 charts (1/31/2019)Good morning, traders. Yesterday, I advised our Discord members that I didn't like how price action and volume were acting around the $3450 range and was looking for price to target the $3400 level. Price made one more attempt after I stated that to rise higher, but then printed a bearish SFP and found support around $3400 which is the H4 S1 pivot. The move down to that level aligns with yesterday morning's update which stated we would likely see a pullback toward $3410/20.
Bitcoin price appears to be printing a very nice TR between $3370 and $3440. Currently, price is sitting just below the 15 minute pivot. If it cannot manage to close above that pivot and target the top of the TR from here, then I will be looking for it to make a push toward the bottom of the TR before doing so. H1 RSI is sitting at 41.5 and hasn't touched oversold yet, suggesting the latter scenario is likely. H4 RSI is still low, currently at 41, and continues to have room to run, suggesting that the current move upward has a good chance to target the H4 pivot at $3530 which then puts price into our blue target box.
I am still watching the yellow zone to provide support if price can close above it. This would likely open up a bullish movement above the orange resistance which should then see price targeting the R3 pivot/yellow descending resistance around $3900/$4000. None of this is to say that price will be heading to a new ATH from here, only that if price moves in that manner then that is what we should expect. The yellow resistance is significant so we should generally expect to be rejected at that point since the trend has been corrective for over a year now. By that same token, a close above it should signal more bullish strength and general targets of $4400, 4800, and possibly $5400/$5600. As always, each successive target requires monitoring of price action and volume as it reaches the previous target. At any of those points, we can see price get rejected.
Everyone on cryptotwitter and their grandmother is now calling for a possible Adam and Eve double bottom to play out as price continues to drift lower. This is a possibility that I discussed when price first reached the $3100 level. We do have H4 demand around $3240, but in order for price to retain the orange wedge, while targeting that demand, we would need to see price continuing to drift down for another week or so. Any faster than that runs the risk of dropping through the bottom of the pattern. Until that happens, I will continue to monitor the H4 RSI and watch for a push through the noted resistance. Overall, volume has continued to drop and because it's doing so in relation to the movement down since the bullish run up in mid-December, I'm more inclined to believe that it is the result of demand overcoming supply in this area (i.e. still correcting the impulsive December run up). Again, this doesn't mean that I am saying we will go straight up from here, only that at this time we may see a reversal toward the $4400 area before heading back down toward $3000 once more. The positive side of this, for those who want to see accumulation occurring, and ignore the idea of price reaching sub-$2000, is that it would mean we are currently near completion of the ST in Phase A, and if Bitcoin is creating that large TR then that signals stability in the market and alt coins should continue to provide opportunities to profit. But until we see a higher high, above the $4236 swing high from around Christmas, traders should remain suspect of accumulation.
Every day, we have a choice to act positively or negatively, so if you get a chance, do something decent for someone today which could be as simple as sharing a nice word with them. You just might change their day, or even their life.
Remember, you can always click on the "share" button in the lower right hand of the screen, under the chart, and then click on "Make it mine" from the popup menu in order to get a live version of the chart that you can explore on your own.

BTC/USD H4/D1 charts (1/25/2019)Good morning, traders. I know everyone wants to be bearish because it's easy, but that's also why so many retail traders lose money -- they want to take the easiest route. While I'm not stating that the lowest point is definitively in, I am going to say that current price action on the H4 and higher charts is looking more bullish than bearish at the moment. We have looked at many possible patterns printing over the past few weeks, but I only want to concentrate on two right now that we have discussed -- the light blue large descending wedge printing since the ATH and the orange descending wedge printing since December 24, 2018.
The blue wedge has confirmed with two alternating touches to the top and bottom suggesting, at the very least, a target of the upper blue line. A break and close above that resistance should suggest that either 1) price is headed up into the next bull run or 2) a TR has been established and any movement below the 2018 low will be very short-lived and not very deep. In either scenario, there is a lot of money to be made. However, shorter-term we are watching the orange wedge. The significance of this orange wedge is that the lows are showing possible seller fatigue. We know this because they are printing lower at a much shallower degree than the highs. This is why descending wedges tend to be reversals. The target on a bullish break of this orange wedge is the green box on the H4 chart, which is based on the height of the wedge. However, I continue to hold that any break toward that target area should ultimately result in price targeting the EQs of the two upper supply zones noted at around $4500 and $5420. Also, of importance to note is the descending dashed white line which gives us mid-term resistance beginning at the $6400 level right before the drop. Volume has continued to drop significantly suggesting that a large move in one direction or the other is coming very soon. Earlier this week I stated that it is likely to be this weekend and it still looks that way, so traders should remain cautious. We can also see the various bull divs that have printed the past couple of months on the H4 and D1 charts. These would give credence to a move up toward $5000. However, as I continue to say, until it actually happens it is only a possibility. Because of price's current location just below the pivot and just underneath orange and dashed white resistance, and corresponding drop in volume, I would expect any possible move up to be explosive, catching traders off guard as they expect price to drop. As always, if price drops rather than pops, I am looking for the lower demand zone around S1 to provide initial support.
Every day, we have a choice to act positively or negatively, so if you get a chance, do something decent for someone today which could be as simple as sharing a nice word with them. You just might change their day, or even their life.
Remember, you can always click on the "share" button in the lower right hand of the screen, under the chart, and then click on "Make it mine" from the popup menu in order to get a live version of the chart that you can explore on your own.

INTC: Earnings, 5G and HFT Gap RiskIntel is moving rapidly to capture the 5G market, along with Verizon. This was discussed in detail in our recent annual Virtual Course, this time on Emerging Displacement Technologies for the Next Decade. INTC stock has been struggling at a support level, not moving down much but also without a strong pre-earnings run as many blue chip companies enjoyed. The reason is there are some institutions selling, as seen in rotation patterns and other institutions buying in accumulation patterns. Hence, the trading range pattern on the daily chart. For now the sellers have more dominance, but that can change. The Earnings report is due today after the market close. HFTs are likely to be all over it, which means there is gap risk, and they will trigger either way on earnings news.

BTC/USD H4/D1 charts (1/24/2019)Good morning, traders. As you may be aware at this time, the VanEck ETF was pulled so there will be no decision in February. Normally, such news would've seen Bitcoin drop a few hundred dollars at the very least and if we listen to the most emotionally bearish among us we should've seen a drop through the 2018 lows. However, we only saw a drop of $40-$50 as price bounced off the EQ of the pink TR and, as of this morning, price has recouped that loss and moved higher. This doesn't mean it won't still dump, but it's encouraging at the moment. The smaller TFs are starting to show some signs of life, but we absolutely must see follow-through into the higher TF. As I mentioned to our Discord members and on Twitter, yesterday, the lack of a strong negative reaction to this particular news may be a sign that price is ready to mark up. Market participants should pay close attention to this pair's movement over the next few weeks.
After yesterday's news, I told our Discord members that they should be watching the yellow and white resistance/support lines in RSI. A break and close above both colored resistance lines should indicate that price is healthy and strong which would suggest movement up through the overhead supply and an initial target of $3780. Price is currently attempting to move higher than the H4 McGinley Dynamic after testing the descending dashed line as support and RSI has moved above the white resistance. If price happens to fall, I will be looking for the green demand zone around $3390 to provide initial support. As I said in yesterday's update, price still needs to close above the pivot and POC on the H4 and D1 TFs. When it comes to the D1 chart, I'm still watching for price to breach the noted white dotted resistance.
Every day, we have a choice to act positively or negatively, so if you get a chance, do something decent for someone today which could be as simple as sharing a nice word with them. You just might change their day, or even their life.
Remember, you can always click on the "share" button in the lower right hand of the screen, under the chart, and then click on "Make it mine" from the popup menu in order to get a live version of the chart that you can explore on your own.

BTC/USD H4/D1 charts (1/23/2019)Good morning, traders. There hasn't been a lot of action over night. As discussed during yesterday's live stream, Bitcoin's current price position has supply and demand searching for enough liquidity to get a trend going. Yesterday's drop and $200 rebound appears to have led to the printing of a flag. If so, then the target is the same supply zone that rejected price about 4 days ago. Popping into that supply again may be enough to take out the remaining orders so that price can continue up. Remember, price has to close above the ascending dotted resistance to signal that continued upward momentum, but if it does then the target based on the widest point of the horizontal broadening wedge is a minimum of $240 above the point of breach. The full target would be $400 above that breach point. This means that we should expect price to reach the R3 pivot on the H4 TF, and possibly even the R5 pivot. As discussed yesterday, a breakdown of this wedge should have price targeting the S2 pivot followed by the S4 pivot. RSI moved above its resistance and then retested it as support.
The D1 chart shows the large, possible flag, pattern still printing. There are three targets associated with that pattern. The lowest target would print a possible double/triple top around $4200. This target is based on a possible descending wedge that is printing as noted within the large, possible flag. The next higher target is based on the height of the descending channel that makes up the flag. The highest target is based on the height of the flagpole leading up to that possible flag. Notice the two higher targets complete within the supply zones noted. So there remains a lot of possibility at this time, but until price follows through the are only possibilities. As such, traders need to remain vigilant and should be spending most of their time bettering their risk management.
As mentioned yesterday, what we really need to see in the short term is price closing above the pivot and POC (Point of Control) on both TFs. The POC is the orange line and the pivot is the bright yellow line. If it does, then the odds of reaching these much higher targets is significantly increased.
Every day, we have a choice to act positively or negatively, so if you get a chance, do something decent for someone today which could be as simple as sharing a nice word with them. You just might change their day, or even their life.
Remember, you can always click on the "share" button in the lower right hand of the screen, under the chart, and then click on "Make it mine" from the popup menu in order to get a live version of the chart that you can explore on your own.

Possible GBP/USD Short PositionSELF DEVELOPMENT/METHODOLOGY/PSYCHOLOGY
Chart time frame - H4
Timeframe - 1-2 Days
Actions on -
A – Activating Event
Currency Pair creating a Double Top .
B – Beliefs
Market will be rejected at @1.299 level and move towards the first Target 1 level @ 1.2835
FX_IDC:GBPUSD
Trade Management
Entered @ Sign up for details
Stop Loss @ Sign up for details
Target 1 @ 1.2835
Risk/Reward @ 3.3
Happy trading :)
Follow your Trading plan, remain disciplined and keep learning !!
Please Follow, Like,Comment & Follow
Thank you for your support :)
This information is not a recommendation to buy or sell. It is to be used for educational purposes only!

BTC/USD H4/D1 charts (1/22/2019)Good morning, traders. Bitcoin continues to trend slightly lower but has yet to make a strong, continual move down. This morning we saw price drop, hit demand and rebound just under $200 very quickly. There is no doubt that moves like this are causing traders to lose money as their stops are taken out. The market is attempting to find/create liquidity to get price moving in one direction or the other. This has resulted the local white H4 TR outlined in this chart, as well as the much smaller pink TR. We can also see price wicks printing a horizontal broadening wedge (inverted symmetrical triangle) with higher highs that have been rejected at supply and lower lows that have been rejected at demand. This particular pattern tells us that, neither, buyers nor sellers are in control at this time. The H4 MACD is curled up and nearing a bullish cross while RSI has recently bounced just above oversold. As of right now, we have a recent bullish SFP on the H4 and a possible similar candle on the D1. There is still a lot of time left in the D1, so this latter bullish SFP could change but if it holds then we should expect some upward movement over the next day or two, but we ultimately need to see price moving above the noted overhead supply. Generally, we watch for the fifth swing in this pattern to determine direction. If that fifth swing breaks resistance or support and continues, then price should continue in that direction. If, however, it is rejected on that fifth swing, then we usually look for price to continue in the other direction. In this particular case, the recent drop and $200 rebound was the fifth swing and it was rejected at support suggesting price should continue upward now. Whichever direction price ultimately breaks, we should be looking for a minimum of $240, up to a possible $400, of movement beyond the support or resistance of the pattern. Traders need to understand that while this is what is generally expected with this pattern, the reality is that the pattern is not very reliable so risk management is of the utmost importance (or just waiting for a clean signal to enter).
Price continues to flirt with the D1/D3 pivot, consistently pushing above but closing below it. The basic trendlines are outlined on the D1 chart. Price breaking any of these would suggest continuation in the direction of the break. We can see that this morning's move hit the EQ of the D1 demand, so the bounce should've been expected. However, what we need to see is follow-through. As mentioned above, the market is unsure at this time and is looking for liquidity in either direction to provide confidence. The first side to give this confidence will control direction in the short-to-mid term.
Where does price need to get above to continue moving up? On the H4, we need to see price moving above the POC at $3630.51. On the D1, that would be $3809.16. These orange lines denote the area where we should expect to see the most local resistance and, therefore, provide good support if moving above them. To push above them indicates that demand is more dominant than supply. For now, volume and price action seem to suggest some sort of upward movement, but traders looking to limit their risk will usually wait until price closes above the pivot and POC on a TF before entering.
Every day, we have a choice to act positively or negatively, so if you get a chance, do something decent for someone today which could be as simple as sharing a nice word with them. You just might change their day, or even their life.
Remember, you can always click on the "share" button in the lower right hand of the screen, under the chart, and then click on "Make it mine" from the popup menu in order to get a live version of the chart that you can explore on your own.

BTC/USD H1/D1 charts (1/21/2019)Good morning, traders. We did see a bit of movement this weekend, which we will be taking a look at on this H1 chart. As I warned during Friday's live stream, traders had to be aware of the $3780 area as possible resistance, even though the target based on the triangle was higher. Sure enough, price was rejected at $3774 and then printed a bullish SFP at $3470 creating the possible second LPS (similar to Wyckoff Accumulation Schematic #2) which I suggested was likely to happen if price was rejected as it was. This is an important area because if we see upward movement from here, then the odds are most likely that we will see those upper $4000 and $5000 targets. Price appears to be building quite the support at the bottom of the blue TR around $3470.
In terms of the local yellow TR, the recent bullish SFP appears to be a Spring (similar to the much more common Accumulation Schematic #1). We can see volume dropping off significantly from the SC suggesting that supply is exhausted. Price has moved out of oversold and is currently attempting to move through the McGinley Dynamic as it targets the pivot. As always, a close above the pivot should be considered bullish on this TF. We should expect price to print another LPS, most likely around the pivot, after pushing above it, and then an SOS at the dashed yellow line with a BUEC/LPS between that and the solid yellow line denoting the top of the TR. An SOS targeting the R2 pivot/descending green resistance line of the large flag should follow.
Failure for price to follow through as described will likely see it targeting the S2 pivot at $3290 followed by the S4 pviot at $2930. This would print a Spring on the larger blue TR which should then see price pushing toward those $4000 and $5000 targets. I have outlined the possible two paths on the D1 chart, one in yellow and the other in orange. These are the same paths we've been watching play out for the past month or so. These appear to be the two most likely paths that price will take, however traders should not discount the possibility of price falling toward $2500 or lower. Currently, RSI does not appear to support such a move, but traders need to remain vigilant.
Every day, we have a choice to act positively or negatively, so if you get a chance, do something decent for someone today which could be as simple as sharing a nice word with them. You just might change their day, or even their life.
Remember, you can always click on the "share" button in the lower right hand of the screen, under the chart, and then click on "Make it mine" from the popup menu in order to get a live version of the chart that you can explore on your own.

BTC/USD H4 chart (1/18/2019)Good morning, traders. Nothing has really changed since yesterday. Today we are taking a look at the H4 Bitfinex chart. The red lines draw an almost perfect diamond pattern. McGinley Dynamic is currently sitting just above price which is bouncing off support at the moment. The targets based on the diamond are shown, as are immediate supply and demand zones. RSI has been printing a descending broadening wedge since December 20th, and within that an ascending triangle since January 14th, suggesting a break to the upside for price. MACD has been trending higher since January 11th and is nearing a bullish cross of centerline. However, it has slowed down quite a bit the past few days as expected due to the price consolidation within the diamond. Volume has been dropping off as a result as well. If price pops up, then I expect a test of the upper supply zone EQ at around $4120. Continuation above that level will have price pushing through the D1 50EMA. A close above that EMA should set up the $4800-$5600 targets. A move down should expect to find strong demand in the lower zone. A close below that zone should open the gates for a possible move down to $2450 if $2850-$2950 doesn't hold.
Every day, we have a choice to act positively or negatively, so if you get a chance, do something decent for someone today which could be as simple as sharing a nice word with them. You just might change their day, or even their life.
Remember, you can always click on the "share" button in the lower right hand of the screen, under the chart, and then click on "Make it mine" from the popup menu in order to get a live version of the chart that you can explore on your own.

BTC/USD H1 chart (1/17/2019)Good morning, traders. Yesterday we took a look at the larger TF and today we will check out what the smaller TF is saying on the Coinbase chart. I have outlined the black TR, red possible flag, and the blue diamond that is currently printing.
We can see that price is nearing a decision point. Does it go up or down? Price is at the bottom of the TR and possible flag, suggesting support will give it a bounce. It is also printing a diamond. The breakout targets based on the diamond are shown in both directions with my belief being that price will target the S1 pivot if dropping and the R1 pivot if rising. Furthermore, targeting the R1 pivot should have price ultimately targeting the upper red resistance and, if this happens, then there is a lot more reason to believe price will push through it and head up to those higher targets that have been in play for 3-4 weeks now. However, if price heads down then it will break that flag and likely retest the 2018 lows. It doesn't have to, and we could realistically see a bounce from the S1 area, but with a move down like that it seems more likely to retest those lows.
RSI and MACD are printing their own triangles in unison with price's diamond. We can also see volume dropping off pretty well over the past four days. With the price, RSI, and MACD consolidations occurring, a strong breakout is imminent and traders would likely do themselves a favor by waiting for confirmation of direction before entering a trade.
As I have continued to warn traders, we need to see volume increasing as price increases to provide the fuel needed to push through that nearby overhead resistance. Failure to do so means price is most likely headed down. However, down may not be bad. If there is a move down from here to the ~$2900 target, then it could very well just be a Spring which would indicate bullish momentum incoming and we could expect a very nice move up. However, we would have to wait until that point and evaluate price action and volume at that time.
Every day, we have a choice to act positively or negatively, so if you get a chance, do something decent for someone today which could be as simple as sharing a nice word with them. You just might change their day, or even their life.
Remember, you can always click on the "share" button in the lower right hand of the screen, under the chart, and then click on "Make it mine" from the popup menu in order to get a live version of the chart that you can explore on your own.

BTC/USD D1 chart (1/16/2019)Good morning, traders. Yesterday's $100 move to the downside created a descending broadening wedge, out of the previous bull flag, which price broke out of this morning. Currently, price is testing resistance as support, and if this is successful we should generally expect continued upward movement. The 15 minute McGinley Dynamic aligns with the previous resistance and price has closed above the blue pivot, even pushing briefly above the R1 pivot before this retrace. Is this still wave 4 of the C wave? We don't know yet. If so, then we can expect to move to the lower pink box, most likely, before moving up with the next set of impulse waves. Currently, tensorcharts.com is showing significant visible supply on the order books immediately overhead. There is also strong visible demand immediately below price as well. Volume has continued to drop on the H1 suggesting that we may still be in the corrective wave. The next set of impulsive waves up should break through the volume downtrend on the H1/H4 TFs. As always, traders should be utilizing strong risk management and waiting for confirmations before entering a position.
The H12 shows the recent upward breakout being rejected at the McGinley Dynamic, but it also shows higher lows and highs from the January 13th low. The lack of a green (white on my chart) D1 candle yesterday makes the January 14th bullish engulfing candle reversal suspect, so we must continue watching the daily closes. The bigger picture remains. We have what appears to be an accumulation TR without a Spring currently printing, denoted by the horizontal blue lines. We have the outer resistance levels denoted by the horizontal red lines (these are ultimately the levels traders should be watching). We have the impulsive move up from the ST. Volume has continued to drop since the PS, suggesting consolidation toward a significant move in either direction. We can see the descending green dashed line, which is aligning with the 50 EMA, and a move above that should see volume increasingly significantly. We can also see there is a possible support building along the ascending dotted black line. The blue zones above the TR note D1 supply. D1 MACD is curled up suggesting bullishness building, as well as having printed bullish divergence on the histogram between December 7th and January 13th. D1 RSI continues printing higher lows and highs so far.
A move above the D1 pivot will likely target the upper pink box and then the descending green resistance. My belief remains that if this occurs, then price will hit that green resistance, drop back for a retrace, possibly using the ascending black dotted support to bounce from, and then push through the resistance. I have outlined this possibility in orange, and it would align with the expected movement of this TR completing without a Spring. A move to the lower pink box could still see price following this movement, but it also increases the chances of a retest of the lows at the lower red line. So, as mentioned above, traders need to remain cautious. We will discuss this in detail, as well as look at the smaller TF charts during this morning's live stream.
As I have continued to warn traders, we need to see volume increasing as price increases to provide the fuel needed to push through that nearby overhead resistance. Failure to do so means price is most likely headed down. However, down may not be bad. If there is a move down from here to the ~$2900 target, then it could very well just be a Spring which would indicate bullish momentum incoming and we could expect a very nice move up. However, we would have to wait until that point and evaluate price action and volume at that time.
Every day, we have a choice to act positively or negatively, so if you get a chance, do something decent for someone today which could be as simple as sharing a nice word with them. You just might change their day, or even their life.
Remember, you can always click on the "share" button in the lower right hand of the screen, under the chart, and then click on "Make it mine" from the popup menu in order to get a live version of the chart that you can explore on your own.

BTC/USD H1/H12 charts (1/15/2019)Good morning, traders. Not a lot has changed since yesterday's pop. Price is currently printing a flag with a target of around $3890 if price moves up within the next hour or two. That's just above the $3840 target based on the height of the descending wedge that price closed above. It is also just above the 1.618 extension off the swing low to the local swing high. This would suggest that it would be a wave 3, and the 1.272 extension off waves 1-3 would be $4000 which is also the top of the flag. As suggested during yesterday's live stream, this would create a larger wave 1 with a wave 2 pullback before seeing wave 3 pushing through that resistance. That general area is also the 50 EMA, so as I have continued to state, a close above that would be significant. As always, traders should be utilizing strong risk management and waiting for confirmations before entering a position.
As noted above, price is printing a bull flag with a target of $3885 and is sitting above the H1 McGinley Dynamic. However, we could see an extension up to the R1 pivot just above it at $3925, if price moves up. A 50% retracement after reaching the $4000 level would be around $3740 and place price on top of the H12 McGinley Dynamic and blue pivot which would be bullish. A 61.8% retracement would put price right about where it is now, so my initial expectation, if price follows that path, is to see it retrace to between the 50% and 61.8% levels before blasting through the overhead resistance. The H12 MACD is curled up and targeting a bullish cross. Yesterday's D1 candle printed bullish engulfing which usually signals a bullish trend reversal, and the D1 MACD histogram printed bullish divergence between December 7th and January 13th. As a matter of fact, it closed above the past 4 days. This should indicate that we see at least a few days of bullish momentum. However, we need confirmation today in the form of a green D1 candle. The D3 candle is printing a very nice possible reversal bullish hammer as well. That D3 candle closes at the end of the trading day, today, so if we see a move up we will get confirmation on the bullish trend reversal for the D1 as well as a strong bullish reversal candle on the D3. Last week's W1 candle was not pretty, but it found support at previous resistance, so a move up through this week could see a reversal off that candle and fuel the tanks for higher targets. Failure of the weekly candles to sustain growing upward momentum will result in hidden bearish divergence forming on MACD's histogram until price moves above $6550. So, even if price makes the move up toward $5000, it could still succumb to W1 hidden bearish divergence which is continuation of the downward trend. While things are looking bullish in the short term, a breakdown of price would suggest a move into the lower pink box and a re-evaluation at that time.
As I have continued to warn traders, we need to see volume increasing as price increases to provide the fuel needed to push through that nearby overhead resistance. Failure to do so means price is most likely headed down. However, down may not be bad. If there is a move down from here to the ~$2900 target, then it could very well just be a Spring which would indicate bullish momentum incoming and we could expect a very nice move up. However, we would have to wait until that point and evaluate price action and volume at that time.
Every day, we have a choice to act positively or negatively, so if you get a chance, do something decent for someone today which could be as simple as sharing a nice word with them. You just might change their day, or even their life.
Remember, you can always click on the "share" button in the lower right hand of the screen, under the chart, and then click on "Make it mine" from the popup menu in order to get a live version of the chart that you can explore on your own.
BTC/USD H1/H12 charts (1/11/2019)EDIT: Sorry, guys, you're going to have to scroll the chart. Tradingview hiccuped when I published them apparently.
Good morning, traders. Price bounced exactly where I said it would yesterday, so where does that leave us today? The bounce created a bullish SFP on the D1 and price has consolidated around the $3630 level since then. During yesterday's live stream I spoke a bit about the volume which was greater on the second leg down on Bitstamp. However, I have gone back and added the global volume indicator (top of the chart) and it shows that, across the major exchanges, volume was less on the second leg down which is a good sign.
H1 chart:
As mentioned, price has been consolidating around the $3630 level since yesterday's bounce. This is the 78.6 retracement from the swing high to swing low. We can see price possibly printing an ascending channel which gives it room to pop up to the 50% retracement level at around $3800. Initially, I'm expecting price to find resistance at the EQ of that yellow supply zone at $3780-$3785. However, this is only the H1 supply, so if the demand is significant enough on a move up, it could push right through it, in which case we should expect a move all the way back up to $4000. RSI is just barely out of oversold at this time, but as mentioned yesterday we could still see price drop and create bullish divergence. Currently, MACD's histogram is printing bearish divergence over the past couple of days (from the $4000 area to these current candles). What this means is that if we don't get a strong move back up to that $4000 area sooner rather than later, the likelihood that we may see price attempting to push further down is increased significantly. We want to see RSI push through the noted resistance, and if it does it is likely that price will be pushing through the McGinley Dynamic thereby creating bullish momentum on this TF. On the positive side, we do see price attempting to push through the orders in the current yellow zone.
H12 chart:
We can note the bullish SFP on this TF as price wicked below the swing low at $3566 and closed back above it. However, since then we have yet to see any strong movement up. As shown, price bounced out of the H12 demand zone. As I have mentioned recently, we may be seeing a double top playing out as well. Traders should use caution with long positions if we get a close below $3566. This would appear to confirm the double top and the measured move would be a target of around $2935 which is also the S5 pivot. Until a close below $3566, it is only a possible double top. As I have continued to warn traders, we need to see volume increasing as price increases to provide the fuel needed to push through that nearby overhead resistance. Failure to do so means price is most likely headed down. However, down may not be bad. If there is a move down from here to the ~$2900 target, then it could very well just be a Spring which would indicate bullish momentum incoming and we could expect a very nice move up. However, we would have to wait until that point and evaluate price action and volume at that time.
Every day, we have a choice to act positively or negatively, so if you get a chance, do something decent for someone today which could be as simple as sharing a nice word with them. You just might change their day, or even their life.
Remember, you can always click on the "share" button in the lower right hand of the screen, under the chart, and then click on "Make it mine" from the popup menu in order to get a live version of the chart that you can explore on your own.

BTC/USD H4/D1 charts (1/9/2019)Good morning, traders. Price has moved sideways, extending the local TR, since yesterday but we may be nearing upward momentum as I'll explain below.
H4 chart:
MACD's histogram is printing hidden bullish divergence between 1/5/19 at 10 p.m. and the current candle. We can see higher lows between those two price points, but the histogram is printing lower lows. Hidden bullish divergence is a bullish continuation indication so we should expect price to push higher sooner rather than later. This divergence will be invalidated if price drops below $3780. Hidden bullish divergence would suggest that the horizontal TR that price has been in since the top of the impulsive candle on 1/6/19 is re-accumulation in anticipation of pushing up and through the major resistance just overhead, setting up the move up to the low-to-mid $5000s. I am watching for RSI to push through resistance which should be the point at which price makes the move through its own resistance. The McGinley Dynamic is still below price which is a positive sign for now. A close above the recent swing high at $4112 should have price moving upward toward the higher targets as it would be a break of the descending resistance that has been keeping price in check for the past 2.5 weeks or so. A close below the swing low at $3934.73 would have me watching the $3750/$3800 level for support. Failure of that level to support price is a strong indication that we may be headed to the 2018 low once more.
D1 chart:
RSI is nearing a break of a key level that it hasn't been above since August/September of last year. If it breaks this level, denoted by the horizontal blue line, then we should expect price to be breaking through its major nearby overhead resistance as well. Yesterday's volume was just shy of the December 29th volume as I suggested it was likely to be near or potentially even break. Bears are calling for people to short this because they believe it has already failed. While it is a possibility, I would be wary of shorting without confirmation as the overhead resistance is strong so this could also be nothing more than consolidation to gain the strength needed to push through that resistance. Many bears got burned terribly during the April short squeeze by not waiting for confirmation. The significance of a break of the overhead resistance shouldn't be underestimated as the 50 EMA is sitting right on top of price so that kind of movement would put price on top of that EMA which is strongly bullish.
Every day, we have a choice to act positively or negatively, so if you get a chance, do something decent for someone today which could be as simple as sharing a nice word with them. You just might change their day, or even their life.
Remember, you can always click on the "share" button in the lower right hand of the screen, under the chart, and then click on "Make it mine" from the popup menu in order to get a live version of the chart that you can explore on your own.

BTC/USD H4/D1 charts (1/8/2019)Good morning, traders. As I spoke about during yesterday's live stream, price made a final move down toward the H1 pivot before this morning's breakout of the flag, stopping just about $14 above it. The target is now $4342 based on the height of the flagpole.
H4 chart:
The aforementioned bull flag target should bring price up to the possible ascending channel's EQ. Just above it is the R2 pivot. The swing high that denotes the upper boundary of the D1 TR's resistance is right above that at $4409.77. I am expecting price to potentially get as high as $4540 before retracing a bit and then pushing higher, however these are areas of significance and could provide resistance for price as it does. That being said, price must first close above the swing high at $4090 before we can even look at price targets.
D1 chart:
RSI broke bullishly out of its symmetrical triangle as price broke out its own symmetrical triangle. Price continues to print similarly to accumulation schematic #2 (accumulation without a Spring) as I outlined a few weeks back in orange. I have outlined the expected movement based on this TR with orange once again. Price following this path would basically be a repeat of its move up from $3100. D1 volume should at least print higher than January 4th's volume which will provide the expanding volume that we need to see. A potentially strong move up may even see it print higher than December 28th's volume. We must remain aware of the diagonal resistance that looms just above price. This is the descending dotted black line and denotes the neckline of the possible IHS that may be printing. The grey price range tool provides the target based on the flagpole of the large flag that price recently broke bullishly out of and the green price range tool provides the target of the IHS if it plays out as such. We need to see volume expanding and the candle spread continuing to print large on the rallies to validate the IHS. Anything else makes that particular pattern suspect, but it does not invalidate the large flag.
Every day, we have a choice to act positively or negatively, so if you get a chance, do something decent for someone today which could be as simple as sharing a nice word with them. You just might change their day, or even their life.
Remember, you can always click on the "share" button in the lower right hand of the screen, under the chart, and then click on "Make it mine" from the popup menu in order to get a live version of the chart that you can explore on your own.

BTC/USD H4/D1 charts (1/7/2019)Good morning, traders. As suggested was most likely on Friday, volatility came in and Bitcoin moved up over the weekend. Many traders were caught off guard as they expected price to drop (a symptom of the corrective market whereby traders expect every rally to fail).
H4 chart:
We can see that price broke upward out of the symmetrical triangle. The target based on the widest part of the triangle is denoted by the red price range tool at around $4275. Price is currently printing a bull flag with a target of about $325 above the point of breach based on the height of the flagpole. Breaking out during this candle or the next should align that target with the R2 pivot which is just under the TR's upper resistance.
D1 chart:
RSI broke bullishly out of its symmetrical triangle as price broke out its own symmetrical triangle. Price continues to print similarly to accumulation schematic #2 (accumulation without a Spring) as I outlined a few weeks back in orange. I have outlined the expected movement based on this TR with orange once again. Price following this path would basically be a repeat of its move up from $3100. We will take a look at this repetition during this morning's live stream. But we must remain aware of the diagonal resistance that looms just above price. This is the descending dotted black line and denotes the neckline of the possible IHS that may be printing. The grey price range tool provides the target based on the flagpole of the large flag that price recently broke bullishly out of and the green price range tool provides the target of the IHS if it plays out as such. We need to see volume expanding and the candle spread continuing to print large on the rallies to validate the IHS. Anything else makes that particular pattern suspect, but it does not invalidate the large flag.
Every day, we have a choice to act positively or negatively, so if you get a chance, do something decent for someone today which could be as simple as sharing a nice word with them. You just might change their day, or even their life.
Remember, you can always click on the "share" button in the lower right hand of the screen, under the chart, and then click on "Make it mine" from the popup menu in order to get a live version of the chart that you can explore on your own.

BTC/USD H4/D1 charts (1/3/2019)Good morning, traders. The Proof of Keys event is scheduled for today but so far we don't see any issues from the exchanges. As I have been suggesting was likely, there seems to have been a lack of participation, at least on a large enough scale to be meaningful. Granted the U.S. is just coming online this morning, but we have seen no follow through with the East so far and their day has been ongoing for a while now. Traders utilizing EW should continue to remain cautious as price lows are not aligning between the various exchanges. This leaves one exchange showing a higher low while another shows a lower low. Be sure you're looking for other indications of price movement such as volume and price action, patterns, and/or momentum indicators such as RSI or MACD.
H4 chart (Bitstamp):
Price continued up into the local TR's resistance, peaked over the pivot and descending purple channel/bull flag's resistance, and then retraced about $60. It appears that price may be readying itself via this retracement for the push through that flag resistance as it targets the yellow supply zone on the next leg up and then $4200 at the R1 pivot. Ultimately, that should bring price into the $5200-$5500 range, as I have been talking about for the past month or so. What happens after that will most likely be the most telling in relation to where price is probably headed. For now, the next two legs up are looking to target that yellow supply zone and then the R1 pivot.
D1 chart (Bitfinex):
Nothing has changed on this TF. Price has been correcting overnight before it makes its way through the bull flag's resistance. This gives us a target of around $5000 on this exchange, which is about $4860 on Bitstamp, based on the height of the flagpole. One final leg up afterward should have price targeting about $500-$600 higher than that as mentioned above. We can see that volume has increased over the past couple of days and we should expect to see that continue as price moves up. As I am keen on reminding everyone, this current bullish momentum does not guarantee that price will not notch a lower low. However, the possibility that a low price may have been found continues to increase. We haven't seen overly-exuberant buying which is a good sign. Buying that is initially excessive after a move down tends to be corrective in nature due to the overly excessive selling that usually precedes it. Buying that takes a more measured approach is what we want to see because that is the one that is full of disbelief. It is the one that shows us ever-expanding volume and widening candle spreads on the rallies and contracting volume and diminishing candles spreads on the reactions all while the bearish among us continue to call it a sucker's rally. As such, it is never identifiable immediately.
Every day, we have a choice to act positively or negatively, so if you get a chance, do something decent for someone today which could be as simple as sharing a nice word with them. You just might change their day, or even their life.
Remember, you can always click on the "share" button in the lower right hand of the screen, under the chart, and then click on "Make it mine" from the popup menu in order to get a live version of the chart that you can explore on your own.

BTC/USD H4/D1 charts (1/2/2019)Good morning, traders. We saw price break through its resistance on the H4 and D1 charts over night. Now we just need to see follow through. Trace Mayer's Proof of Keys event happens tomorrow, but has its significance been blown out of proportion? How many people do you really think are going to go through the hassle and expense of pulling their BTC off the exchanges? Human nature tells me very little of the overall bulk, so I don't believe people should be too worried about it, but this is just my opinion.
H4 chart (Bitstamp):
In terms of the local blue TR, price is nearing its resistance once more. The large wedge's target of $3960 still remains. RSI has closed above its resistance and retested it as support. I have also noted support and resistance lines that I spoke about a few days back with dotted black lines. These are potentially forming a symmetrical triangle. Rejection at the current level would have me watching the bottom of the triangle for support. Of note is also the descending dashed red line which is the D1's resistance line. Price's large green candle pushed through it and price then retested it as support a few candles later. As we can see, all of this is taking place within the large purple descending channel that is possibly printing. A close above that channel's resistance should see price ultimately targeting the $4900 level at the least, which would be the next leg up. Since yesterday's large candle, price has ranged between the McGinley Dynamic and the H4 pivot. When it comes to HVNs, price appears to be attempting to push through the current one which would allow it to move up to the aforementioned target which is in close proximity to the swing high.
D1 chart (Bitfinex):
Price action continues to look like demand is in control at this time. We can see clearly impulsive movement up with candle spread widening and volume expanding until about a week ago. Since that time, we have seen choppiness with smaller red candle spread and decreasing volume. Price and RSI have pushed through their resistances, but can easily fall back below them by the end of the day. So, until that time, we should view the longer term TF breakout as suspect. Price remains above the pivot and McGinley Dynamic signalling bullishness for now. A close below those would suggest supply is possibly taking control and the blue box on the H4 chart would remain my initial target with a secondary target of the S1 pivot on the D1 chart.
Every day, we have a choice to act positively or negatively, so if you get a chance, do something decent for someone today which could be as simple as sharing a nice word with them. You just might change their day, or even their life.
Remember, you can always click on the "share" button in the lower right hand of the screen, under the chart, and then click on "Make it mine" from the popup menu in order to get a live version of the chart that you can explore on your own.

BTC/USD H4/D1 charts (1/1/2019)Good morning, traders. Welcome to 2019. I am seeing a lot more of the doom and gloom lately, which should be interesting in terms of overall retail sentiment. Bakkt being delayed once again has traders sure that price will rollover and continue further down now, but as we know the market rarely does what the herd thinks it will. That doesn't mean it won't fall further, only that there is a certain greater level of risk associated with following the herd at certain levels within price movement. We will take a look at the monthly and yearly candles during this morning's live stream.
Not a lot has changed with the charts since yesterday, so we will zoom out to the H4 and see what there is to see. I have noted a horizontal blue TR as well as a descending channel or wedge that is currently printing. The reactions continue to lose steam while the rallies have become increasingly stronger during this likely corrective movement from the recent $4236 price high. As we can see, the most recent candle shows a large wick through the pattern's descending resistance and is capped by the McGinley Dynamic in pink. Could this be a stop run before a thrust up? We will have to continue to watch, but let this be a reminder that traders should never set their stops and entries just on the other side of support or resistance as they run the risk of being caught in a liquidity engineering event such as a stop run. RSI is trending down within a possible channel or wedge as well. The latter, as with price, suggests upward movement while the former suggested downward, so a close above resistance is what you are looking for if you want to see price rising. A move up and through the price pattern's resistance should send price targeting the swing high at $3970. If price falls below the swing low at $3566, then my expectation is a move down to $3340-$3440, with the greatest emphasis on the yellow zone within it, especially around its EQ at $3391, as that gets price to the 78.6 retracement of the impulsive move up. Failure for that box to hold will have me looking at the S2 pivot at $3209 for support. My concern continues to be that RSI has not dipped into oversold yet since it hit overbought. That doesn't mean it can't go up from here, only that it causes me to use more caution with any potential shorter-term long trade.
The D1 chart shows price sitting on the pivot and just above the McGinley Dynamic. A close below those increases the likelihood that price will be headed toward that lower target mentioned above. However, a close above the descending resistance line will likely see price heading above the R1 pivot. Traders can also watch for RSI to close above its own resistance as an indication that price is headed toward the R1 pivot. Volume is dropping off and the MACD is evening out, so we will likely have a bigger move coming sooner rather than later. Make sure you notice that the H4 chart is Bitstamp while this D1 chart is Bitfinex.
Every day, we have a choice to act positively or negatively, so if you get a chance, do something decent for someone today which could be as simple as sharing a nice word with them. You just might change their day, or even their life.
Remember, you can always click on the "share" button in the lower right hand of the screen, under the chart, and then click on "Make it mine" from the popup menu in order to get a live version of the chart that you can explore on your own.

BTC/USD 15min/H4 charts (12/31/2018)Good morning, traders. The descending red resistance line I spoke about on Friday turned out to be exactly what we should be watching as price popped up and through as I was publishing my outlook. The H12 bullish divergence on the MACD histogram also was key. As I continue to tell traders, if you are intent on using EW you should also remain aware of patterns, divergences, etc. that may be setting up. This becomes especially important when the EW count is trying at best.
At this point, the count remains anything but easy, so we will look for patterns and we can see a large possible flag printing. The target based on the size of the flag (descending channel) is $535 above the point at which price breaches the top of the flag. The target based on the flagpole is about $1115 above the point at which price breaches the top of the flag. Within that flag, we should also note the impulse wave on December 28th and the corrective nature of the waves since then. This leads me to believe we have more movement to the upside in store before any possible significant movement to the downside. At this point, price has already retraced almost 61.8% of the entire move up, so it would technically be an opportune place to bounce. As of this time, the flag only has one touch of the top which means we can't definitively state it is a flag/descending channel. In order to do so, we need four alternating touches of support and resistance. I have drawn in the smaller possible channels as they are playing out inside that flag on the H4 chart. A breach of the smaller descending channel should provide a target of the larger descending channel's resistance.
Remember, price could potentially be printing a large IHS as well, but we really need to see volume expanding and candle spread increasing as it completes the right shoulder and breaks through the neckline. Failure to do so will most likely lead to failed follow through toward the proposed target around $5300/$5400. Currently, I am watching the H4 RSI for a breach through its resistance to signal bullish momentum. On the 15 minute chart, we can see that price is bouncing between the pivot and the S1 pivot. Like the H4 RSI, I am watching the 15 minute RSI for a break through its resistance as well. Notice that in both charts, price is consolidating at the HVN and is sitting just under the McGinley Dynamic. With RSI trending upward from oversold on the 15 minute, and nearly so on the H4, logic would suggest that we will see that move up and through all that resistance, but traders should still use caution and look for confirmations before entering.
Price took the road more traveled this past year and moved to the downside a bit. As I warned yesterday, traders should've been waiting for a confirmation in either direction which could've been either the close above the swing high or below the swing low, or it could've been the close above the triangle's resistance or below its support. The thing I'm watching most at the moment is the H12 MACD histogram. It is currently printing hidden bullish divergence (lower lows on the histogram but higher lows on price between December 3rd and today so far. I say so far because we need to see a shorter histogram print to confirm this divergence. As such, price could fall further before printing it.
Every day, we have a choice to act positively or negatively, so if you get a chance, do something decent for someone today which could be as simple as sharing a nice word with them. You just might change their day, or even their life.
Remember, you can always click on the "share" button in the lower right hand of the screen, under the chart, and then click on "Make it mine" from the popup menu in order to get a live version of the chart that you can explore on your own.

BTC/USD 15min/12H charts (12/28/2018)Good morning, traders. Price took the road more traveled this past year and moved to the downside a bit. As I warned yesterday, traders should've been waiting for a confirmation in either direction which could've been either the close above the swing high or below the swing low, or it could've been the close above the triangle's resistance or below its support. The thing I'm watching most at the moment is the H12 MACD histogram. It is currently printing hidden bullish divergence (lower lows on the histogram but higher lows on price between December 3rd and today so far. I say so far because we need to see a shorter histogram print to confirm this divergence. As such, price could fall further before printing it.
The H12 chart shows the possible 5 waves up as well as the bull flag that is printing. A move up and out of this flag should have a target that is about $1114.56 above the point at which price pushes through and continues out of the flag. This could get price up into the $5000s if it happens sooner rather than later. We also know that a potential HS is printing as well, though I remain concerned about the volume in the head of that pattern. A completion of this pattern should have price targeting the mid-$5000s if it happens sooner rather than later.
I'm still not convinced of this wave count at the moment, though, so I am watching for signs of movement as price and RSI push through support and/or resistance. If the count is correct, then I have a proposed target on the 15 minute chart. But the shortness of the proposed B wave is giving me pause as to the correctness of the count. This 5 waves down could also be the A wave, with the 3 wave B upcoming, followed by a possible 5 waves C down if it is a zig zag. So, if price pushes through the red descending dotted line then my expectation is up, whether it be for the larger wave 3 or the smaller wave B. The latter should give us a target of $4050/$4100 or so. I'm just having trouble at the moment squaring up a fifth wave down if it does push through that red resistance at this time.
Every day, we have a choice to act positively or negatively, so if you get a chance, do something decent for someone today which could be as simple as sharing a nice word with them. You just might change their day, or even their life.
Remember, you can always click on the "share" button in the lower right hand of the screen, under the chart, and then click on "Make it mine" from the popup menu in order to get a live version of the chart that you can explore on your own.

BTC/USD 15min/4H charts (12/27/2018)Good morning, traders. Not a whole lot to talk about this morning but I'll do my best to give you multiple views of current price action. Bitcoin's price continues to trade sideways within a small TR which I have labeled on the 15 minute chart. We can also see that a possible Adam and Eve double bottom is building. This won't be confirmed unless price closes above the swing high between them at $3863.34. We can watch the RSI for a sign of strength which should manifest itself as RSI passing through the descending resistance line. If price closes above that swing high, then we should be looking for a target of around $4050 based on the height of the proposed double bottom. However, a close below the swing low of $3674.73 would suggest further downward momentum. Price is currently printing a symmetrical triangle. As usual, these patterns have no directional bias. The height of the triangle is about $170, so traders can use this as an initial target upon a close above the triangle's resistance or below its support by adding it to the former's point of breach or subtracting it from the latter's point of breach. So, as we were yesterday, we continue to watch the swing high and low for entry signals. Beware of possible bearish or bullish SFPs, which is why we always wait for a close and we don't immediately buy or sell the breach.
The 4H chart shows us the large blue accumulation TR and the much smaller purple distribution or re-accumulation TR. Looking closely, we can see that price is currently ranging around the pink pivot at the bottom of the purple TR. It also shows us the red descending wedge and related target as well as the black descending channel and related target. As we can see, price is utilizing the top of that channel as support at this time. These targets suggest further upward movement, rather than down, but risk management demands that we see movement progress in that direction before we go long from here (i.e. a close above the swing high on the 15 minute chart). The two lower yellow zones give us an idea of likely reversal or, at the very least, consolidation areas if price heads down. A drop through that dashed ascending black support line would signal a likely move toward these areas. Traders need to be aware of possible hidden bearish divergence printing on the MACD's histogram if price can't get a surge up similar to the recent drop from the top of the purple TR. The histogram is quite short so the longer it takes price to move up once it goes, the more likely that is to play out. As always, another way to look at that move down and current sideways action, is that it is a checkmate pattern playing out which means we would expect a move back up to the drop's point of origin (top of the purple TR) in the same sudden fashion thereby eliminating the risk of hidden bearish divergence.
Normally, I would at least expect a move up toward the top of the purple TR again, but we may not get that. Traders should not be too anxious to enter at this time, rather they should wait for price to give them a signal of likely direction. The most promising bit of data I am seeing at the moment is that volume on the reactions on the 15 minute chart continue to drop. The first step is for price to close above the pivot on this short TF, then above the red triangle, and finally above the swing high. If we can continue to see volume dropping on the reactions as price does that, we should be good to go toward the aforementioned targets. On the 4H TF, we want to see RSI push through its descending resistance line to signal stronger likely upward momentum which would suggest a move up to the top of the purple TR. As mentioned during yesterday morning's live stream, price has hit the 50% retracement of the move up so far.
Every day, we have a choice to act positively or negatively, so if you get a chance, do something decent for someone today which could be as simple as sharing a nice word with them. You just might change their day, or even their life.
Remember, you can always click on the "share" button in the lower right hand of the screen, under the chart, and then click on "Make it mine" from the popup menu in order to get a live version of the chart that you can explore on your own.
