GOLD - where is support now? holding or not??#GOLD.. what a perfect move as per our video analysis and congratulations to all.
now on chart we have 2341 around as a immediate supporting area now. guys keep close 2341 now.
if market continue trade above 2341 then again a bounce expected to further day high,keep close you supporting area and dont short until market hold 2341
stay sharp..
good luck
trade wisely
Tradingrange

GOLD - one n only support, holding or not??#GOLD... a perfect move is going on according to our video analysis and as you can see market perfectly hold 2 times 2331 32 and dropped.
and our last day supporting area 2321 is still valid guys don't take it easy,
a triangle is also on table. keep close the tringle.
TECHNICAL:
2321 is one of the most important on chart in hour and 4 hours chart. in yesterday market perfectly hold it and now again hat is your area, short only below that area with mentioned tp's
good luck
trade wisely

XAU suddenly increased sharply todayWorld gold spot price stands around 2,321.6 USD/ounce
World gold prices suddenly increased sharply after being "hurt" by a statement from a US Federal Reserve (Fed) leader that caused the USD to increase in price, taking away XAU's significant strength.
The Fed keeping interest rates unchanged for a longer period of time may be enough to control inflation, and the Fed may even raise interest rates further if inflation continues to rise.
Currently, investors are paying attention to the US May inflation report published later this month. They expect that after the report, the direction of gold will be clearer.

XAU plummeted without stoppingXAU dropped sharply in the context of investors being cautious before the US announced important information about the economic situation. Money flows betting on the USD as US Federal Reserve (Fed) officials remain hawkish, determined to step up the fight against inflation.
After each statement by a Fed official, the USD strengthens, thereby putting downward pressure on gold prices.
The USD is also supported by efforts to cut interest rates early by many major central banks in the world, including the ECB of Europe and Canada...
Recently, the USD is not only stable at a high level but also tends to increase in price.

DXY fluctuations lead to gold falling sharplyGold dropped sharply withinside the context of traders being careful earlier than americaA introduced crucial records approximately the monetary situation. Money flows making a bet at the USD as US Federal Reserve (Fed) officers stay hawkish, decided to step up the combat towards inflation.
After every announcement with the aid of using a Fed official, the USD strengthens, thereby placing downward stress on gold prices.
The USD is likewise supported with the aid of using efforts to reduce hobby quotes early with the aid of using many essential important banks withinside the world, along with the ECB of Europe and Canada...
Recently, the USD isn't most effective strong at a excessive stage however additionally has a tendency to boom in price.

BTCUSDT - at his most awaited area, will hold it or not??#BTCUSDT... first of all congratulations to all,
the rest moved exactly as i was expecting and this market area 58000, if tell you about it , it can be the swing area of the market.
if market hold that area then well and good but if the market break it then there is a long sell below.
so guys watch this area carefully and never hold your buying's below this area.
good luck
trade wisely

GOLD- bull run exhaust ? What's next?#GOLD... Well guys market placed 2365 plus as day high in yesterday.
That is our channel neck line as we discussed in our last idea,
And that is our cut n reverse area as we discussed in our video analysis.
So keep close it if market hold it then drop expected from here.
In case market break that area then selling will invalidate and as I told you above 2365 is your cut n reverse area.
Good luck
Trade wisely

SILVER - there is one n only area, again holding??#SILVER - perfect move as per our videoanalysis and first of all congratulationsand now price again at your one of themost important support for today.
That is 29.02 03
Keep close it we told you again n againabout that supporting area if marketclear that level then a smooth dropexpected below that.
Otherwise not at all.
Don't float your buyings below that area.
Good luck
Trade wisely

SILVER - where is today support? repeat or not??#SILVER.. perfectly holding his pattern so far as we discussed in our video analysis, watch kneely that pattern ,
its market 3rd time, it will again follow at 3rd time or not,
what ever market done but you should have to keep close your channel area and upside our last day resistance,
if market follow his pattern in that cast you can see again bounce from here, other wise not at all.
good luck
trade wisely

+4R Textbook trade breakdown☝️Do not act based on my analysis, do your own research!!
The main purpose of my resources is free, actionable education for anyone who wants to learn trading and improve mental and technical trading skills. Learn from hundreds of videos and the real story of a particular trader, with all the mistakes and pain on the way to consistency. I'm always glad to discuss and answer questions. 🙌
☝️ALL ideas and videos here are for sharing my experience purposes only, not financial advice, NOT A SIGNAL. YOUR TRADES ARE YOUR COMPLETE RESPONSIBILITY. Everything here should be treated as a simulated, educational environment. Important disclaimer - this idea is just a possibility and my extremely subjective opinion. Do not act based on my analysis, do your own research!!

BTCUSD - Yes, Bitcoin Will Break its highs but what's next ??🤔Hello traders,
Bitcoin is moving inside the 60k- 74k range making a complex ABC correction. We are currently in wave B and expecting it to finish above the recent all-time highs and at the -1 Fibonacci level.
Short Entry:
- Watch the rejection at -1 fib level
- Entry at breakout of ascending trendline
- Stoploss: Above the highs after entry
- Target: Previous lows ( 61k )
Goodluck and trade safe!

BOOK OF MEME alert went off !!!BOME ... ... update ... READY ...
alert went off
stop loss 0.012142
targets 0.017655 / 0.021989 / 0.025605
Been Really busy with my live streams but wanted to
get this chart out to you on tradinview
*** stop loss not recommended but on chart for
traders that don't want to add to entry or have to
wait for price action ( PA ) to return to entry area ( breakeven point )
Not Financial Advice

🎮💹 GALA Trading Strategy - Spot Trades and Laddering! 🚀📊🔍 Strategy Overview:
Condition: Price bounced from the $0.035 - $0.0385 support area.
Entry Criteria: Ladder into the trade within the support zone.
Targets: Aim for the next resistance levels at $0.043 - $0.045 or $0.049 - $0.051.
Risk Management: Set stop-loss just below $0.035.
📢 Analysis: Considering BTC's overbought conditions, a cautious approach with spot trades and laddering can help manage risks effectively. Stay vigilant and adapt to market dynamics. 🌐🚀 #GALA #CryptoTrading #RiskManagement 💰📈

ETHUSD (D) may experience a decline to the $26K-$26.5KCOINBASE:ETHUSD ETHUSD may experience a decline to the $26K-$26.5K
ETHUSD (D) may experience a decline to the price range of $26K-$26.5K. This assessment is grounded in the following observations:
RSI divergence at both the peak and trough of the recent uptrend indicates a weakening bullish pressure relative to selling pressure.
The non-breaking of the MA50 support on the initial attempt is a typical response but also suggests a reevaluation of the prevailing trend.
The abrupt and notable decline, swiftly moving from the $26K price range to $22.4K, raises substantial concerns compared to the preceding ascent.
Despite a robust price increase, recent volume has not demonstrated remarkable strength, highlighting the presence of numerous unsustainable FOMO factors.
RSI resides in the overbought zone, signaling the potential for a price correction at this stage (yet to be confirmed as a trend reversal).
The nearest price support zone lies within the range of $26K-$26.5K, presenting an opportune level for this corrective phase.

Trading Strategy for #DAO/USDT Amidst Falling Wedge Breakout and"📈 #DAO/USDT Chart Update: Breakout from Falling Wedge, Retest Underway 🚀
The DAO token has recently broken out of a falling wedge pattern, signaling a potential reversal and bullish momentum. Currently in the retest phase, this presents an entry opportunity for traders.
🔍 Entry Strategy:
Planning to buy at the current market price (CMP) and considering additional purchases at 1.09$ during the retest.
🎯 Targets:
TP1: 1.26$
TP2: 1.33$
TP3: 1.5$
TP4: 1.8$
🛑 Stop Loss (SL):
Set at 1.0292$ to mitigate potential losses in case of adverse price movements.
It's crucial to emphasize the importance of conducting your own research (DYOR) before making any trading decisions. This information is provided for analysis purposes and not as financial advice. Stay informed and trade responsibly! 🚀"

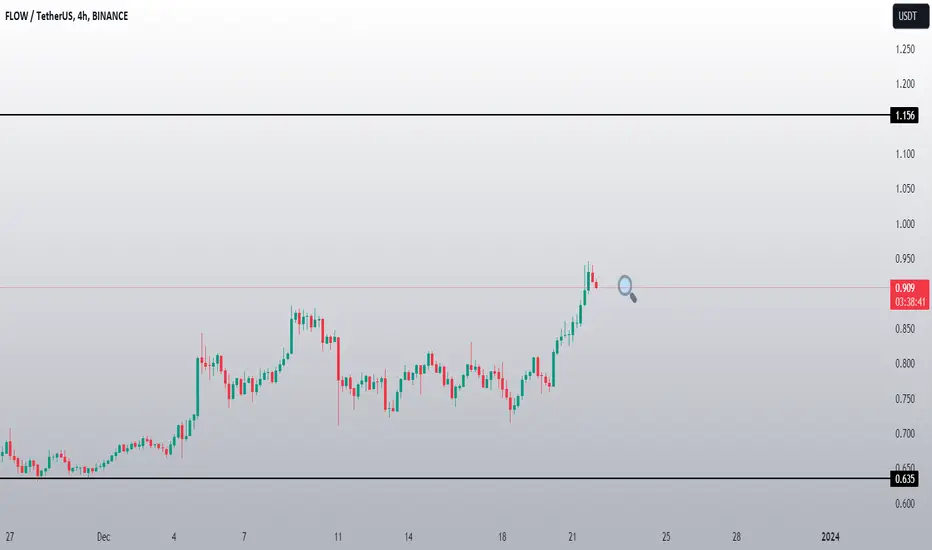
FLOW VOLUME INCREASE Thank you for reading this update.
Depending on our study we see that FLOW has a good chance of volume increase.
This updates depending on day trade, And the market should confirm with time the right market way.
#Nottradingadvice
#For Day traders take always profits when the market increase
#Expect nothing from the markets, but follow what it shows.
BEAMX BREAK START VOLUMEThank you for reading this update.
Depending on our study we see that BEAMX has a good chance of volume increase.
This updates depending on day trade, And the market should confirm with time the right market way.
BEAMX is a new coin.
#Nottradingadvice

Boeing Stairsteps for Swing TradingNYSE:BA has the most powerful and longest momentum run of all of the 30 Dow components. The company reports earnings on January 24th and the run up implies that the 4th quarter is likely to be better than previous quarters in 2023.
This stock has moved strongly since the bottom in November and has been able to pattern out some of the speculation with stairsteps to keep the run moving upward beyond the resistance level of its range trend.
Some of this movement upward is ETF developers building more ETF units for certain industries and corporations.
Profit-taking is likely soon for this swing trade as it nears the long-term resistance at the 2021 highs. However, there is now support from the range of the August highs.

XRP SHOWING NEW BREAK POSSIBLITYThank you for reading this update.
Depending on our study we see that XRP has a good chance of volume increase.
This updates depending on day trade, And the market should confirm with time the right market way.
XRP known from a stable coin that takes time before it increase also it needs much higher marketcap than the most regulare coins.
#Nottradingadvice
#For day traders take always profits when market increase
#Expect noting from the markets, but follow what it shows.

VRTX NEW VOLUME STARTThank you for reading this update.
Depending on our study we see that VRTX has a good chance of volume increase.
This updates depending on day trade, And the market should confirm with time the right market way.
#Nottradingadvice

POWR NEW VOLUME INCREASEThank you for reading this update.
Depending on our study we see that POWR has a good chance of volume increase.
This updates depending on day trade, And the market should confirm with time the right market way.
#Nottradingadvice

RLC NEW VOLUME INCREASEThank you for reading this update.
Depending on our study we see that RLC has a good chance of volume increase.
This updates depending on day trade, And the market should confirm with time the right market way.
#Nottradingadvice

Is GBPAUD now in a larger range? On the Daily chart (right panel) you can see the wedge GBPAUD has been respecting until Tuesday when a large sell of caused it to close outside. After a flush down on AUD news Wednesday, it saw strong buying pressure which looks to be resuming today after a drop early London.
I'm now starting to look at the 30m range from 1.9060 to 1.9320 as the way to play this. There is a decent way to go before we get to the top of the range, but it could manage it tomorrow given the 21 day ExMo is 140. At which point I may look to buy a Put for next week, and trade the intra-day price action on Monday as a way to gain exposure to potential downside without having to hold the over night risk on a tradition position.
Overall well worth watching as the Aussie pairs have been moving nicely in recent weeks and we want to capitalise on that while we can.
