Trading opportunity for KASUSDTBased on technical factors there is a Sell position in :
📊 KASUSDT
🔴 Sell Now
🪫Stop loss 0.11000
🔋Target 0.06767
📏 R/R 2
💸RISK : 1%
We hope it is profitable for you ❤️
Please support our activity with your likes👍 and comments📝
Tradingsignals

GBPUSD - NEXT STOP @1.34343? [UPDATE]TRADE UPDATE
As planned for the week price traded to my POI just as i'd anticipated (without getting to my DOL first) so i took my Long Position and it got to my TP for a quick 1:3RR.
KEY TAKEAWAY
I followed my plan and waited for price to come to my level without chasing it(even after the quick spike up to begin the week).
Patience Pays!

Gold Analysis April 22Gold is having a slight correction after touching the round resistance level of 3500.
The candlestick force on the h1 time frame is supporting gold to increase again at the end of the European session. Pay attention to the breakout zone around 73 and the ATH zone around 3500 for Sell strategies. Break 3500, do not SELL anymore but wait until 3520.
The buying strategy may be more preferred for traders. The zones where the buyers have appeared in the past are 3435-3408-3385-3355. Pay attention to whether the candlestick force is really strong before making a long-term buying decision.

Bitcoin Laguerre Weekly Setup – Road to $110K or Breakdown Risk?📈 Idea:
Bitcoin continues to hold above key weekly support, consolidating after its recent move up. Using the Laguerre system as confirmation, we’re now watching a high-stakes setup with two clear paths:
🔸 Bullish Scenario:
A breakout from the current wedge structure could ignite momentum toward the $110,000 target zone, aligning with Laguerre mid-band strength and upper Bollinger expansion. That orange line is the roadmap — breakout, retest, push.
🔻 Bearish Risk:
If price fails to hold the ~$80K region, the structure breaks down — risk increases sharply. The 50-week EMA and Laguerre zone below offer possible support, but the setup weakens significantly.
🧠 Why It Matters:
Laguerre momentum curling up from key zones
Clean trend structure with well-defined risk
Weekly compression often leads to expansion
🎯 Target: $110,000
🛑 Risk Line: $80,000
📅 Timeframe: Weekly
🔍 System: Laguerre + Trend Structure
Drop your thoughts 👇
Are we gearing up for the next leg or prepping for a flush?
#Bitcoin #BTC #Crypto #Laguerre #TradingView #WeeklySetup #JTraderEdge

Gold Price Analysis April 21Gold price is currently at ATH and trading strategy is difficult. Gold is facing the round port level of 3400 and the lower boundary is the Break out zone around 3386. Any pullback of gold is considered as an opportunity to buy 3420 can be considered as today's boundary.

T Trading Guide 4/21/25AT&T (T) Trading Analysis for Monday, April 21, 2025
Sentiment Analysis
-Overview: Sentiment on X and StockTwits is neutral, with investors appreciating T’s 4.11% dividend yield but expressing concerns over tariff-driven cost increases. Analyst consensus remains stable, with a “Hold” rating and a $21.50 target (April 20 ), though some Reddit (r/options) users highlight margin pressures from tariffs.
-Implication: Mixed sentiment suggests range-bound trading absent a catalyst, with tariff concerns capping upside potential.
Strategic Outlook
-Assessment: The outlook for Monday is neutral, supported by balanced options activity, oversold technicals with potential for a bounce, and a VIX at ~40 indicating volatility.
-Implication: Anticipate a price range of $26.50 to $27.50, with support at $26.50 likely to hold and resistance at $27.50 posing a challenge for bulls.
Market Influences
-Overview: No new Federal Reserve decisions today; recent guidance on April 17 signals caution on rates, potentially impacting telecom spending. T’s earnings are due April 23, with a consensus EPS of $0.52 (April 20 ). Social media chatter on X and WallStreetBets focuses on dividend stability, though some Reddit users note tariff risks (10% baseline). No M&A news has surfaced.
-Implication: Earnings anticipation and tariff pressures suggest cautious trading, likely keeping T within a tight range on Monday.
Price Context
-Overview: Current price at $27.15. The stock has declined 4% over the past month from $28.30 on March 31 and is up 13% year-over-year from $24.02 in April 2024. Support lies at $26.50, with resistance at $27.50.
-Implication: Recent declines indicate limited upside; a break below $26.50 could signal further downside to $26.00.
Technicals:
Monthly: RSI at 45 (neutral), Stochastic at ~40 (neutral), MFI at ~42 (neutral). Price below 10/20-month SMAs ($28.00/~$29.00, bearish).
Implication: Long-term bearish trend with neutral momentum.
Weekly: RSI at 42 (neutral), Stochastic at ~35 (neutral), MFI at ~38 (neutral). Price below 10/20-day SMAs ($27.50/~$28.00, bearish).
Implication: Bearish trend with neutral momentum, suggesting consolidation for weekly contracts.
Daily: RSI at 40 (neutral), Stochastic at ~30 (neutral), MFI at ~35 (neutral). Price below 10/20-day SMAs ($27.20/~$27.50, bearish).
Implication: Daily trend bearish, but oversold conditions may support a bounce.
4-Hour: RSI at 43 (neutral), Stochastic at ~38 (neutral), MFI at ~40 (neutral). Price below 10/20-period SMAs ($27.10/~$27.20, bearish).
Implication: Medium-term bias bearish, aligning with weekly caution.
Hourly: RSI at 46 (neutral), Stochastic at ~42 (neutral), MFI at ~44 (neutral). Price below 10/20-hour SMAs ($27.05/~$27.10, bearish).
Implication: Intraday bias bearish, suggesting potential selling pressure.
10-Minute: RSI at 48 (neutral), Stochastic at ~45 (neutral), MFI at ~46 (neutral). Price below 10/20-period SMAs ($27.00/~$27.05, bearish).
Implication: Short-term bias bearish, supporting a cautious weekly stance.
Options Positioning
Overview: Weekly options show balanced volume ($27.00 calls: 800 contracts, 50% at ask; $26.50 puts: 900 contracts, 55% at bid), with a put-call ratio of 1.1 (neutral) and IV skew flat ($27.00 calls/puts: 35%). Monthly options have a put-call ratio of 1.0, IV flat ($27.00: 32%). 3-Month options show a put-call ratio of 1.2, IV flat ($26.50: 30%). VIX at ~40 (down 5%, above 30-day average of ~35).
Option Flow Dynamics (OFD) Analysis:
Vanna:
-Impact: Minimal, ±$0.02 intraday.
-Insight: Balanced call/put volume and flat IV skew at 35% result in negligible delta adjustments by dealers, even with a VIX of 40.
-Stance: Neutral for weekly contracts; bullish if IV exceeds 38%.
Charm:
-Impact: Pins price ±$0.02, minimal volatility.
-Insight: High open interest at $27.00 (calls: 2,000 contracts, puts: 2,200 contracts) leads dealers to maintain delta neutrality, pinning the price near expiry.
-Stance: Neutral for weekly contracts; bearish if price breaks above $27.50.
GEX (Gamma Exposure):
-Impact: Pins price ±$0.05, minimal volatility.
-Insight: Balanced gamma from equal call/put open interest at $27.00 keeps price stable, though a VIX of 40 could amplify breakout volatility.
-Stance: Neutral at $27.15 for weekly contracts; bearish above $27.50.
DEX (Delta Exposure):
-Impact: No directional bias.
-Insight: A put-call ratio of 1.1 indicates balanced delta exposure, with dealers’ hedging activities netting zero directional impact.
-Stance: Neutral for weekly contracts, even on high volume.
OFD Summary: Weekly flows indicate a neutral bias, with price likely to remain within $26.50-$27.50, driven by balanced Vanna, Charm, GEX, and DEX dynamics. A VIX of 40 suggests potential volatility; earnings on April 23 could push IV above 38%, adding $0.05-$0.10 upside (Vanna). Monthly and 3-month expiries (put-call ratios 1.0 and 1.2) confirm range-bound confluence.
-Implication: Neutral bias for weekly contracts; high VIX suggests volatility within the $26.50-$27.50 range for Monday.
ICT/SMT Analysis
-Overview: Weekly: Neutral, support at $26.50, resistance at $27.50, SMT divergence versus VZ shows relative strength. Daily: Neutral, FVG $27.50-$28.00, OB $26.00. 4-Hour: Neutral, MSS below $27.15, liquidity below $26.50. 1-Hour: Neutral, MSS below $27.15, liquidity below $26.50. 10-Minute: OTE sell zone $27.20-$27.30 (Fib 70.5%), target $26.50.
-Implication: Neutral across timeframes; a breakdown below $26.50 could target $26.00, but weekly contracts are likely to see consolidation.
Edge Insights
-Institutional Flows: Recent block trades (April 18 ) show balanced buying and selling at $27.00, suggesting institutions are hedging rather than taking a directional stance.
-Sector Stability: Telecom sector is down only 5% YTD (Morningstar ), providing relative stability compared to other sectors, though tariff costs remain a headwind for T.
-Earnings Catalyst: With earnings due April 23, pre-earnings positioning may increase volatility, potentially favoring a breakout above $27.50 if sentiment shifts positively.
-Implication: Sector stability supports a neutral weekly stance, but monitor for pre-earnings IV spikes that could shift dynamics.
Trade Recommendation Analysis:
-Neutral: 50% likelihood (balanced options flows, GEX pinning at $27.15, high VIX choppiness).
-Bearish: 30% likelihood (MSS below $27.15, tariff pressures).
-Bullish: 20% likelihood (oversold indicators, potential bounce above $27.50).
-Action: Recommend a neutral stance with a bearish tilt; if bearish, buy $27.00 puts (weekly expiry) at ~$0.20, targeting $0.40, with a stop at $0.10 if T breaks $27.50. Risk $40 (2% of a $2,000 account).
Conclusion for Monday: T is poised for range-bound trading within $26.50-$27.50, driven by neutral options flows and tariff concerns. Focus on a potential breakdown below $26.50 for weekly bearish trades, targeting $26.00. High VIX and impending earnings add risk—execute with tight stops to manage volatility.

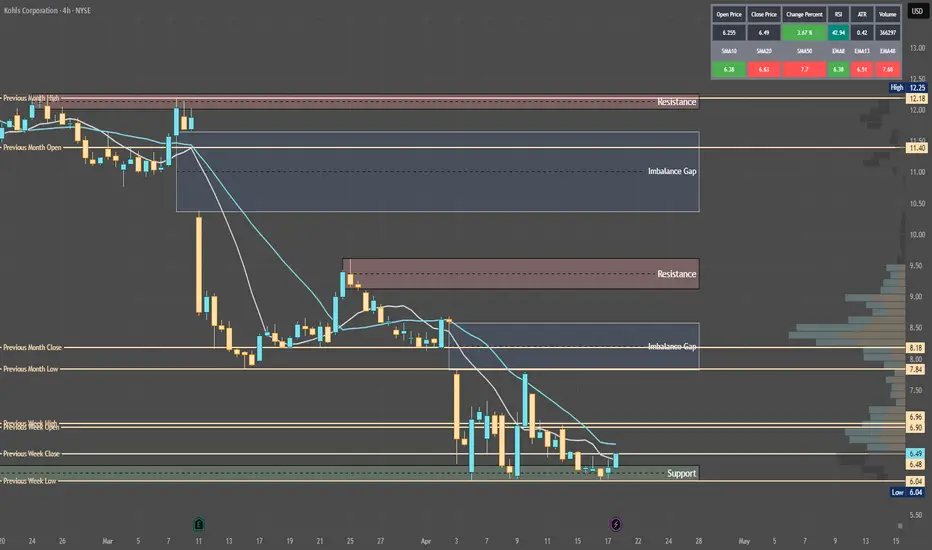
KSS Trading Guide 4/21/25Kohl's Corporation (KSS) Trading Analysis for Monday, April 21, 2025
Sentiment Analysis
----Overview: Sentiment on platforms like X and StockTwits leans bearish, driven by tariff concerns and Kohl’s weakening fundamentals, with projected sales declines of 5-7% in 2025. JP Morgan’s Underweight rating and $7 price target as of April 14 underscore margin pressures, though a ~12% dividend yield provides some appeal for income-focused investors.
----Implication: The prevailing negative sentiment, coupled with macroeconomic headwinds, is likely to exert downward pressure on KSS, overshadowing the dividend’s stabilizing effect.
Strategic Outlook
----Assessment: The outlook for Monday is bearish, fueled by significant put activity in weekly options, persistently oversold technical indicators without reversal signals, and a VIX at ~40, reflecting heightened market volatility.
----Implication: Anticipate a price range of $6.20 to $6.50, with a risk of breaching support at $6.20, potentially driving the stock toward $5.80 if bearish momentum persists.
Market Influences
----Overview: No new Federal Reserve decisions today; however, recent guidance on April 17 signals a cautious approach to rates, which could dampen retail spending. Kohl’s next earnings are scheduled for May 21, per TradingView data. Fitch Ratings downgraded KSS from BB to BB- on April 7, citing financial strain. Social media discussions on X, WallStreetBets, and StockTwits remain bearish, focusing on the impact of 10% baseline tariffs on margins. Additionally, the departure of Chief Technology Officer Siobhán Mc Feeney on April 1 introduces further uncertainty.
----Implication: The absence of positive catalysts, combined with tariff pressures and leadership changes, solidifies a bearish outlook for Monday.
Price Context
----Overview: Current price at $6.48. The stock has declined 21% over the past month from $8.20 on March 31 and is down 73% year-over-year from $23.94 in April 2024. Support lies at $6.20 (recent low on April 17), with resistance at $6.89 (April 14 open).
----Implication: Recent declines, driven by tariffs and executive turnover, suggest continued downward pressure, with a break below $6.20 likely to accelerate losses.
Technical Indicators
Monthly: RSI at 22 (oversold), Stochastic at ~12 (oversold), MFI at ~18 (oversold). Price below 10/20-month SMAs ($8.50/~$9.50, bearish).
Implication: Long-term bearish trend with extreme oversold conditions, yet no reversal signal is evident.
Weekly: RSI at 27 (oversold), Stochastic at ~17 (oversold), MFI at ~20 (oversold). Price below 10/20-day SMAs ($6.70/~$6.90, bearish).
Implication: Bearish trend confirms downside bias for weekly contracts.
Daily: RSI at 30 (nearing oversold), Stochastic at ~15 (oversold), MFI at ~22 (oversold). Price below 10/20-day SMAs ($6.40/~$6.50, bearish).
Implication: Daily trend supports weekly bearish bias.
4-Hour: RSI at 35 (nearing oversold), Stochastic at ~18 (oversold), MFI at ~28 (nearing oversold). Price below 10/20-period SMAs ($6.30/~$6.40, bearish).
Implication: Medium-term bias aligns with weekly outlook.
Hourly: RSI at 32 (nearing oversold), Stochastic at ~15 (oversold), MFI at ~25 (oversold). Price below 10/20-hour SMAs ($6.35/~$6.40, bearish).
Implication: Intraday bias supports weekly trade direction.
10-Minute: RSI at 38 (neutral), Stochastic at ~20 (oversold), MFI at ~30 (nearing oversold). Price below 10/20-period SMAs ($6.45/~$6.47, bearish).
Implication: Short-term bias reinforces weekly contract setup.
Options Positioning
Overview: Weekly options show high put volume at $6.50 (1,500 contracts, 70% at bid), with a put-call ratio of 2.5 (bearish) and IV skew favoring puts ($6.50: 50%, rising). Monthly options have a put-call ratio of 2.0, with put IV rising ($6.00: 48%). 3-Month options show a put-call ratio of 2.3, with put IV rising ($5.50: 45%). VIX at ~40 (down 5%, above 30-day average of ~35).
Option Flow Dynamics (OFD) Analysis:
Vanna:
Impact: -$0.10 intraday.
Insight: Rising put IV at 50% compels dealers to sell shares to hedge delta as IV increases, exerting downward pressure. A VIX of 40 heightens this effect.
Stance: Bearish for weekly contracts; neutral if IV falls below 48%.
Charm:
Impact: Pins price ±$0.05, adds $0.03 volatility.
Insight: High put open interest at $6.50 prompts dealers to sell shares to maintain delta neutrality near expiry, pinning the price with minor volatility.
Stance: Bearish for weekly contracts; neutral if price holds $6.50.
GEX (Gamma Exposure):
Impact: Pins price ±$0.10, adds $0.05 volatility.
Insight: Negative gamma from elevated put open interest drives dealers to sell shares on price declines, pinning at $6.50 while adding volatility on breakouts.
Stance: Bearish below $6.50 for weekly contracts; neutral at $6.50.
DEX (Delta Exposure):
Impact: $0.20-$0.30/day downward pressure.
Insight: High put open interest creates a delta imbalance, compelling dealers to sell shares on price drops, adding consistent downward pressure.
Stance: Bearish for weekly contracts, particularly on high volume.
OFD Summary: Weekly flows signal a bearish bias, with $0.30-$0.50 downward pressure driven by Vanna and DEX selling. Pivot at $6.50; weekly range $6.20-$6.50 (pinning). A VIX of 40 amplifies downside risk, and a break below $6.20 could trigger $0.15 volatility (GEX). Monthly and 3-month expiries, with put-call ratios of 2.0 and 2.3, provide bearish confluence.
Implication: Bearish bias for weekly contracts; elevated VIX suggests downside volatility, with a $6.20-$6.50 range for Monday.
ICT/SMT Analysis
Overview: Weekly: Bearish, support at $6.20, resistance at $6.89, SMT divergence versus WMT confirms weakness. Daily: Bearish, FVG $6.50-$6.89, OB $5.80. 4-Hour: Bearish, MSS below $6.48, liquidity below $6.20. 1-Hour: Bearish, MSS below $6.48, liquidity below $6.20. 10-Minute: OTE sell zone $6.50-$6.60 (Fib 70.5%), target $6.20.
Implication: Bearish across all timeframes; a breakdown below $6.20 is likely, aligning with the weekly contract setup.
Edge Insights
Dark Pool Activity: Large sell orders at $6.50 in recent dark pool prints (April 18) indicate institutional bearishness, potentially increasing selling pressure if retail traders follow suit on Monday.
Sector Dynamics: The consumer discretionary sector is down 17.8% year-to-date (Morningstar); Kohl’s heavy reliance on imported goods amid tariffs makes it more vulnerable than peers like Walmart, which benefits from stronger domestic sourcing.
Short Interest Pressure: Short interest at ~45% of float (MarketBeat) raises the risk of a short squeeze if the price breaks above $6.89, though current momentum favors shorts targeting $6.20.
Implication: Institutional selling and sector weakness reinforce the bearish bias for weekly puts; remain vigilant for a potential squeeze if the price approaches $6.89.
Trade Recommendation
Analysis:
Bearish: 55% likelihood (negative MSS, OFD flows, tariff pressures).
Neutral: 30% likelihood (GEX pinning at $6.50, high VIX choppiness).
Bullish: 15% likelihood (oversold indicators, potential bounce above $6.89).
Action: Recommend a bearish weekly trade below $6.20, targeting $5.80. Purchase $6.50 puts (weekly expiry) at ~$0.25, aiming for $0.50, with a stop at $0.15 if KSS breaks $6.60. Risk $50 (2.5% of a $2,000 account).
Conclusion for Monday: Kohl’s faces a bearish trajectory driven by tariff pressures, negative options flows, and leadership uncertainty. The recommended strategy focuses on a breakdown below $6.20 for weekly bearish trades, targeting $5.80. Elevated VIX and institutional selling add risk—execute with tight stops to manage volatility.
GBPUSD - bottom out pattern going on? What's next??#GBPUSD - perfect move as per our last couple of ideas regarding #GBPUSD
and now in current situation we have 1.3220 as immediate supporting and below that 1.3140
If market holds that supporting areas then we can expect further bounce towards 1.3500 and after that 1.3700 , 1.3900 n upto 1.4200
So stay sharp and don't be lazy here..
Good luck
Trade wisley

“Does size matter?” when it comes to backtesting?It’s the kind of question that gets a few smirks, sure. But when it comes to backtesting trading strategies, it’s not a joke, it’s the difference between confidence and false hope.
Let’s get real for a minute: the size of your candles absolutely matters.
What you don’t see can hurt you
Most people start testing on bigger timeframes. It’s faster, easier on the eyes, and the results look clean. But clean doesn’t mean correct.
Larger candles blur the details. That one nice-looking 4-hour candle? Inside, price could’ve spiked, reversed, chopped around, or triggered your stop before closing where it did. You’d never know. And that’s the problem.
You might think your entry worked beautifully… but only because the data smoothed out everything that actually happened.
A backtest should feel like a real trade
Trading isn't just about the final price. It’s about what price does to get there. That messy movement inside the candle? That’s where most trades are made or broken.
If your strategy is even remotely reactive, waiting for structure, confirmation, retests, or anything time-sensitive, you need to see what price did between the open and close.
And the only way to see that? Use smaller candles.
Smaller data, clearer picture
1-minute candles might look overwhelming at first, but they give you something the higher timeframes just can’t: behavior.
Not just outcomes. Not just win/loss stats. But the actual shape of the move, the hesitation, the fakeouts, the precise moment when the trade made sense—or didn’t.
And once you start testing with that level of detail, your strategy either earns your trust… or shows its cracks.
So how small should you go?
There’s no one-size-fits-all here. But as a general rule: if your idea relies on precision, go small. Test it on 1-minute or 5-minute charts, even if you plan to execute on higher timeframes. You’ll quickly see if the entry makes sense, or if you’ve been relying on candle-close hindsight.
Yes, it takes longer. Yes, you’ll stare at noisy charts for hours. But your strategy will thank you.
Watch out for “too good to be true”
One last thing, if your backtest results look flawless on 1h or 4h candles, pause. That’s often a sign that you’re testing a story, not a strategy.
Zoom in. See what actually happens. You might be surprised at how different the same trade looks when you’re not glossing over the details.
TL;DR:
In backtesting, size absolutely matters. Smaller candles reveal real behavior. Bigger ones hide the truth. So if you care about how your strategy actually performs not just how it looks.
go smaller. Your backtesting will get sharper, and your confidence? Way more earned.

Bitcoin’s Breakout Blueprint: Eyeing $92KAs of April 20, 2025, Bitcoin (BTC) is trading around $84,500, having recently tested the $92,000 level multiple times. This price point is significant, serving as both a psychological barrier and a technical resistance level.
Technical Analysis:
Resistance and Support Levels: Bitcoin has encountered resistance near $92,000, a level that has been tested repeatedly. A sustained move above this could open the path toward $100,000 and potentially $108,000, the previous all-time high from December 2024. On the downside, support is observed around $85,650, aligning with the 200-day EMA. Further support lies at $78,000 and $74,500, marking previous consolidation zones.
Chart Patterns: The formation of a bullish pennant on the daily chart suggests potential for an upward breakout. If confirmed, this pattern could propel BTC toward $137,000 by Q3 2025.
Volume and Momentum: Recent trading volumes have been moderate, with a slight uptick during price advances, indicating growing buyer interest. Momentum indicators, such as the RSI, are neutral, leaving room for further price movements in either direction.
Fundamental Factors:
Institutional Inflows: Significant capital inflows into Bitcoin ETFs, exceeding $70 billion, have been observed, reflecting strong institutional interest.
CryptoRank
Macroeconomic Environment: Liquidity injections by the U.S. Treasury, amounting to $500 billion since February 2025, have increased market liquidity, which historically correlates with Bitcoin price appreciation.
Halving Effect: The April 2024 Bitcoin halving event has reduced the supply of new BTC, a factor that has historically led to substantial price increases in subsequent months.
Mid-Term Outlook:
Considering the technical and fundamental factors, Bitcoin's mid-term target remains at $92,000. A decisive break above this level could lead to a retest of the $100,000 psychological barrier and potentially higher targets. However, failure to maintain support above $85,650 may result in a consolidation phase or a retest of lower support levels.
Investors should monitor key resistance and support levels, institutional investment trends, and macroeconomic indicators to assess Bitcoin's trajectory in the coming months.

Gold Analysis April 17Another day of half-full D candle increase but today there is a bearish wave appearing
The h4 frame has shown signs of sellers jumping into the market and H1 also formed bearish waves.
The bearish wave formed with support 3322. Breaking 3322 is very easy to form a strong bearish wave but the necessary condition is that the 3315 zone will have to be broken. If 3315 increases, 3338 is the zone that the Sellers are also waiting for. 3354-3355 ATH zone will still have a reaction from the Sellers before creating a new ATH.
Trading zone when there is confirmation
Price zones to pay attention to BUY 3315, 3293, 3275
Price zones to pay attention to SELL 3337, 3354

Trading opportunity for SOLUSDTBased on technical factors there is a Sell position in :
📊 SOLUSDT
🔴 Sell Now
🪫Stop loss 151.00
🔋Target 97.00
📏 R/R 2
💸RISK : 1%
We hope it is profitable for you ❤️
Please support our activity with your likes👍 and comments📝

Nifty 50 Trendline Breakout – Retest Buy Setup📌 Trade Setup:
✅ Entry (Buy) Zone:
Buy on retest: Around 23,750–23,850 (previous resistance and breakout zone).
Aggressive buy: Market price at 23,849, but risk-reward is slightly unfavorable here.
🎯 Target (Short-term Swing):
Target 1: 24,200 (minor resistance)
Target 2: 24,800 (next major swing high zone)
🛑 Stoploss:
Conservative: Below 23,000 (safe below breakout and 50 EMA)
Aggressive: Below 23,200
for educational purposes only

Gold Target $4054 Year 2025-2026 With Reasons & 4$rules.1st Tp completed at 3341
2nd Tp 3437
3rd Tp 3622
4th Tp 3747
Final target is $ 4054 for Year 2025 to 2027
Below the Base line mentioned in chart will be the Seller profit zone which is marked as 1st Support, 2nd Support, 3rd Support & 4th Major Support.
Current Major reasons mentioned in the chart and future will be running of food, drinking water crisis and health issues will remain on high alerts (after covid 19 and pollution issues) and Insurance companies profits will be on Top of every Monthly trading results.

ETHUSD Market Analysis – Short SetupI'm going short on ETHUSD based on current market structure and key resistance levels.
📉 Trade Details:
Entry Price: $1,649.43
Stop Loss: $1,656.60
Take Profit: $1,564.97
🧭 Reason for the Trade:
ETHUSD recently tapped a resistance zone near $1,650, which has acted as a supply area multiple times in the past. After a weak bullish push with low momentum, price started to stall showing signs of rejection with long upper wicks on the H4 candles.
This hints that sellers are stepping in and bulls are losing steam.
🔥 Why I’m Short:
Price rejected the $1,650 zone
Weak bullish candles near resistance
H4 shows bearish structure forming
Risk/reward ratio is solid
📍Risk Management:
I’m keeping things tight with my Stop Loss at $1,656.60 — just above the resistance zone. If price breaks above this, it means sellers are likely out of the game.
Take Profit is set at $1,564.97, right above a demand area and previous support. This gives the trade room to breathe while locking in profit before price bounces.

GOLD - single supporting area, holds or not??#GOLD.. now we have 3226 27 as single supporting area and if market hold it in that case we can expect a bounce from here otherwise below that we can expect again range bottom.
Good luck
Trade wisely

Trading opportunity for LINKUSDTBased on technical factors there is a Sell position in :
📊 LINKUSDT
🔴 Sell Now
🪫Stop loss 14.25
🔋Target 9.70
📏 R/R 1,5
💸RISK : 1%
We hope it is profitable for you ❤️
Please support our activity with your likes👍 and comments📝

ADA : This May Be Your Last Chance Before Exploding to Upside !!The ADA will increase 40 cents and reach to the top of the wedge in the coming weeks.
Give me some energy !!
✨We spend hours finding potential opportunities and writing useful ideas, we would be happy if you support us.
Best regards CobraVanguard.💚
_ _ _ _ __ _ _ _ _ _ _ _ _ _ _ _ _ _ _ _ _ _ _ _ _ _ _ _ _ _ _ _
✅Thank you, and for more ideas, hit ❤️Like❤️ and 🌟Follow🌟!
⚠️Things can change...
The markets are always changing and even with all these signals, the market changes tend to be strong and fast!!


USDCHF LongHi guys,
Hope everyone is still enjoying the lovely big profits we earned on gold, BTC, and EURUSD. We are yet to hit a stop loss this year, which is good.
Anyway, here is our long signal for EUR USD. Wait for the 5 minute candle to close above, and respect the entry.
USD CHF Buy 🦇
📊Entry: 0.81733
⚠️Sl: 0.81531
✔️TP1: 0.81938
✔️TP2: 0.82199
✔️TP3: 0.82530
✔️TP4: 0.82868
Hope you earn lots of profit. Please drop me a comment if you follow the signal
Best wishes
Sarah ETAforex

GBPUSD - its breakout? what's next??#GBPUSD.. as you know guys our area was 1.3035 and in first go market boke that area but then drop towards bottom due to tariff implantation.
now market again break our area in today so if that is clear breakout then we can expect a further bounce towards 3400 and 1.3500
good luck
trade wisely

Quantum's PLTR Trading GuideSentiment: Bullish. AI and government contract hype drives enthusiasm, though valuation risks noted. Chatter lean bullish, citing growth momentum.
Outlook: Neutral, slightly bearish. Options pin $88, with $85 puts active. ICT/SMT eyes $86-$88 buys to $92 if $86 holds. Bearish below $86 risks $80.
Influential News:
Federal Reserve: Two 2025 cuts aid growth stocks, positive for $PLTR.
Earnings: Q1 due early May; no update today.
Chatter: Bullish on AI/contracts, some warn of pullback.
Mergers and Acquisitions (M&A): No confirmed NASDAQ:PLTR M&A; partnership expansions rumored.
Other: Tariff volatility hit tech; NASDAQ:PLTR resilient.
Indicators:
Weekly:
RSI: ~75 (overbought).
Stochastic: ~85 (overbought).
MFI: ~80 (overbought).
SMAs: 10-day ~$86 (above, bullish), 20-day ~$85 (above, bullish).
Interpretation: Overbought, bullish SMAs suggest pullback risk.
Daily:
RSI: ~72 (overbought).
Stochastic: ~80 (overbought).
MFI: ~75 (overbought).
SMAs: 10-day ~$86 (above, bullish), 20-day ~$85 (above, bullish).
Interpretation: Overbought, bullish SMAs but caution warranted.
Hourly:
RSI: ~70 (neutral).
Stochastic: ~75 (overbought).
MFI: ~70 (neutral).
SMAs: 10-day ~$86 (above, bullish), 20-day ~$85 (above, bullish).
Interpretation: Overbought, bullish momentum fading.
Price Context: $88.55, 1M: +2%, 1Y: +303%. Range $80-$92, testing $88 resistance.
Options Positioning (May 2025):
Volume:
Calls: $90 (10,000, 60% ask), $95 (8,000, 55% ask). Bullish bets on $90+.
Puts: $85 (7,000, 70% bid), $80 (5,000, 65% bid). Put buying grows.
Open Interest:
Calls: $90 (30,000, +5,000), $95 (20,000, +4,000). Bullish positions.
Puts: $85 (18,000, +3,000), $80 (15,000, +2,000). Hedging. Put-call ~0.7.
IV Skew:
Calls: $90 (45%), $95 (47%, up 3%). $95 IV rise shows upside bets.
Puts: $85 (40%, up 2%), $80 (38%). Rising $85 IV signals downside fear.
Probability: 60% $80-$92, 20% <$80.
Karsan’s Interpretation:
Vanna: Positive (~200k shares/1% IV). IV drop could pressure $88.
Charm: Positive (~100k shares/day). Pins $88.
GEX: +80,000. Caps upside.
DEX: +4M shares, bullish.
Karsan view: High GEX limits $92+; pullback to $85 likely.
ICT/SMT Analysis:
Weekly: Bearish at $88 OB, targets $85. Bullish > $92.
Daily: Bearish at $88 FVG, targets $85. Bullish > $90.
1-Hour: Bearish < $88, $85 target. MSS at $90.
10-Minute: OTE ($87-$88.50, $87.75) for sells, NY AM.
Trade Idea:
Bullish: 45%. ICT/SMT buys $86-$88 to $92. Options favor $90 calls. AI hype supports.
Neutral: 30%. $80-$92 range, balanced options.
Bearish: 25%. Below $85 likely with overbought signals. $85 put volume rises.

Quantum's NVDA Trading Guide 4/13/25Sentiment: Neutral. AI chip dominance drives optimism, but tariff risks and valuation concerns temper enthusiasm. Chatter posts split—bulls see growth, bears eye correction.
Outlook: Neutral, slightly bearish. Options pin $110, with $105 puts active. ICT/SMT eyes $108-$110 buys to $115 if $108 holds. Bearish below $108 risks $105.
Influential News:
Federal Reserve: Two 2025 cuts support growth stocks, positive for $NVDA.
Earnings: Q1 due May; no update today.
Chatter: Debates AI growth vs. tariff/supply chain risks.
Mergers and Acquisitions (M&A): No confirmed NASDAQ:NVDA M&A; AI chip partnerships rumored.
Other: Tariff volatility hit NASDAQ:NVDA ; stock swung (April 3-9).
Indicators:
Weekly:
RSI: ~50 (neutral).
Stochastic: ~45 (neutral).
MFI: ~40 (neutral).
SMAs: 10-day ~$112 (below, bearish), 20-day ~$115 (below, bearish).
Interpretation: Neutral, bearish SMAs signal weakness.
Daily:
RSI: ~48 (neutral).
Stochastic: ~50 (neutral).
MFI: ~45 (neutral).
SMAs: 10-day ~$112 (below, bearish), 20-day ~$115 (below, bearish).
Interpretation: Neutral, bearish SMAs suggest pullback.
Hourly:
RSI: ~45 (neutral).
Stochastic: ~55 (neutral).
MFI: ~50 (neutral).
SMAs: 10-day ~$112 (below, bearish), 20-day ~$115 (below, bearish).
Interpretation: Neutral, stabilizing.
Price Context: $110.93 (April 11), 1M: -9%, 1Y: +28%. Range $105-$120, testing $110 support.
Options Positioning (May 2025):
Volume:
Calls: $115 (12,000, 60% ask), $120 (10,000, 55% ask). Mild bullish bets.
Puts: $105 (8,000, 70% bid), $108 (6,000, 65% bid). Put selling supports $108.
Open Interest:
Calls: $115 (35,000, +6,000), $120 (25,000, +5,000). Bullish interest.
Puts: $105 (20,000, flat), $108 (22,000, +3,000). Hedging. Put-call ~1.0.
IV Skew:
Calls: $115 (40%), $120 (42%, up 3%). $120 IV rise shows upside hope.
Puts: $105 (35%, down 2%), $108 (36%). Falling $105 IV supports floor.
Probability: 60% $105-$120, 20% <$105.
Karsan’s Interpretation:
Vanna: Neutral (~300k shares/1% IV). IV drop could pressure $110.
Charm: Neutral (~150k shares/day). Pins $110.
GEX: +60,000. Stabilizes range.
DEX: +8M shares, neutral.
Karsan view: GEX holds $105-$120; tariff news key.
ICT/SMT Analysis:
Weekly: Neutral, $105 support, $120 resistance. No $NVDA/ NASDAQ:AMD divergence.
Daily: Bullish at $110 FVG, targets $115. Bearish < $108.
1-Hour: Bullish >$110, $115 target. MSS at $108.
10-Minute: OTE ($109-$111, $110) for buys, NY AM.
Trade Idea:
Bullish: 50%. ICT/SMT buys $108-$110 to $115. Options show $115 calls. Fed cuts aid.
Neutral: 35%. RSI (~50), SMAs (bearish), $105-$120 range.
Bearish: 15%. Below $105 possible with tariffs. $105 put volume grows
