XAUUSD Potential for a drop in 15min chart!Hey Guys,
To keep this analysis short and being able to publish it fast, I've considered a good potential zone for sell and price reaches to this area.
So based on this analysis we can consider a drop soon.
This post will be updated based on recent market movements.
Good luck! :)
Tradingsignals

Gold Price Analysis May 2D1 frame confirms closing below the disputed zone showing the downtrend continues to extend in the following days
The recovery in the Asian and European sessions can be a stepping stone for a decrease in the US session. Sellers are waiting for high price zones and old breakout zones to sell their goods. The 3271-3273 zone plays an important role in the bearish structure as long as this zone is held by the sellers, the possibility of a price increase is relatively low.
The barrier in the Asian session around 3257 will be where we consider the trading strategy. If the European session breaks this zone, we can buy at the target of 3271-3273. If the US session does not break this zone, SELL breaks it, the downtrend structure is broken and holds the BUY order until 3299. The daily resistance zone will be 3312. When 3371 is not broken, SELL and this is a good Swing signal to 3200. The possibility of a strong sell-off after Nonfarm is also understandable.
Strategy: If it does not break 3257 but falls, wait for the reaction at the border of 3243. When this zone is broken, the trend is broken, then we only SELL. If it increases from 3243, then maintain the above strategy with a better entry.

Gold Price Analysis May 1The D1 candle has broken out in a bearish direction. It is not surprising that the price broke Dow and decreased according to yesterday's Plan.
Gold confirmed the selling side won, so today's strategy is to watch for SELL. The SELL point pays attention to the 2 break zones of 3270 and 3302. The BUY point with the Scalping element pays attention to 3216 and today's main support is 3195.
The current trading strategy is that gold is approaching the 3237 resistance. If it confirms closing above this zone, it will give a BUY signal to 3251 and consider the price reaction of the US session. If it breaks 3241, it will hold until 3270. On the contrary, if it does not break 3237, it can SELL to 3216 and trade according to the noted port zones.

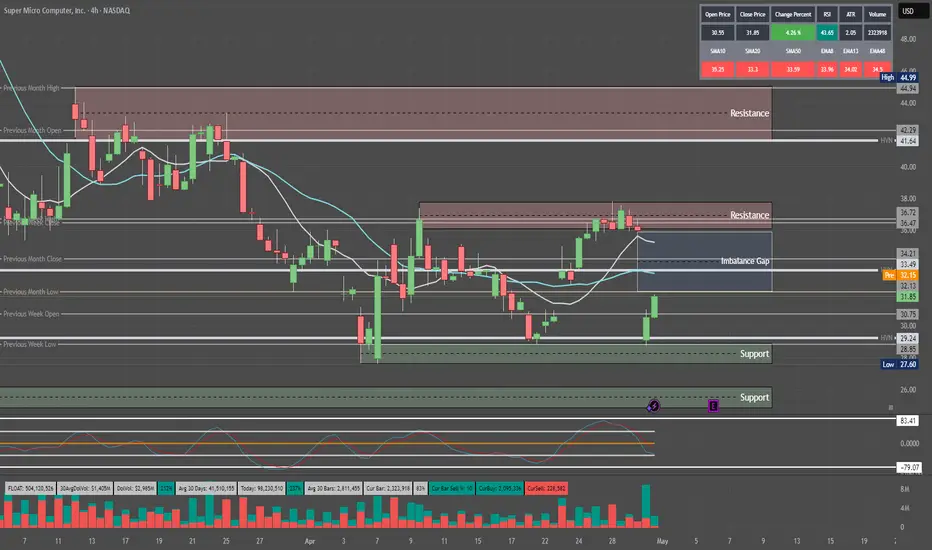
Quantum's SMCI Trading Levels 5/1/25Really don't understand this stock but retail really loves it. Seems like they want to push this to 36 for a possible run up into earnings before possibly dumping.
Nobody appreciates it !!!As you can see, the price is likely forming a Rounded bottom or cup and handle pattern. If our assumption is correct, we should wait for this patterns to break out to see a price increase.
Give me some energy !!
✨We spend hours finding potential opportunities and writing useful ideas, we would be happy if you support us.
Best regards CobraVanguard.💚
_ _ _ _ __ _ _ _ _ _ _ _ _ _ _ _ _ _ _ _ _ _ _ _ _ _ _ _ _ _ _ _
✅Thank you, and for more ideas, hit ❤️Like❤️ and 🌟Follow🌟!
⚠️Things can change...
The markets are always changing and even with all these signals, the market changes tend to be strong and fast!!

Gold Price Analysis April 30The market's D frame continues to maintain a fixed price range, with a dispute between buyers and sellers in the range of 3345 and 3275.
With the sideways wave in recent days, the possibility of creating a Dow and decreasing the price of Gold will be higher than increasing to ATH slightly. Gold has just reacted from 3000 candle wick area yesterday, which is also the old breakout area. Gold can push up to 3324 in the European session. If it does not break 3324, it is possible to SELL Gold to 3275. However, the sideways waves may have a relatively strong reaction around 3288 and the reaction area of 3300 is also weak but still need attention. If it breaks through 3324, Gold will find daily resistance around 3340 for the SELL strategy.

TAO/USDT – Long Setup ActivatedA potential bottom might be in place here.
🔍 Key confluences:
– Strong CVD rebound (spot + futures)
– Funding rate turning positive
– Top traders ratio shifting bullish (smart money buying the dip)
– Open Interest stabilizing after a clean flush
– And above all: my Scalp Cloud Signal just fired a bullish confirmation ✅
🎯 Targeting a short-term move to the 365–373 zone.
SL clearly defined below the local sweep.
💡 Tool used: Scalp Cloud Signal by The Degen Company
— Precision tool for scalping and micro trend shifts.

Gold: Bearish Shooting Star Reversal?The trend in gold is higher and no doubt it can go higher still.. BUT
There is a possible short setup
because:
A) It's very overbought relative to its weekly average
B) A Weekly shooting star reveral pattern took place on the weekly chart
C) The daily chart shows a possible breakdown
Thoughts?

CHF Supply Demand Trade SetupSee picture for analysis.
-DXY had long-term weak fundamentals + Technicals which will be bullish for CHF and other currencies.
-Price broke downward trend line
-Price removed opposing pivto supply zones structure
-Demand created
Options:
1) possible buy back into 1hr demand
2) Wait for price to reutn the wait for lower-timeframe confirmation buy setups.

#WALUSDT continues its bearish momentum 📢 As long as the price stays under $0.6000 — short BYBIT:WALUSDT.P bias remains valid.
📢 Watch for further weakness!
📉 SHORT BYBIT:WALUSDT.P from $0.5794
🛡 Stop loss: $0.6000
🕒 Timeframe: 1H
✅ Overview:
➡️ The chart shows a clearly formed and broken Bearish Rectangle, confirming a short setup after price exited the range to the downside.
➡️ The $0.6090 support level has turned into strong resistance.
➡️ Entry at $0.5794 follows a textbook breakdown and retest structure.
➡️ Target area aligns with the volume-based support near POC $0.515, offering solid R:R.
🎯 TP Targets:
💎 TP 1: $0.5725
💎 TP 2: $0.5665
💎 TP 3: $0.5600
📢 Bearish structure confirmed with increased volume.
🚀 BYBIT:WALUSDT.P continues its bearish momentum — downside potential remains active!

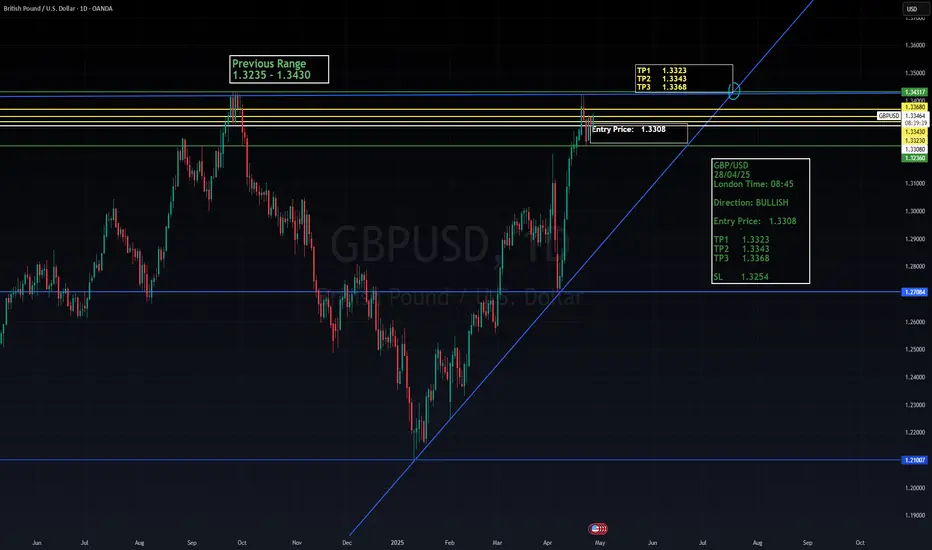
GBP/USD 28/4/25 - Signal PrepGBP/USD Trade Setup
- Bullish Signal We are anticipating bullish momentum on GBP/USD with the following levels in focus:
Entry Price: 1.3308
Take Profit Targets:
TP1: 1.3323
TP2: 1.3343
TP3: 1.3368
Stop Loss: 1.3254
This setup suggests a potential upside move as the pair shows signs of strength. Traders may look to enter around the specified entry point and scale out at the marked take profit levels, while maintaining a controlled risk with the stop loss in place. As always, manage your position size appropriately based on your trading plan.
THE KOG REPORT THE KOG REPORT:
In last week’s KOG Report we said we would be looking for the price to continue upside into the region given which gave us a fantastic capture for the start of the week. We then had to adapt as the bias level and targets on the red box indi changed suggesting more upside. We continued to complete all our bias above targets as well as Excalibur and LiTE giving us 100% again for the week!
It wasn’t easy as it sounds, it took a lot of work and constant monitoring but the pip capture on gold was out of this world and well worth it!
So, what can we expect from the week ahead?
For this week we seem to be creating a DB on the 4hr chart which entails caution. We have resistance just above at the 3330-35 with extension 3240-45 region which if attacked and rejected in the early session could give the potential short trade into the support level 3295-8 which is the key level that needs to break for us to go lower.
There is a lot of liquidity above, especially those who like us shorted and held trades from the 3450 levels so the bias this week changes to the 3350-55 level, break above and we will confirm the move higher, otherwise, our thoughts are a test is likely on the high but we would like to get that long from lower to again create a new ATH.
Let’s see how we open, these markets need to be adapted to every day so making long terms plans as intra-day traders isn’t on our agenda at the moment. The market is giving short term, so why not take advantage of the conditions while they last.
Potential for gaps on open so please be careful, we’re on red boxes and extreme levels only.
RED BOXES INDI LEVELS:
Break above 3320 for 3327, 3330, 3335, 3345, 3347 and above that 3362 in extension of the move
Break below 3310, for 3306, 3297, 3295, 3280, 3266 and 3255 in extension of the move
Even the scalping levels are HUGE!
Please do support us by hitting the like button, leaving a comment, and giving us a follow. We’ve been doing this for a long time now providing traders with in-depth free analysis on Gold, so your likes and comments are very much appreciated.
As always, trade safe.
KOG

Gold Price Analysis April 28The D1 candle cluster forms a disputed area with a 100 price range from 3367 and 3267
The 3300 price range is having a price reaction. If the price breaks 3300 at the beginning of the European session, pay attention to the 3314 area to consider the price reaction of the European session for the SELL strategy around this price range. There is another area to pay attention to for the SELL strategy around 3343, breaking this area will reach 3367, the daily resistance zone.
The BUY strategy pays attention to around 3275 when this area is broken, only 2235 can be considered BUY. Absolutely do not block the ship when the price breaks 3275.

USDJPY Analysis week 18🌐Fundamental Analysis
The US Dollar Index (DXY) has recovered to near 99.75 after a correction on Thursday. President Donald Trump said trade talks are progressing well and a deal with Japan is close.
US-China trade relations have been thrown into uncertainty by conflicting statements: Trump said President Xi Jinping called him, while China denied any talks were taking place. Tokyo's April consumer price index (CPI) beat expectations at 3.4%, bolstering expectations that the Bank of Japan (BoJ) will continue to raise interest rates.
🕯Technical Analysis
Prices are heading towards the resistance zone of 144,900, with the possibility of an uptrend resuming. This resistance zone is likely to act as a retest for a rally towards 148,000. Pay attention to the BUY zones of 142,300 and 141,000 for retests of this pair.
📈📉Trading Signals
SELL USDJPY 148.000-148.200 Stoploss 148.500
BUY USDJPY 141.000-140.800 Stoploss 140.500

Quantum's Walmart (WMT) Trading Guide 4/28/25WMT’s weekly outlook balances its defensive resilience against macroeconomic headwinds, with a comprehensive synthesis of technical, market, and strategic factors guiding its trajectory for weekly options contracts. The FAME framework underscores WMT’s long-term bullish potential, driven by robust fundamentals (+5% revenue, $0.58 EPS, 21% e-commerce growth) and adaptability (AI, Walmart+), positioning it as a resilient player in a risk-off regime. However, elevated yields (10-year 4.255%, 20-year 4.738%, 30-year 4.721%) and a stable DXY at 99.58 amplify tariff pressures and margin concerns, capping upside and reinforcing a cautious stance. A tactical long bias is favored for weekly contracts, targeting a bounce from $94.36 to $96.47–$98.50, with a short stance viable below $88.50 if support fails.
Technical implications highlight bullish momentum on daily (RSI ~40, Stochastic ~28) and weekly (RSI ~44, Stochastic ~32) timeframes, with oversold conditions signaling a rebound potential for weekly contracts if $94.36 holds. Monthly neutral momentum (RSI ~50) suggests consolidation, requiring a breakout above $96.47 to confirm bullish strength. This supports a short-term bounce but advises monitoring for sustained moves.
Market influence implications reflect a risk-off environment, with high yields and a stable DXY increasing import costs, particularly amid tariff uncertainty from WMT’s upcoming Trump meeting. The VIX at 24.84 amplifies volatility, favoring WMT’s defensive appeal but heightening risks. WMT’s Q3 FY25 strength and e-commerce growth provide stability, supporting resilience near $94.36.
OFD summary and implications reveal bearish pressure from Vanna (-$0.04), Charm (-$0.02), and DEX (-$0.06), driven by put-heavy flow and hedging demand tied to tariff fears. However, GEX (+$0.08) at the $95 strike pins price, stabilizing volatility and supporting a neutral-to-bullish bounce for weekly contracts if $94.36 holds, aligning with oversold technicals.
Edge insights bolster the case for a bounce, with institutional buying at $94–$95 signaling accumulation, defensive retail sector strength outperforming cyclicals, and low short interest (1.4%) offering squeeze potential above $96.47. These factors enhance confidence in a tactical long bias for weekly contracts, provided support holds.
Strategic outlook implications emphasize consolidation near $95.09, with $94.36 as a critical pivot. A break below risks $88.50, driven by tariff fears and bearish options flow, while a move above $96.47 targets $98.50, fueled by oversold signals and institutional support. The VIX at 24.84 and put-heavy options flow underscore volatility, but WMT’s defensive positioning mitigates downside, favoring a bounce in a risk-off regime.
In summary, WMT’s weekly outlook hinges on defending $94.36, with oversold technicals, GEX pinning, and institutional buying supporting a bounce to $96.47–$98.50 for weekly contracts. Tariff risks, high yields, and DXY stability maintain a risk-off backdrop, capping upside and requiring vigilance for a break below support, which could shift bias to bearish. This balanced approach leverages WMT’s defensive strengths while navigating weekly volatility, aligning with Buffett’s preference for resilient businesses with tactical opportunities.

GOLD WEEKLY CHART MID/LONG TERM ROUTE MAPHey Everyone,
Quick update on our weekly chart idea, it's been playing out beautifully, helping us track the move down and catch the move back up.
After hitting our final channel top target at 3281, we mentioned we would look for support forming above the channel. That’s exactly what happened, with price finding support outside the channel and giving us the bounce we anticipated.
We also got a body close above 3281, which completed the gap up to 3387. From here, we'll be watching for continued support above the channel, a retest of 3387, and a close above it to confirm the continuation higher.
If we fail to retest and close above 3387, we’ll likely see a reset back to the channel top. Should that support fail, we would expect a break of the EMA5 back into the channel, resetting the play inside the channel with all previous levels back in play.
This is the beauty of our Goldturn channels, drawn using weighted averages instead of pure price action. This unique approach helps us clearly identify fake-outs and real breakouts, cutting out much of the noise that usually confuses traders.
Moving forward, we’ll focus on smaller timeframes (1H and 4H) to buy dips off the weighted Goldturns, aiming for clean 30–40 pip moves. Ranging markets are perfect for this style, allowing us to capitalize on quick moves without getting caught in the chop of larger swings.
Thanks again for all your likes, comments, and follows, we really appreciate the support!
Mr Gold
GoldViewFX

XRP - Time to buy again!The pattern has broken, and now I expect the price to rise to $3 . AB=CD.
Give me some energy !!
✨We spend hours finding potential opportunities and writing useful ideas, we would be happy if you support us.
Best regards CobraVanguard.💚
_ _ _ _ __ _ _ _ _ _ _ _ _ _ _ _ _ _ _ _ _ _ _ _ _ _ _ _ _ _ _ _
✅Thank you, and for more ideas, hit ❤️Like❤️ and 🌟Follow🌟!
⚠️Things can change...
The markets are always changing and even with all these signals, the market changes tend to be strong and fast!!

Nobody appreciate it !!!Currently, ETH is forming an ascending triangle, indicating a potential price increase. It is anticipated that the price could rise, aligning with the projected price movement (AB=CD).
However, it is crucial to wait for the triangle to break before taking any action.
Give me some energy !!
✨We spend hours finding potential opportunities and writing useful ideas, we would be happy if you support us.
Best regards CobraVanguard.💚
_ _ _ _ __ _ _ _ _ _ _ _ _ _ _ _ _ _ _ _ _ _ _ _ _ _ _ _ _ _ _ _
✅Thank you, and for more ideas, hit ❤️Like❤️ and 🌟Follow🌟!
⚠️Things can change...
The markets are always changing and even with all these signals, the market changes tend to be strong and fast!!

Chevron: The Chart’s Reaching a Critical PointChevron is starting to look very interesting again — but let’s be clear from the start: Chevron, like every oil giant, lives and dies by the price of oil. If oil rips higher or collapses due to global politics, supply shocks, or economic chaos, Chevron NYSE:CVX follows. No exceptions.
That said, what we’re seeing on the chart right now is increasingly pointing toward a deeper correction — specifically down to the $113–$100 zone. That would make sense structurally as a Wave 4 retracement.
But there’s a technical nuance here. Wave 1’s high sits at $103 — and depending on how strict your Elliott Wave rules are, Wave 4 dipping into Wave 1 is bad territory. Personally, I’m okay with a brief touch into that range, but I don’t want to see price hanging around below $103 for long.
From a trend perspective, we’re clearly in a downward channel. We just saw a textbook bull trap:
Chevron broke out with a solid +7% move over two weeks,
Followed immediately by a massive 22% drop,
One of the sharpest two-week declines since — yeah — March 2020, pandemic levels.
Now, price is hovering around $130, and the setup is simple:
If this level holds, great — maybe we’re bottoming.
If it breaks, I’m looking to buy between $113 and $100. That’s where the structure aligns, the volume kicks in, and risk/reward starts to make sense again.
So here’s the real question:
Do we see $200 first — or $100?
I’m leaning $100 first.
Not because I’m bearish long-term— but because that level would clean up the chart, shake out the noise, and give us a real shot at riding the next strong leg higher with conviction.
Would love to hear what you think — where’s your bet?

EUR/USD Slides to 1.1350 Amid USD Strength & ECB Dovish Signals📌 Daily Market Summary: EUR/USD Slides to 1.1350 Amid USD Strength & ECB Dovish Signals
EUR/USD declined toward 1.1350 on Friday as the US Dollar gained strength, driven by easing tensions in the US–China trade standoff. Reports suggest Beijing may suspend additional tariffs on some US goods.
Despite the dip, the euro remains firm against most major currencies except North American ones.
ECB members Holzmann and Rehn highlighted ongoing structural weaknesses in the Eurozone and increased risks of inflation undershooting the 2% target.
Olli Rehn suggested that the current conditions justify a rate cut as early as June.
📊 Technical Outlook
EUR/USD dropped to 1.1350, but the broader trend remains bullish, with the 20-week EMA still pointing higher around 1.0885.
💼 Trading Plan
🟢 BUY ZONE
Entry: 1.12725
Stop Loss: 1.12000
Take Profit: 1.13165
🔴 SELL ZONE
Entry: 1.14775
Stop Loss: 1.15300
Take Profit: 1.14350
📉 Caution: With political news and central bank guidance shaping sentiment, traders should closely monitor reactions at key levels and stick to their risk management rules.

Gold Analysis April 24D1 candle closed with a sharp decline of nearly 100 prices
And today's opening with a price gap of more than 100 prices shows the instability of the market.
Returning to the h1 time frame wave will be easier to grasp. At the beginning of the European session, the market decided that the buyers won and are pushing up from 3322. Pay attention to the immediate area of 3340. If it breaks at the end of the European session, continue to wait for the price reaction at 3363. If it doesn't break, you can SELL. In the opposite direction, if it breaks 3363, wait for 3384 for the SELL strategy.
The BUY strategy is focused on the European session's price push zone of 3322. When it breaks, pay attention to the GAP opening zone this morning at 3295 and the bottom zone yesterday at 3266

Gold Price Analysis April 23Candle D has a clear bearish confirmation and the 4-line structure is being continuously sold, leading to the gold price falling nearly 200 prices from ATH.
Today's strategy will mainly be SELL following the market trend. At the end of the European session, the price breaks 3319, then wait for a retest to BUY up towards the resistance zones of 3379 - 3345. If it does not break 3319, then SELL Gold back to 3275 and 3247. Pay attention to the price reactions in the chart areas to have a reasonable BUY and SELL strategy.

Trading opportunity for KASUSDTBased on technical factors there is a Sell position in :
📊 KASUSDT
🔴 Sell Now
🪫Stop loss 0.11000
🔋Target 0.06767
📏 R/R 2
💸RISK : 1%
We hope it is profitable for you ❤️
Please support our activity with your likes👍 and comments📝
