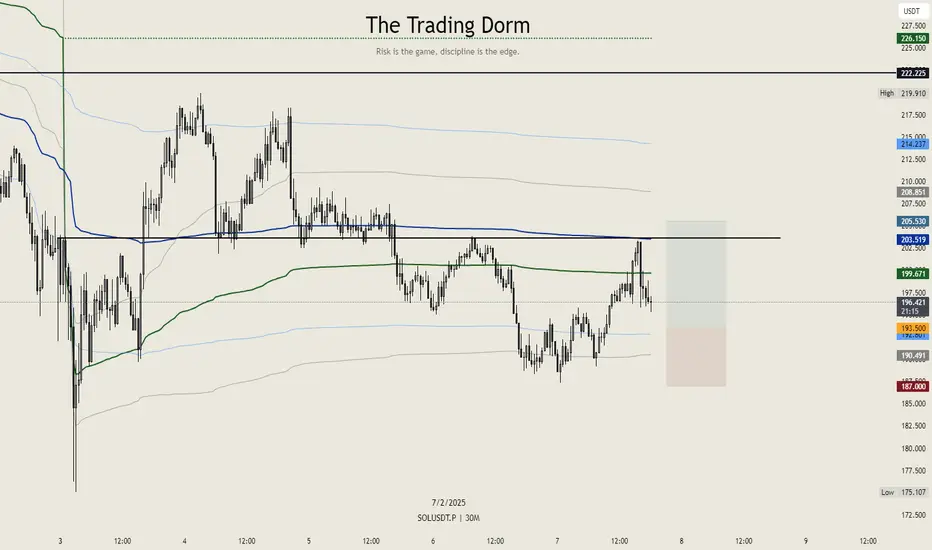
Solana $SOL Setup – Keeping it CleanSolana looks strong, so it’s time for a trade. The entry is placed at $193.50, with a stop-loss at $187 to keep risk in check. The target is set at $205.53, aligning perfectly with the monthly and weekly VWAP VALs.
This setup offers a 1:1.85 risk-to-reward ratio—nothing crazy, just a clean, structured trade. No moonboy fantasy for now, just following the price action and executing accordingly.
Tradingsignals
Gold Trap to Big Bullish The chart shows *XAU/USD (Gold)* trading at (2,886.375) with a potential upward move. The first target is at (2,884.162) and further gains could reach *2,842.120*. The *support level* is marked below, indicating a possible reversal if the price dips. The overall trend appears bullish with room for upward movement

PYPL : Another Dive or Finally Time to Buy?PayPal (PYPL) has been getting slapped around like a rookie in a heavyweight fight. The stock is now chilling above a thick support zone—right above the 50% and 61.8% Fibonacci retracement levels. Sounds like fancy chart talk, but all it really means is: This could be where the pain finally stops.
There's also an unfilled gap across multiple timeframes, and gaps like these tend to get filled at some point. If NASDAQ:PYPL keeps sliding, it might take out the previous quarterly low. Why does that matter? Because these lows act like a magnet, dragging price down just enough to shake out weak hands before launching higher. That’s when the selling pressure finally dies down. And the RSI? Almost in the basement—last time we saw this (November 2023), PYPL ripped higher shortly after.
My plan? Set alerts, watch closely, and pounce when the signs point to a reversal. I’m not about to catch a falling knife, but if this thing turns around, I sure as hell don’t want to be left behind.

Trading opportunity for BTCUSDTBased on technical factors there is a Buy position in :
📊 BTCUSDT
🔵 Buy Now
🪫Stop loss 95300.00
🔋Target 105000.00
📏 R/R 2
💸RISK : 1%
We hope it is profitable for you ❤️
Please support our activity with your likes👍 and comments📝

BTC: This May Be Your Last Chance Before Exploding to Upside !!As you can see, the price is forming two bullish patterns on the daily timeframe, If my view is correct, btc will rise to 120k .
And if this pattern is correct and breaks, higher targets are possible.
Give me some energy !!
✨We spend hours finding potential opportunities and writing useful ideas, we would be happy if you support us.
Best regards CobraVanguard.💚
_ _ _ _ __ _ _ _ _ _ _ _ _ _ _ _ _ _ _ _ _ _ _ _ _ _ _ _ _ _ _ _
✅Thank you, and for more ideas, hit ❤️Like❤️ and 🌟Follow🌟!
⚠️Things can change...
The markets are always changing and even with all these signals, the market changes tend to be strong and fast!!

Gold Trap to bullish TrendThe chart shows a bullish setup for Gold (XAU/USD) with the current price at (2,851.395) Key support levels are marked at (2,820) and (2,780) suggesting potential buying opportunities if the price drops. The first target is at (2,842)and the second at (2,884) indicating expected upward movement. A (buy) position is recommended near (2,820) with a stop loss below (2,780)for risk management.

#BILLYUSDT expecting further decline!📉 SHORT BYBIT:BILLYUSDT.P from $0.00367
🛡 Stop Loss: $0.00390
⏱ 1H Timeframe
📍 Overview:
➡️ BYBIT:BILLYUSDT.P continues to trend downward, forming new local lows. After retesting the $0.00387 zone, the price failed to hold and dropped again, confirming seller dominance.
➡️ POC (Point of Control) at $0.00475 shows the highest liquidity area, positioned above the current price. This confirms a bearish market sentiment, as major trading activity is still concentrated at higher levels.
➡️ A breakdown of support at $0.00367 strengthens the downtrend, opening the way toward $0.00336, where buyers previously showed interest.
➡️ If the price holds below $0.00367 , further downside movement is likely, with increasing sell pressure.
⚡ Plan:
➡️ Enter short after confirming a breakdown below $0.00367 , signaling further downside.
➡️ Risk management through Stop-Loss at $0.00390 , placed above the nearest resistance zone.
➡️ Primary downside target – $0.00336, where buyers may step in.
🎯 TP Targets:
💎 TP 1: $0.00336
🚀 BYBIT:BILLYUSDT.P remains weak — expecting further decline!
📢 BYBIT:BILLYUSDT.P remains in a strong downtrend with no signs of buyer recovery. If the $0.00367 level is broken with increasing volume, the decline may accelerate.
📢It's crucial to watch the reaction at $0.00336—if significant buying interest appears, a short-term bounce is possible.
📢However, in the long term, there are no clear reversal signals yet, and long positions should be approached with caution.

$XAU Profit Target 2 Done See on ChartBITFINEX:XAUTUST Chart Analysis of Price Prediction 2025 see more chart...
Gold price flat lines above $2,760 level as traders keenly await FOMC decision Gold Price Forecast: XAU/USD nears $2,750 as Fed’s decision looms
From a technical perspective, the recent breakout through the $2,720-2,725 horizontal barrier and positive oscillators on the daily chart suggest that the path of least resistance for the Gold price remains to the upside. A subsequent move above the $2,772-2,773 area will reaffirm the constructive outlook and lift the XAU/USD beyond the $2,786 area, or the highest level since October 2024 touched last Friday, towards the all-time peak, near the $2,790 zone. Some follow-through buying, leading to a strength beyond the $2,800 mark, will be seen as a fresh trigger for bullish traders and pave the way for an extension of a well-established uptrend witnessed over the past month or so.
XAU/USD Current price: $2,753.60
The Federal Reserve will likely keep rates on hold in today’s monetary policy meeting.
The United States will publish the preliminary estimate of the Q4 GDP on Thursday.
XAU/USD could extend its slide in the near term amid prevalent US Dollar demand.
Gold is under modest selling pressure on Wednesday as caution rules ahead of the Federal Reserve’s (Fed) monetary policy announcement. The United States (US) central bank is widely anticipated to keep the benchmark interest rate unchanged after trimming 25 basis points (bps) and settling it at 4.25%-4.5% in December.
Support levels: 2,747.20 2,734.60 2,716.50
Resistance levels: 2,764.85 2,777.30 2,789.95
Disclaimer: This article is for informational purposes only and does not constitute financial advice. Always conduct your own research before making any investment decisions.

Thesis: Bitcoin Intraday Trade StrategyTrade Setup
Outcome: Open Long
Entry Price: $97,070
Stop Loss: $96,000
Take Profit: $100,000
Confidence Level: 75%
Market Context & Justification
🔹 Bullish Sentiment & Long-Short Ratio – Positive trader sentiment and a 1.2 buy/sell ratio on Binance Perpetuals suggest more long positions entering the market.
🔹 Technical Indicators – Mixed signals:
RSI: Neutral (no clear overbought/oversold signals).
MACD: Negative on 1h and 15m, but showing signs of recovery on the daily timeframe.
🔹 Support & Resistance Levels
Price is near support, increasing the likelihood of a bounce.
A breakout above $98,869 could fuel further upside toward the take-profit level at $100,000.
🔹 Options & Liquidity Impact
CME Max Pain Price at $95,000 may act as a pullback zone if BTC faces short-term selling pressure.
Large liquidation clusters at $95,000 could trigger stops if downside volatility increases.
🔹 Funding & Open Interest Data
Funding Rate: Slightly positive at 0.02%, indicating mild bullish positioning.
Open Interest: 76,232 BTC, showing active participation in the market.
Conclusion
Despite mixed technicals, strong sentiment and positioning data support a long entry at $97,070, with a stop loss at $96,000 to mitigate downside risk. If resistance at $98,869 is broken, BTC has a high probability of reaching $100,000. However, traders should monitor liquidation clusters and options expiry effects for potential volatility.

It's disappointing !!!Once again, The price action could drop to $95K and then return to its peak. It will take some time to recover from the damage that these sh*t meme coins have done to the crypto market.
Give me some energy !!
✨We spend hours finding potential opportunities and writing useful ideas, we would be happy if you support us.
Best regards CobraVanguard.💚
_ _ _ _ __ _ _ _ _ _ _ _ _ _ _ _ _ _ _ _ _ _ _ _ _ _ _ _ _ _ _ _
✅Thank you, and for more ideas, hit ❤️Like❤️ and 🌟Follow🌟!
⚠️Things can change...
The markets are always changing and even with all these signals, the market changes tend to be strong and fast!!

Siri forming a bullish wedgeI have entered into a position here at 24.22 for Sirius XM. Short term target $35. Sell everything at between 45 and 50.

THE KOG REPORT - UpdateEnd of day update from us here at KOG:
It wasn't quite exact, however, we managed to get the move down that we wanted for the short, stopped at our Red box support which was active, got the bounce, got a lovely long, then the short from the region we wanted....what an end to the day. We've completed our bias level targets for the day and the target of 2828 which we gave traders nearly two weeks ago and yesterday in the KOG Report.
A choppy opening with gaps across the markets, but Excalibur and the indicators were not threatened at all.
So, now we have the support level below 2807-10 and the resistance region 2830-5 region. We would like to see a retest of this new high so if we do pullback into the support level and hold, it's likely we will see a new all time high again in the sessions to come.
Can we long? Not recommended up here unless we get back down into 2775 regions. Otherwise, keep an eye on the levels above, looks like a curveball is on its way!
KOG’s Bias for the week:
Bearish below 2810 with targets below 2795✅, 2775✅ and below that 2755.
Bullish on break of 2810 with targets above 2820✅, 2824✅, 2828✅ and above that 2835
RED BOXES:
Break of 2810 for 2815✅, 2818✅, 2828✅, 2830✅ and 2834 in extension of the move
Break of 2790 for 2785✅, 2877✅, 2765 and 2755 in extension of the move
Please do support us by hitting the like button, leaving a comment, and giving us a follow. We’ve been doing this for a long time now providing traders with in-depth free analysis on Gold, so your likes and comments are very much appreciated.
As always, trade safe.
KOG

AUD/JPY: Bearish Reversal in Play, A Long Downtrend Awaits?Hey Realistic Traders, OANDA:AUDJPY has no chance for a Bullish Outlook? Let's dive into the analysis...
After a prolonged consolidation phase, the Aussie Yen has once again traded below the EMA-200 line, forming a new lower high along the way. This bearish signal marked the beginning of a continued downward movement, which was further confirmed by a breakout from a rising wedge pattern. Such breakouts typically indicate strong bearish momentum, especially when accompanied by multiple bearish marubozu candlesticks.
Further strengthening this outlook, a falling wedge breakout occurred on the JPYBASKET, signaling a continuation of its prevailing bullish trend. This divergence between Aussie Yen and JPYBASKET adds weight to our bearish analysis.
Considering these strong technical signals, the price is likely to move downward toward the first target at 94.651 or potentially the second target at 93.716.
However, this bearish scenario depends on the price staying below the critical stop-loss level at 98.478.
Support the channel by engaging with the content, using the rocket button, and sharing your opinions in the comments below.
"Disclaimer: "Please note that this analysis is solely for educational purposes and should not be considered a recommendation to take a long or short position on Aussie Yen".

Trading opportunity for SSVUSDTBased on technical factors there is a Buy position in :
📊 SSVUSDT
🔵 Buy Now
🪫Stop loss 11.90
🔋Target 15.10
📏 R/R 1,6
💸RISK : 1%
We hope it is profitable for you ❤️
Please support our activity with your likes👍 and comments📝

Trading opportunity for SOLUSDTBased on technical factors there is a Buy position in :
📊 SOLUSDT
🔵 Buy Now
🪫Stop loss 188.00
🔋Target 227.00
📏 R/R 1,5
💸RISK : 1%
We hope it is profitable for you ❤️
Please support our activity with your likes👍 and comments📝

Trading opportunity for BTCUSDTBased on technical factors there is a Buy position in :
📊 BTCUSDT
🔵 Buy Now
🪫Stop loss 90950.00
🔋Target 107550.00
📏 R/R 2
💸RISK : 1%
We hope it is profitable for you ❤️
Please support our activity with your likes👍 and comments📝

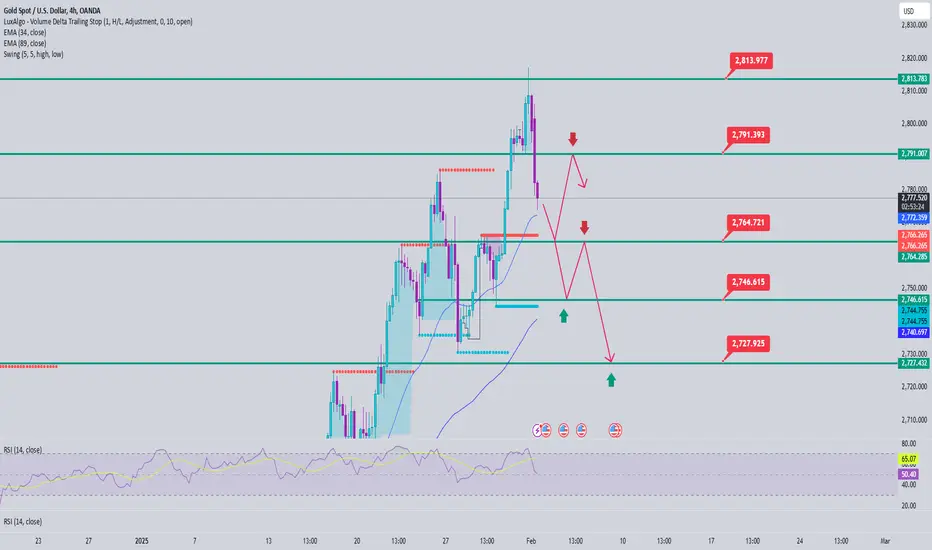
Gold price analysis February 3⭐️Fundamental Analysis
US President Donald Trump imposed 25% tariffs on Canada and Mexico, and 10% on China, starting from 05:01 GMT on Tuesday. The reason is to combat illegal immigration and drug trafficking. Canada and Mexico responded with retaliatory tariffs, while China announced it would file a lawsuit at the World Trade Organization (WTO).
Markets reacted negatively, with the S&P 500 down 1.40% in particular, and money flows into the US dollar instead of gold. However, if China retaliates, gold, which is considered an inflation hedge, could rise. Traders will also pay attention to US and Chinese manufacturing PMI data, along with speeches from the Federal Reserve, which could impact gold prices.
⭐️Technical Analysis
Gold prices were pushed down by sellers around 2777 after hitting an all-time high. The important support of 2765 plays a role in pushing the gold price back to its upward trajectory. When the 2765 zone is broken, pay attention to the next 2 zones around 2746 and 2727. When the uptrend resumes, it will meet the reaction of the sellers around 2791 and the all-time high zone around 2814.
Ripple Analysis - What Shall we Expect !!! If this wedge breaks, the price will drop to $2.3. So, be careful.
Give me some energy !!
✨We spend hours finding potential opportunities and writing useful ideas, we would be happy if you support us.
Best regards CobraVanguard.💚
_ _ _ _ __ _ _ _ _ _ _ _ _ _ _ _ _ _ _ _ _ _ _ _ _ _ _ _ _ _ _ _
✅Thank you, and for more ideas, hit ❤️Like❤️ and 🌟Follow🌟!
⚠️Things can change...
The markets are always changing and even with all these signals, the market changes tend to be strong and fast!!

Frankly !!BITCOIN is in the ascending phase by the cup and handle.
BTC is in a large C&H if it follows these pattern, the price will have a nice rally.
⭐The pattern increases the price by the amount of the measured price movement (AB=CD).
Golden analysis
Give me some energy !!
✨We spend hours finding potential opportunities and writing useful ideas, we would be happy if you support us.
Best regards CobraVanguard.💚
_ _ _ _ __ _ _ _ _ _ _ _ _ _ _ _ _ _ _ _ _ _ _ _ _ _ _ _ _ _ _ _
✅Thank you, and for more ideas, hit ❤️Like❤️ and 🌟Follow🌟!
⚠️Things can change...
The markets are always changing and even with all these signals, the market changes tend to be strong and fast!!

Do you think I'm joking ???As you can see, the price is forming two bullish patterns on the 4h timeframe, If my view is correct, DOGE will rise to $0.53 .
And if this pattern is correct and breaks, higher targets are possible.
Give me some energy !!
✨We spend hours finding potential opportunities and writing useful ideas, we would be happy if you support us.
Best regards CobraVanguard.💚
_ _ _ _ __ _ _ _ _ _ _ _ _ _ _ _ _ _ _ _ _ _ _ _ _ _ _ _ _ _ _ _
✅Thank you, and for more ideas, hit ❤️Like❤️ and 🌟Follow🌟!
⚠️Things can change...
The markets are always changing and even with all these signals, the market changes tend to be strong and fast!!

XRP's situation+next targets and expected movements.The price is currently within a wedge, which could be a bullish sign in the medium term. At the moment, I don't see the necessary volume to break the wedge, and I expect the price to come down to around $2.8 once more and then go up. This guess could form a head and shoulders pattern, which is great for a price increase.
Give me some energy !!
✨We spend hours finding potential opportunities and writing useful ideas, we would be happy if you support us.
Best regards CobraVanguard.💚
_ _ _ _ __ _ _ _ _ _ _ _ _ _ _ _ _ _ _ _ _ _ _ _ _ _ _ _ _ _ _ _
✅Thank you, and for more ideas, hit ❤️Like❤️ and 🌟Follow🌟!
⚠️Things can change...
The markets are always changing and even with all these signals, the market changes tend to be strong and fast!!

XRP - Time to buy again!As I mentioned in the previous analysis, the price can form a head and shoulders pattern. If that is happen, expect a significant price increase.
previuos analysis
Give me some energy !!
✨We spend hours finding potential opportunities and writing useful ideas, we would be happy if you support us.
Best regards CobraVanguard.💚
_ _ _ _ __ _ _ _ _ _ _ _ _ _ _ _ _ _ _ _ _ _ _ _ _ _ _ _ _ _ _ _
✅Thank you, and for more ideas, hit ❤️Like❤️ and 🌟Follow🌟!
⚠️Things can change...
The markets are always changing and even with all these signals, the market changes tend to be strong and fast!!

SOLANA What will happen in the short term ?The price will drop to the 0.382 Fibonacci line and then will pump.
Give me some energy !!
✨We spend hours finding potential opportunities and writing useful ideas, we would be happy if you support us.
Best regards CobraVanguard.💚
_ _ _ _ __ _ _ _ _ _ _ _ _ _ _ _ _ _ _ _ _ _ _ _ _ _ _ _ _ _ _ _
✅Thank you, and for more ideas, hit ❤️Like❤️ and 🌟Follow🌟!
⚠️Things can change...
The markets are always changing and even with all these signals, the market changes tend to be strong and fast!!
