Gold price analysis June 20Daily candle continues to show the dispute while the Sellers are dominating. Today there may be a deep sweep and then recovery at the end of the day.
Yesterday and this morning's 3343 zone did not sweep, so we cancel this zone. BUY must wait until below 3323. Note additional daily support at 3296 for today's 2 buy strategies.
3362 gives a SELL Breakout signal in the Asia-Europe session. If Gold closes back above 3362, then BUY will go up to 3400, the target of the two upper resistance zones remains the same as yesterday at 3415 and 3443
Tradingsignals

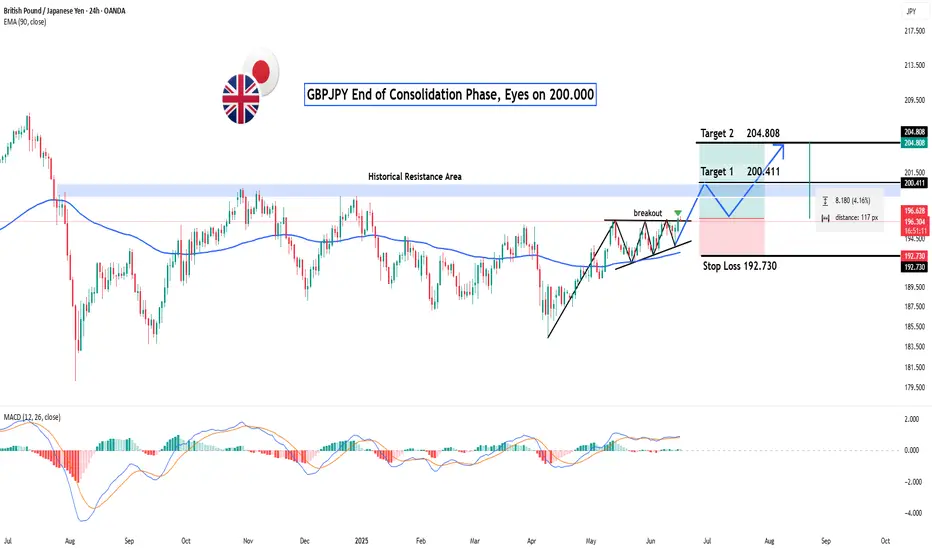
GBPJPY: End of Consolidation Phase, Eyes on 200.000?Hey Realistic Traders!
Could this be the beginning of a major bullish wave ?
Let’s Break It Down..
On the daily timeframe, GBPJPY has formed a Symmetrical Triangle Pattern, followed by a bullish breakout, a classic technical signal that typically marks the end of a consolidation phase and the start of a new bullish trend. This move is further confirmed by the appearance of a strong bullish candlestick, reflecting a surge in buying momentum.
Supporting this bullish scenario, the MACD indicator has also formed a bullish crossover, where the MACD line crosses above the signal line. This crossover is widely regarded as a momentum shift from bearish to bullish, strengthening the case for continued upward movement.
Given these technical signals, the price is likely to advance toward the first target at 200.411, with a potential extension to 204.808.
This bullish outlook remains valid as long as the price holds above the key stop-loss level at 192.730.
Support the channel by engaging with the content, using the rocket button, and sharing your opinions in the comments below.
Disclaimer: "Please note that this analysis is solely for educational purposes and should not be considered a recommendation to take a long or short position on OANDA:GBPJPY ".
$VET USD 1HR INCOMING PUMP?Structure & Zones
Price is trading between a clear supply zone above and a demand zone below, offering defined areas for reaction.
Two unfilled FVGs on the 1D timeframe above current price could act as magnet zones for price continuation.
A 4H FVG just beneath current price is nearly filled — potential area for a bullish bounce.
Three psychological price levels are marked and align with Fibonacci and FVG targets, likely to act as resistance zones if price pushes higher.
Trend & Pattern
High timeframe (HTF) remains bullish, supported by the formation of a rounding bottom — a strong reversal structure suggesting accumulation.
Lower timeframe (LTF) is showing short-term bearishness as price pulls back and retests key support/trendline.
Price is holding above a bullish trendline, maintaining structure unless a breakdown occurs.
Volume & Momentum
The OBV indicator shows a broken rising wedge, signaling a possible momentum slowdown or short-term correction.
Anchored volume profile reveals high volume beneath price — indicating that previous trading activity supports current levels and adds bullish confluence.
Outlook & Trade Consideration
Bias remains bullish overall, supported by HTF structure and unfilled FVG targets above.
A potential pullback into the 0.5–0.618 fib retracement zone or into the 4H FVG could present long entry opportunities.
On continuation, price may target the daily FVGs and psychological levels as resistance or take-profit zones.
Watch for a rejection at fib/psych levels or breakdown below the bullish trendline to reassess bias.

Gold Price Analysis June 19Yesterday's D1 candle confirmed the Sell side after the FOMC announcement. Today's Asian session had a push but the European and American sessions are likely to sell again.
3366 will be an important breakout zone today, if it breaks through, the Sell side will continue to be strong and push the price deeper and limit buying when breaking this zone. 3344 is the first target when breaking, it is quite difficult for gold to break this zone, but if it breaks right away, wait below 3296 to BUY for safety.
3398 is the Breakout border zone from yesterday to today, to SELL this zone also has to wait for confirmation, but if you want to wait for a better SELL, you have to wait for 3415 and the ATH peak 3443. However, if it breaks 3400, waiting for a Buy test will be quite nice.

Gold price analysis June 18Yesterday's D1 candle was a Doji candle. It shows the hesitation of buyers and sellers at the price near ATH.
The h4 structure is a sustainable bullish wave structure and is heading towards higher hooks.
The 3400 zone is the immediate resistance zone that Gold is heading towards. This zone will be the breakout zone for the confirmation of the candle closing above 3400.
The profit-taking reaction zone of sellers at 3415 acts as a price reaction when the price uptrend returns and creates momentum towards 3443.
On the other hand, the breakout point of 3472, if broken, will push the price to the support zone of 3343

Gold Price Analysis June 17The D1 candle shows profit-taking by the sellers, pushing the price back below 3400. In the current context, the pullback is only short-term and has not confirmed the reversal, but long-term Buy signals can still be noticed at important support zones.
Today, there are many price zones that can BUY Gold, so wait for confirmation before placing an order. Gold is heading towards the first support around 3375-3373. This is also the Breakout zone. If it breaks out, Gold will go to 3343-3341 to be able to BUY (pay attention to sell break). If there is a sweep to 3343 and then bounces and closes above the 3373 breakout zone, it confirms that the uptrend will continue strongly in the near future.
The next BUY support zone to pay attention to is 3322-3320 and the 3305-3303 zone.
The BUY order target is always pushed further back to 3415 or 3443.

Gold trading strategy June 17D1 candle shows profit taking by sellers pushing the price back below 3400. In the current context, the pullback is only short-term and has not confirmed the reversal, but long-term Buy signals can still be noticed at important support zones.
Today, there are many price zones that can BUY Gold, so wait for confirmation before placing an order. Gold is heading towards the first support around 3375-3373 (this zone has just reacted 100 pips). This is also the Breakout zone. If it breaks this zone, Gold will reach 3343-3341 before it can BUY.
Note that to sell break 3373 and the SELL resistance point must wait for 3415 and the daily resistance 3443-3445
If there is a sweep to 3343 and bounces and closes above the 3373 breakout zone, it confirms that the uptrend will continue strongly in the near future.
The next BUY support zone to pay attention to is 3322-3320 and the 3305-3303 zone. The BUY target is always pushed further back to 3415 or to the peak around 3443.
SUPPORT: 3373;3342;3322;3304
RESISTANCE: 3415;3443
Gold Price Analysis June 16There is not much surprise when the price gap up appeared on Monday morning
there is no barrier that can stop the price of gold from increasing towards ATH.
Gold has a slight correction in Tokyo session after the price gap up touched the round resistance zone 3450.
The correction may extend to 3413 in European session. This is a BUY zone with the expectation that Gold will regain the ATH hook. If broken, there will be some Scalping buy zones but the risk is quite high so to be safe, wait for 3398.
3463 acts as temporary resistance for a reaction period before Gold returns to the all-time high. Maybe before 3490 there will be another price reaction before reaching the top.

Gold Trading Strategy June 16There is not much surprise when the price gap up appeared on Monday morning there is no barrier that can stop the price of gold from increasing towards ATH. Gold has a slight adjustment in Tokyo session after the price gap up touched the round resistance zone 3450.
The adjustment may extend to 3413 in European session. This is a BUY zone with the expectation that Gold will regain the ATH hook. If broken, there will be some Scalping buy zones but the risk is quite high so to be safe, wait for 3398.
In the long term, 3463 acts as temporary resistance for a reaction phase before Gold returns to its all-time high. Maybe before that, 3490 will have another price reaction before reaching the peak.
Resistance: 3428 (Scalping) - 3444 - 3463 - 3490
Support: 3413- 3298

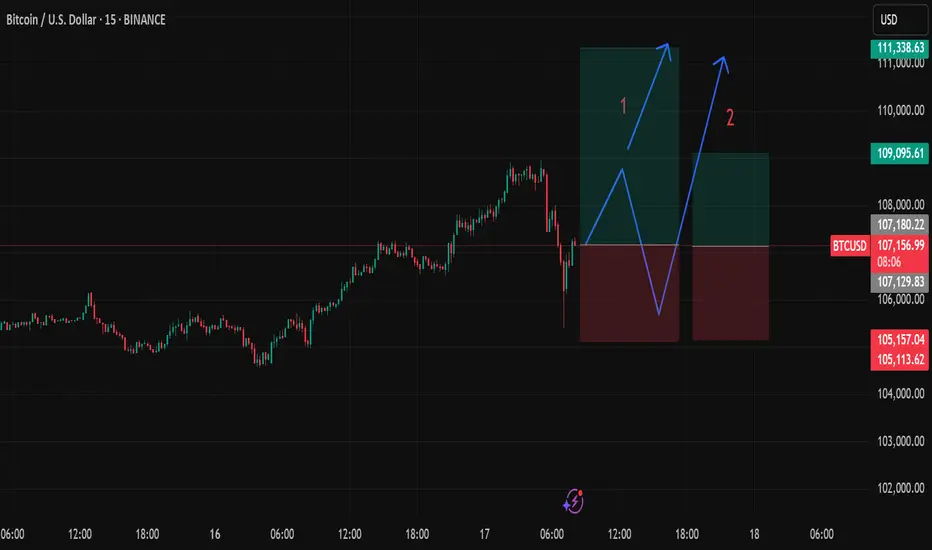
Clean Shot Short-Term buy BTCScenerio 1: go new high risk/reward very good.
Scenerio 2: go to top and go down one more time and then up to new high.
GBPNZD Important Resistance and SupportThe pair is heading towards the resistance at 2.363, which has not been tested by the sellers, so there are still many sellers waiting in this area. The uptrend could extend to 2.276, the highest peak of last month.
If the resistance at 2.263 cannot be broken, then 2.238 is the sideway border of the pair, which helps support the price increase. When it breaks out, it confirms a reversal to the downtrend.
The price reaction zone can be noted around 2.229 before touching the strong support zone at 2.220.
Support: 2.238, 2.229, 2.220
Resistance: 2.263, 2.276

Gold trading strategy june 13Yesterday's D1 candle was bullish, confirming the continuation of the uptrend. Following that uptrend, the Asian session saw a strong price increase to a high of 3443. If there is still confirmation from the h4 candle above 3397, today will still be a bullish candle with a large amplitude at the end of the day.
After reaching a monthly high, Gold is in a bearish correction at the end of the Asian session. This correction will last until it touches the support level of 3397, which is a good BUY signal.
The target for BUY signals will be 3364 and this area will have a profit-taking reaction from Buyers, causing the price to fall. Gold may touch the pre-ATH level of 3394 and there will be a reaction.
On the other hand, there is a sweep to 3376, which is considered a daily support zone and you can buy in this area.
Support: 3398- 3376
Resistance 3464-3495

Gold Price Analysis June 13Yesterday's D1 candlestick increased, confirming the continuation of the uptrend. Following that uptrend, the Asian session saw a strong increase in price to the highest peak of 3443. If there is still confirmation from the h4 candlestick above 3395, today will still be a bullish candlestick with a large amplitude at the end of the day.
After reaching the highest peak of the month, Gold is having a downward correction at the end of the Asian session. This correction lasts until the support of 3397 to have a good BUY signal. In case you want to SELL, you must wait for a 50% test of the previous full-force downtrend H1 candle (around 3434) and the continuation of the Selling side.
If the 50% test does not appear, you must reverse to find a BUY Breakout point. Note that the False break at the peak of 3343 should wait for confirmation of the small-frame DOW wave to enter the order, which will be safer for this morning's break.
If you get a BUY order, the target will be 3364 and this area will have a profit-taking reaction from the Buyers, causing the price to decrease. Gold may touch the threshold before ATH 3394 and there will be a reaction.
In the opposite direction, there is a sweep to 3376, which is considered the daily support zone and you can buy in this area.
All SELL signals are considered obstacles, so set a short target and a new BUY signal sets a long expectation.

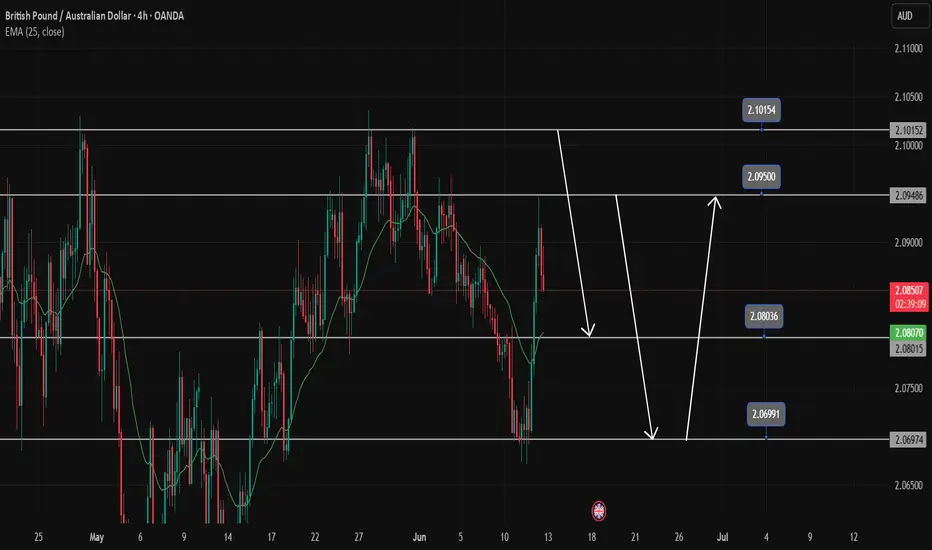
GBPAUD Trading SignalsGBPAUD is reacting at the resistance zone with this force, the downtrend will continue at 2.08000. If you want to BUY at 2.0800, you have to wait for the price reaction of the candle. If you break 2.080, you have to wait at 2.06900 for BUY strategies. In the opposite direction, the peak of 2.101 is still an important peak where you can execute the SELL strategy with the GBPAUD currency pair.
Gold Price Analysis June 12Yesterday's D1 daily frame bounced and closed above 3348. That led to a price gap today.
3375 is a resistance zone that is showing price reaction in the Asian session. If it cannot be broken at the end of the session, it is possible to set up a sell at 3355 for BUY strategies in the GAP zone.
Any price decrease today is considered a good opportunity for buying Gold to aim for 3411.
Pay attention to the 3355-3347-3338 zone for BUY signals today. Target is still 3411 but there is still 3386 which may have a reaction.

Gold Trading Strategy June 12Yesterday's D1 daily frame bounced and closed above 3347. That led to a price gap today.
3375 is a resistance zone that is showing a price reaction in the European session. If it cannot be broken by mid-European session, it is possible to set up a sell at 3355. The 3355 zone for BUY strategies is in the price gap created at the beginning of today's trading session.
Any price decrease today is considered a good opportunity for buying Gold to aim for 3432
Pay attention to the 3355-3347-3321 zone for today's BUY signals. Target is still 3432 but you need to pay attention to the 3397 zone where there may be a reaction from the Sellers.
Support: 3355-3347-3321
Resistance: 3397-3432

EURUSD LongHere is our EUR USD Signal that we posted
As you can see it's running nicely at 258 Pips.
EURUSD Buy
📊Entry: 1.13538
⚠️SL: 1.12594
✔️TP1: 1.14732
✔️TP2: 1.16256
✔️TP3: 1.18194
We have 5 big swing trades running at present, all of which comes from our trading strategy that is solely based on pure maths. So far in 2025 we have hit 1 stop loss from over 100 trades.
My point to this post is to encourage you all to keep trying, don't give up. It took us over 2 years to perfect this strategy, and we know it works.
If you want any help just ask me, and I will help you.

BTC is reviving for a new bull runBTCUSD is correcting to 108000 as it hits the sell zone at 101200. At 108000 it is quite clear to set up BUY signals. Another area to watch for BUY is 106500. BUY SL points are not above 700 price for BTC. Currently the uptrend is still going to continue so any pullback to support is considered a buying opportunity.

GBPUSD is rising towards the resistance zone of 1.35600GBPUSD is heading towards 1.35600. If the gold price closes around this area, it confirms that the buyers have entered the market. You can set up a BUY signal now with SL placed below the candle wick. After touching 1.356, we can wait for the price reaction and set up a SELL signal again following the sideways border.
Do you agree with our view of buying 1.34900 and SL 1.34600?
Leave a comment

Gold Trading Strategy June 11Yesterday's D1 candle was still a balance candle closing below the important breakout zone 3347. Today's Asian session, strong buying pressure pushed the price back close to the important resistance zone in shaping the trend.
3326 is also worth noting in the European session, so wait for price reaction to BUY, but in the US session, there is CPI news, this zone will be difficult to maintain. The breakout zone 3310 is also very important to wait for price reaction for BUY scalping points. 3295 is an important daily support zone. If there is a price slide from 3295, do not BUY until it touches the support zone 3275.
In the opposite direction of today's Break 3345, wait for 3363-3365 to SELL. The 3345 zone is considered a Breakout zone when broken to trade BUY.
Support: 3310-3295-3275
Resistance: 3364-3380

Ethereum (ETH/USDT) – Ascending Triangle Breakout Incoming?ETH is pressing against the upper resistance of a long-forming ascending triangle on the 4H chart — historically a bullish continuation pattern.
Previous Move:
Last breakout saw a +49.7% move, and the structure suggests we could see a similar surge again!
Key Levels:
Support: $2,242.98
Breakout Zone: $2,850
Resistance/Target 1: $3,419
Major Target 2: $4,282 (+49.7%)
RSI: 70.5 — strong momentum, near overbought but in breakout territory.
Volume seems to be increasing near resistance, a breakout could be imminent.
Potential Upside: +49.7% if triangle breaks cleanly.
Bias: Bullish
Timeframe: 4H
Watch for: Rejection at $2,850 or breakout retest for entry confirmation.
This is not financial advice, please do your research before investing, as we are not responsible for any of your losses or profits.
Please like, share, and comment on this idea if you liked it.
#ETH #Ethereum #ETHUSDT

Gold Price Analysis June 11Yesterday's D1 candle was still a balance candle closing below the important breakout zone 3347.
Today's Asian session saw strong buying pressure pushing the price back close to the important resistance zone in shaping the trend. At the end of the Asian session, it failed to break 3342, giving a SELL signal to 3327
The breakout zone 3310 is also very important to wait for price reaction for BUY scalping points. 3295 is an important daily support zone. If there is a price slide from 3295, do not BUY until it touches the support zone 3275.
In the opposite direction of today's Break 3345, wait for 3363-3365 to SELL. The 3345 zone is considered a Breakout zone when broken to trade BUY.

Gold Trading Strategy June 10Gold price in D1 frame reacted at EMA and Trend zone yesterday and bounced back but at the end of the day still closed below the 3335 breakout zone. The downtrend can still continue as long as 3335 remains stable today.
Looking at H1, it is still in a fairly clear downtrend. 3327 is the area that is currently in dispute. 3310 is the resistance zone that Gold broke through in the Asian session. To BUY this area, you must wait for price reaction and confirmation from the candle. Breaking 3309, Gold will head towards today's important support 3295. This is a good zone for BUY signal. The daily support zone around 3275 will prevent any excessive price slide of Gold.
On the other hand, when the buyers push the price strongly through 3327, you must wait for the US session resistance around 3338 yesterday for a SELL signal. (H1 does not break through 3328, we can set up SELL with the confirmation of selling force) Breaking 3338, the bearish structure will no longer exist, the market will switch to a short-term uptrend towards 3364.
Resistance 3337-3364-3374
Support 3310-3295-3275
Wish you successful trading. If you do not understand the strategy clearly, you can contact me for support.
