Gold Price Analysis June 10Gold price reacted at the Trenline and EMA 34 yesterday and bounced back but still closed below the breakout zone of 3335.
The downtrend can still continue as long as 3335 remains strong today.
H4 shows the provincial port area at 3295 and 3275 in the opposite direction of the provincial port at 3339 and 3365.
H1 is still forming a clear downtrend. 3309 is the immediate resistance zone. is the price zone that can scalp breakout if it closes above this zone. break 3309 Gold will head to 3327 in this zone, if you want to SELL, you have to wait for confirmation from the selling candle. When the buyers push the price strongly through 3327, you have to wait for the US session resistance around 3338 yesterday. Resistance and support during the day are noted around 3275 and 3365
Tradingsignals

Gold price analysis on June 9The D1 candle on Friday broke the sideways structure and confirmed the downtrend for Gold prices.
Gold prices pushed up quite high in today's Tokyo trading session after touching the Gap zone around 3395.
With this upward force, 3319 will be available at the end of the Asian session. This zone can wait for a reaction and SELL can return because this is the zone where the Sellers pushed the price down at the beginning of the session. The European session will pay more attention to the 3334 zone with a break out point that is also quite important. The upward force will be stopped by the Sellers at the daily resistance level around 3345.
SELL is following the trend and can sustain the profit far away, while the BUY points are considered to find the reaction wave to increase and correct. The first zone is 3295, the second zone is around 3275.
Wishing you a successful trading day

Gold Trading Strategy June 9The D1 candle cluster on Friday broke the sideway structure near the AHT peak and confirmed the downtrend for Gold price by breaking through 50% of the main bullish candle on June 2.
After touching the Gap zone around 3395. Gold price pushed up quite high in Tokyo trading session today and headed towards the first resistance levels around 3319. This area can wait for reaction and SELL to return because this is the area where the Sellers accumulated quite strongly at the beginning of the session.
The European session will pay more attention to the 3334 area with a breakout point also quite important on Friday. If from 3334 the gold price falls, it will form a strong fall according to the downtrend structure and head towards 3275 soon.
SELL is following the trend and can sustain profits far away, while BUY points are considered to find a corrective reaction wave, so narrow expectations.
Support: 3295, 3275
Resistance: 3319, 3334, 3345, 3359
Wish you a successful trading day

Trent Ltd: Breakout or Fakeout?Trent Ltd: Breakout or Fakeout? Someone’s positioning — the question is which side.
Trent Ltd remains one of the more resilient players in India’s retail landscape. While broader consumer sentiment remains mixed, the company continues expanding its footprint, especially through its Westside stores and fashion vertical. Recent earnings have been stable, and institutional interest appears to be creeping back in — confirmed by a steady rise in volume.
Technically, we’re at a decision point. Price is testing a major descending trendline drawn from the all-time highs. So far, no breakout — but signs of accumulation are building. All major EMAs (50/100/200) are below the price, putting buyers firmly in control. Volume is rising on bullish candles, with no signs of distribution. RSI is holding above 50, climbing steadily, and showing a healthy impulse without overheating — plenty of room left for upside.
The key setup: wait for a confirmed breakout above the trendline, then a retest, and only after that consider entering. Targets, based on Fibonacci levels, line up cleanly:
tp1: 6337.60 (0.618)
tp2: 7484.65 (1.0)
tp3: 8301.40 (1.272)
Until then — this is a watching game, not a trading one. Momentum is building, the structure is clean — but confirmation is king.

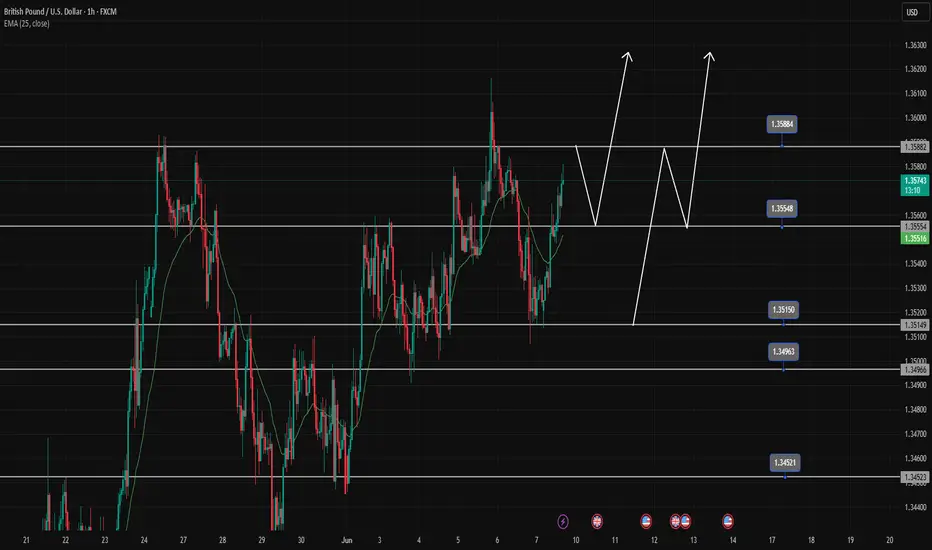
Buy opportunity when price retraces to break the topGBPUSD encounters resistance at 1.358, there is a high possibility that there will be a price reaction to 1.35500 to create a Dow break 1.358 towards higher levels.
GBPUSD is increasing very strongly again in the main trend, we wait for a retracement to the support zones, which is a strong buying opportunity.
1.358-1.355-1.351-1.345 are BUY zones when the price has a reaction of buying force at these price zones.
Nifty Gave Breakaway Gap Strong Bullish SignalWhat is Breakaway GAP?
A breakaway gap refers to the situation in the market where there is a strong price movement that crosses support or resistance. Breakaway gaps are formed after substantial periods of consolidation of prices in the market. It signifies a break from the previous trading range or pattern, and it suggests that a new trend or direction is emerging.
Nifty was trading in a range for 5 days and today 6/09/2025 it gap up and sustained above 25000 crucial level, the importance of break-away gap is that it's very strong sign of bullishness in market this also strong support too so if nifty come to retrace it would become support around 25000 level,
if nifty break today opening rang then it's very likely that it will go further so there are possibly Two entry Sign for Long: - first, OR breakout, second: -retracement on 15 Min chart near 20 Ema -50 Ema. Thats My opinion

Ripple Analysis - What Shall we Expect !!!If the price can break through this channel's resistance, I expect it to reach $2.5 in a short time.
Stay Awesome , CobraVanguard

SHREE DIGVIJAY CEMENET AT LONG TERM SUPPORT ZONEThis is the Weekly chart of SHREDIGCEM.
SHREDIGCEM is trading near it's long term support zone at 60-70 range.
stock has been moving within a long-term parallel channel, with a well-established support zone in the range of ₹65–₹70.
Currently, the stock is forming a broadening pattern near its support zone, with the pattern support range between ₹70–₹75.
If this level is sustain then,we may see higher prices in SHREDIGCEM.

Gold Overview Strategy June 6The 3-candle D1 cluster did not close above 50% of the main bullish candle on Friday last week. Today's main view will be to BUY to 3413.
Today's resistance is around 3413 for the SELL strategy of the US Session. The Asian-European session is looking for a BUY point. There was just a nice BUY wave around 3363 where the price swept liquidity to 3359.
3382 is the target for the BUY order and this area can SELL Scalp in today's Asian-European session for a recovery wave because today's target is up to 3413 according to the bullish structure.
In the direction of Gold Down, contrary to our analysis, the support zone 3341 and support 3324 will support the upward force of gold prices.
The breakout boundary zone 3382 and 3341. Pay attention to breaking out from important resistances, then do not trade against the trend.
Resistance: 3373-3382-3399-3413
Support: 3357-3341- 3325

LINK's situation+ Target PredictionSo if you pay attention to the LINK chart you can see that the price has formed a Ascending wedge which means it is expected to price move as equal as the measured price movement.( AB=CD )
NOTE: wait for break of the WEDGE .
Give me some energy !!
✨We spend hours finding potential opportunities and writing useful ideas, we would be happy if you support us.
Best regards CobraVanguard.💚
_ _ _ _ __ _ _ _ _ _ _ _ _ _ _ _ _ _ _ _ _ _ _ _ _ _ _ _ _ _ _ _
✅Thank you, and for more ideas, hit ❤️Like❤️ and 🌟Follow🌟!
⚠️Things can change...
The markets are always changing and even with all these signals, the market changes tend to be strong and fast!!

Gold Price Analysis June 63 D1 candles closed without breaking through 50% of the previous bullish main candle. Today's main view will be BUY up to 34xx
Today's resistance is around 3413 for the SELL strategy of the US Session. The Asian and European Session is looking for a BUY point. There was just a nice BUY beat around 3363 where the price swept liquidity to 3369.
3382 is the target for the BUY order and this area can SELL Scalp in today's Asian and European session because today's target is up to 3413.
In the direction of Gold Down, contrary to the analysis, the support zone 3341 and support 3324 will support the upward force of gold prices.
Breakout boundary zone 3382 and 3341. Note that the break out does not block the train

Gold Price Analysis May 6D1 Frame
It is not surprising that the price has increased again. If this momentum continues, the 3408 level can be reached today.
H1 Frame
The uptrend is clear, heading towards the area above 3400.
3363 is a good support zone, suitable for BUY orders in the Asia - Europe session.
3344 is an important level. If broken, the short-term uptrend will be broken and we need to wait for a new wave.
Resistance to watch
3382 is the nearest resistance zone in today's session.
3397 is an area prone to false breaks (old peaks). The price may react slightly here before reaching the 3408 level.

Trading strategy in US sessionGold price in the short term of the US session. The pulling of the h1 candle's wick creates an important liquidity zone of 3373. When h1 closes above this zone, it confirms that the US session will be a bullish session and can reach 3398 at the end of the session. If it closes below 3373, the BUY zone will be noticed at the support reaction in the European session around 3362.

EURUSD short term analysis in US sessionEURUSD is trading in the price range of 1.161 and 1.158. It is unlikely that there will be a breakout through this price range today. If the pair retreats slightly to 1.156, it is considered a good buy signal. Let's wait and see what the next short-term developments of EURUSD are.
I will send you the long term analysis of the pair tomorrow.

Gold Trading Strategy Overview June 5There is not much surprise with the D candlestick having increased again. The increase can completely reach 3408 today.
The H1 wave structure also shows that the trend is increasing strongly and heading towards above 3400. 3363 is considered the first BUY support zone in the Asian and European sessions today.
3344 is the most important boundary zone of the trend, breaking this zone will cause the uptrend to break to 3400 in the short term and must wait for new uptrend waves.
In the opposite direction, 3382 is the resistance zone of the Asian and European sessions today and is also the breakout zone, this zone will reach above 3400 but before that there will be a reaction around 3397, which is a very likely flash break zone of the previous peak.
Resistance: 3382-3397-3410
Support: 3363-3344-3325-3317
Pay attention to trading at support and resistance zones when there is confirmation

Trading Strategy After ADP Nonfarm NewsPay attention to the trading range in the US session when ADP news is released. 3365 and 3343 are sideways ranges.
We can wait for a breakout trading strategy of this price range.
H1 closes above 3350, we will have a trading strategy towards 3365 and wait for the reaction in the next range. If it breaks, DCA will go up to 3390.
If it closes below 3351, wait for it to close below 3343 and retest to SELL to 3325

Minswap looks like a good entry here.Trading Fam,
I'm seeing great potential on this Minswap entry.
First, we're oversold on all lower indicators.
Secondly, we're back inside of a green liquidity block.
Third, we're on excellent support (aqua trendline).
This trade is a no brainer. I'm setting my target for an easy 25% profit target at which point I'll take half off and let the rest ride a bit longer, trailing my stops as I go.
Stew

Simple yet effective strategy for the American sessionHello everyone. Also a long-time trader who has just joined the tradingview platform. Hope you are interested and interact with me.
Gold is reacting in the candlestick area of the US session. The possibility of a bounce from this 3352 area is quite high.
And in the US session, if it breaks 3361, it can reach 3375. If this 3352 area is broken, the possibility of a corrective downtrend will continue and we will wait for a sell break of 3352, the target can reach 3325.

EGLD Analysisno need to say something , chart is speaking it self .Remember Ride the wave of the trend and let it guide you.
Best regards CobraVanguard.💚

EURUSD is looking for price reactionEURUSD is facing the support zone of 1.138. The price reaction of the buyers is jumping into the market, you think this is a nice BUY signal.
You can set up a BUY signal for the pair towards the target of 1.141 in the short term.
In case the h1 candle closes below 1.138, you have to wait for the next BUY zone around 1.134 to be able to BUY and aim for the original target

Gold Price Analysis June 3D1 candle confirms strong price increase by breaking the previous selling zone around 3365 and breaking the trendline structure
On the h4 time frame, it shows quite nice price increase waves. On h1, it shows that this morning's Asian session has profit-taking waves from sellers, leading to gold prices worth retesting important support zones.
3353 has reacted once, many zones are considered buying opportunities today. 3332, 3325, 3315 are considered price reactions for long-term BUY signals today, which can push up to 34xx
If 3353 remains stable, Gold will push up to 3390 to react once before touching the daily resistance zone around 3408

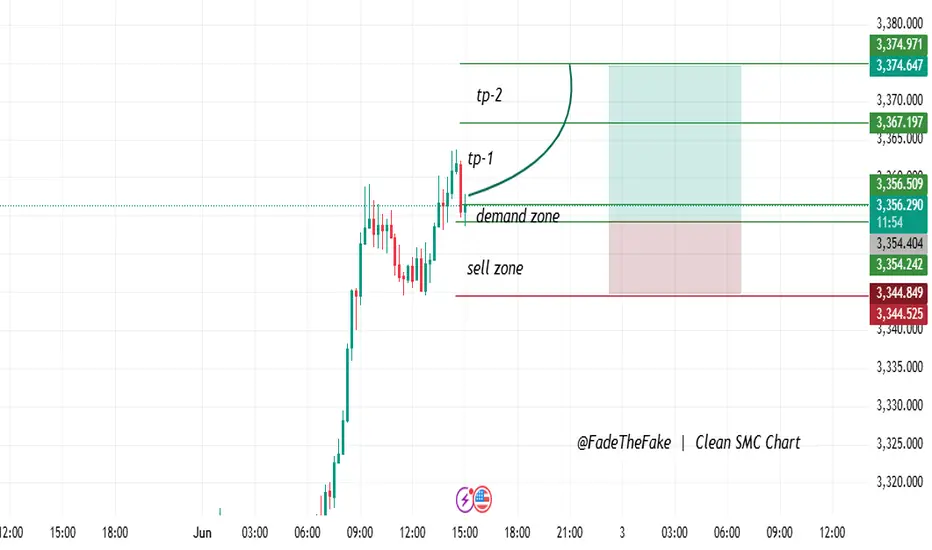
"Demand Zone Play – Targeting Fresh Highs!"Clean Buy Setup | Reaction in Demand Zone
- Price has touched a well-defined demand zone.
- Confirmed bullish reaction with good wick rejections.
- Placed entry just above the zone, stop loss below structural low.
- Targeting more liquidity zones as TP1 and TP2.
Entry: 3356.50
SL: 3344.50
TP1: 3367.20
TP2: 3374.97
This concept draws on a blend of Smart Money Ideas and Demand/Supply Zones
BEST XAUUSD M30 BUY SETUP FOR TODAY 📈 Gold (XAU/USD) is showing bullish momentum on the 30-min chart, trading within a rising parallel channel. Price has recently bounced from lower support and is aiming for the resistance zone near $3,331. 🔼 A breakout above this level could signal further upside, continuing the bullish wave structure. Traders should watch for pullbacks to the lower trendline as potential buying opportunities. 🧠💡 As long as price stays above the $3,251 support, the bullish bias remains intact. 📊✨
