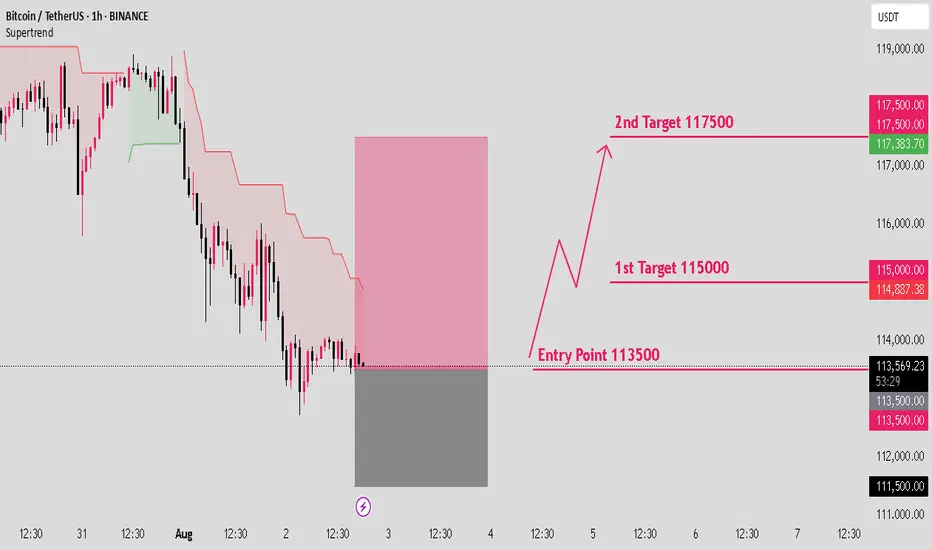
BTCUSD long setup: Targeting the next bull move.Hello IGT FOLLOWERS
Here is my BTCUSD overview, Bitcoin is showing bullish momentum after holding strong support near $112,000. A breakout above the $115000 resistance suggests buyers are regaining control. RSI is turning upward, and volume is increasing on green candles signaling demand. As long as price holds above $113,000, bulls may push toward the $117,500 target.
Key points :
Entry point : 113500
1st Target : 115000
2nd Target : 117500
Follow me for more latest updates and signals
Tradingstrategies
From Fakeout to Takeoff: How the V-Pattern REALLY WorksEver seen a support level break, only for the price to rocket back up in a V-shape? That’s the V-Pattern in action! In this post, Skeptic from Skeptic Lab breaks down the step-by-step mechanics of this powerful setup. From the fakeout that traps short sellers to the surge of buy orders from liquidations, you’ll learn exactly how buyers flip the script and create explosive reversals. Perfect for traders looking to spot high-probability setups. Join me to decode the markets—check out the steps and level up your trading game!

Quantum's Missed IWM Short 8/1/25Well had a moment where I backed out of a A+++ setup. IWM had a ton of -gex pull down to 206. Would have been a massive short to end the week. I canceled my order instantly for no reason at all and missed it. Overall had a great day but this is what separates the elite from the average trader. Will work on this next week.

Quantum's TSLA & NVDA Trades 8/1/25Simply breaking down what I look at going into the trading day. Premarket watchlist was short but nailed TSLA short for 150% and could have made double that on TSLA and NVDA longs. Due to hitting my daily goals I had to walk away to avoid overtrading but what an amazing day.

BTCUSD Market Breakdown – Liquidity Sweep Incoming?BTCUSD Market Breakdown – Liquidity Sweep Incoming?
🔍 Technical Analysis (July 29, 2025)
Chart Observations:
1. BOS (Break of Structure):
Multiple BOS events are identified, confirming key directional shifts in market structure. The last BOS near the support zone signals bearish intent.
2. Bearish Fair Value Gap (FVG):
A clean bearish FVG is left behind after a sharp drop on the 25th, indicating institutional imbalance and potential retracement area. Price rejected from that FVG later.
3. Equal Low & Sellside Liquidity:
The highlighted equal lows around July 25-26 mark areas of resting liquidity—prime targets for smart money manipulation.
4. New FVG Formed (July 28):
Another bearish FVG appears just before the projected breakdown, strengthening the case for a bearish continuation.
5. Support Zone Target – $115K:
A clean support zone (marked between 114,500–115,500) sits directly below the current market price. This is the likely liquidity target after sweeping equal lows.
6. Volume Profile (VRVP):
Low-volume nodes between the current price and support suggest minimal resistance to a sharp downward move.
⸻
🎯 Conclusion:
The structure, FVGs, and liquidity pools all point toward a liquidity raid below the equal lows, aiming for the support target near $115K. Traders should watch for a decisive break below the current range, especially if the FVG acts as resistance again.

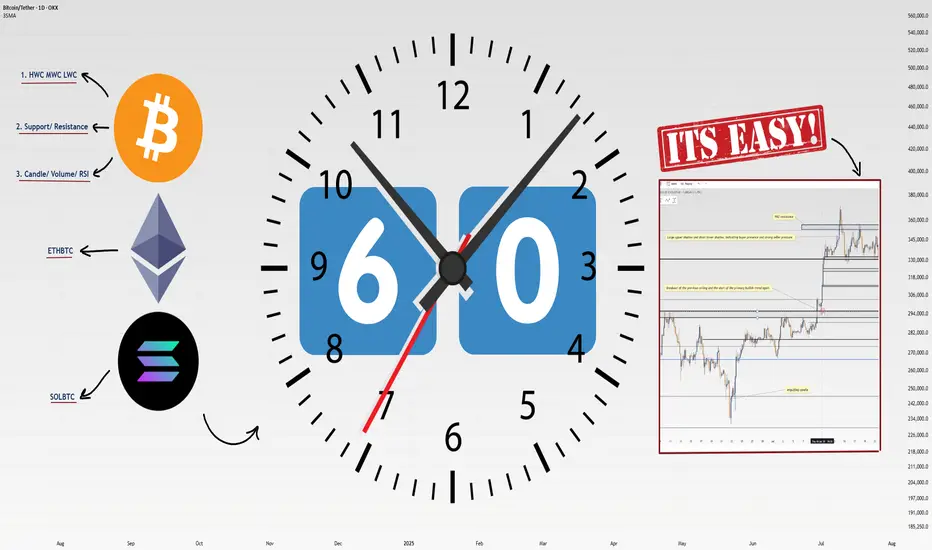
How I Analyze Any Coin in 60 Seconds: 4-Step Masterclass!Heyy traders, it’s Skeptic from Skeptic Lab! 🩵 I’m breaking down my lightning-fast method to analyze any coin in just 60 seconds . This 4-step process is how I spot long/short triggers like a pro. Buckle up, let’s dive in:
✔️ Step 1: Identify HWC/MWC/LWC (10 seconds)
Nature’s got a cool vibe—bet a lot of you hit the outdoors on weekends. When I see an apple tree from afar, it’s majestic, but up close, I spot branches and worm-eaten fruit. From a distance, I miss the details; up close, I lose the tree’s grandeur. Markets work the same. You need different timeframes to grasp the market structure. With practice in Dow Theory, trends, and tools, spotting HWC (Higher Wave Cycle), MWC (Mid Wave Cycle), and LWC (Lower Wave Cycle) becomes second nature. For me, this takes 10 seconds.
Want a full HWC/MWC/LWC guide? Check my free article I wrote a while back—it’s a hands-on tutorial ( link Cycle Mastery ).
📊 Step 2: Draw Support/Resistance Lines (20–30 seconds)
I start with higher timeframes: Monthly, then Weekly, then Daily. Once I’ve drawn lines up to Daily, I don’t always redraw for lower timeframes—often, I just adjust them.
Pro tip : Give more weight to the right side of the (recent data) since it’s fresher and more valuable. I change line colors for 4-hour lines, so I know they’re less critical than Daily. I don’t draw lines below 4-hour, but if you’re a scalper, tweak this to your strategy. This step takes me 20–30 seconds, the longest part.
📉 Step 3: Analyze Candles, Volume, Oscillators, and Indicators (10–15 seconds)
Here, I check everything I can: candles, volume, oscillators, and indicators . The goal? Stack confirmations for my triggers. Think RSI hitting overbought, volume spikes, larger candle sizes, or momentum surges—you get the vibe. This step’s length depends on your tool mastery. For me, it’s quick because I know what to look for.
🔔 Step 4: Check Coin Dominance (5–10 seconds)
This is the most critical yet simplest step. We need to track where liquidity’s flowing . For example, if SOL/BTC is bearish, I skip buying Solana—liquidity’s exiting. BTC.D (Bitcoin Dominance) is also key. The relationships dominance creates are complex and don’t fit in one analysis, but if you want a full dominance tutorial, drop it in the comments!
🔼 Key Takeaway: Using these 4 steps—HWC/MWC/LWC, support/resistance, candles/indicators, and dominance—I analyze any coin in 60 seconds. Your speed depends on experience and knowledge. If you’re new, this might take 60 minutes per coin, but don’t sweat it— practice makes you lightning-fast . Thanks for vibing with this educational idea! <3 I’ll catch you in the next one—good luck, fam!
💬 Let’s Talk!
Want a dominance tutorial or more tips? Hit the comments, and let’s crush it together! 😊 If this guide lit your fire, smash that boost—it fuels my mission! ✌️
BTCUSD Key Supply Zone Rejection – Bearish Target Mapped BTCUSD Key Supply Zone Rejection – Bearish Target Mapped (Educational Breakdown)
⸻
🧠 Technical Analysis (1H Chart):
• Range Structure: BTCUSD is currently trading within a well-defined consolidation range between the Resistance Zone ($119,850–$120,591) and the Support Zone ($116,937).
• Volume Profile (VRVP): Volume is noticeably thick near the mid-range, suggesting accumulation/distribution behavior. Price is struggling to break above the value area high near $120K.
• Resistance Rejection: After testing the upper supply zone, price failed to sustain bullish momentum and is showing signs of exhaustion – a possible sign of institutional selling.
• Target Zone: If price rejects this resistance again, a strong move toward the target level of $117,260 is expected. This aligns with:
• Mid-range liquidity sweep
• Low-volume node (LVN) below current price
• Fair Value Gap fill near $117,200–$116,900
⸻
🧩 Key Concepts Highlighted:
• Support & Resistance Mapping
• Volume Profile Readings
• Institutional Order Flow Bias
• Target Projection using Smart Money Concepts
⸻
⚠ Educational Insight:
This setup is a perfect example of how to combine Volume Profile + Price Action to identify liquidity traps and smart entries. Always wait for confirmation near key zones — not every level breaks!
⸻
✅ Trade Plan (Not Financial Advice):
• Watch for bearish engulfing/rejection wick at resistance
• Short entry below $119,000 with SL above $120,600
• Target: $117,260 / Final TP: $116,937 zone

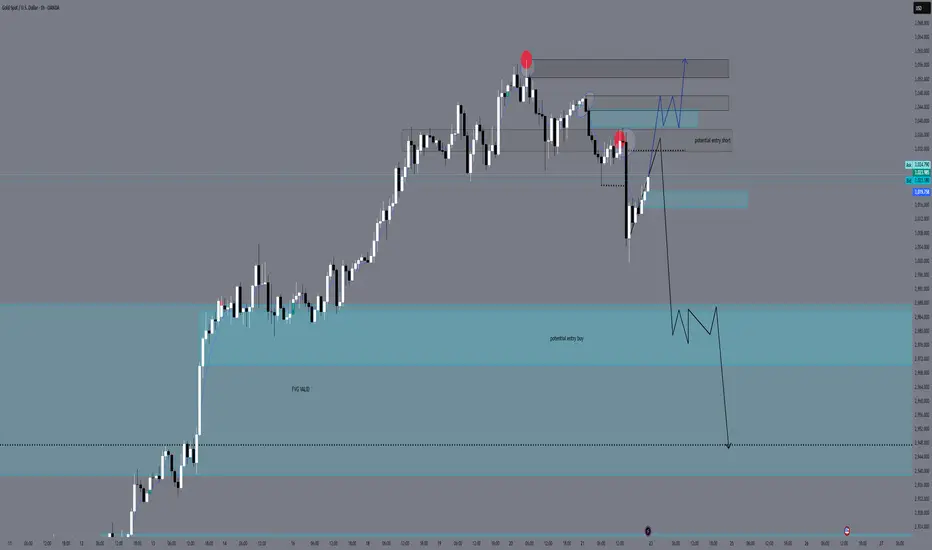
GOLD - The One That Survived All Ages - Trading PsychologySummer light reading between trades💫
From Ancient Gods to modern banks — Gold never needed marketing to be priceless.
Gold was never invented.
It was found, worshipped, stolen, buried, and bled for.
Long before charts, before forex pairs, before brokers — it was power.
So if you're wondering why this metal moves the world?
Let’s take it back — way back.
But before we dive into history, here’s why traders are addicted to XAUUSD:
It’s fast. Ruthless. Liquid. It can deliver a week’s profit in one candle — or wipe you out in seconds.
If you understand structure, it will reward you like nothing else.
If you’re lazy, impulsive, or just guessing?
It’ll humble you fast and without mercy.
The Discovery – Gold Before Currency
• Gold was first discovered in Paleolithic caves (~40,000 B.C.), admired purely for its beauty.
• Ancient Egyptians called it “The flesh of the Gods” — Pharaohs were buried with it, because in their mind, you couldn’t enter the afterlife without gold.
• No value was assigned — it simply was value.
Empire Fuel – Gold as the Engine of War
• The Roman Empire used Gold Coins (Aureus) to expand its reach.
• Spain and Portugal built fleets just to steal it from the Americas.
• Entire wars were started and sustained by it — Gold wasn’t a luxury; it was national survival.
Gold & the Banks – Trust in a Metal
• 1816: The UK made Gold its official standard.
• By the early 1900s, most major economies followed — every currency was tied to the physical rulling metal .
• Why? Because you can’t print trust. But you can weigh it.
• Even today, central banks don’t hoard crypto or tech stocks — they hoard Gold, quietly, relentlessly.
Collapse, Rebirth, and Chaos – The Modern Era of Gold
• 1971: U.S. President Nixon kills the gold standard.
➤ Until then, every dollar had to be backed by real gold in U.S. vaults.
➤ After that? Dollars became promises, not assets.
• Welcome to the fiat era — where money has no anchor, just hope.
• Gold, no longer “money,” became something more powerful:
➤ The panic button, the global fallback, the last honest asset when everything else crumbles.
• And crumble it did:
🔹 2008: Banks collapse — Gold soars.
🔹 2020: Global lockdown — It explodes.
🔹 2022–2024: War, inflation, debt ceilings, de-dollarization — Gold reclaims the throne.
When fear wins, this metal doesn’t blink. It rises.
From Ancient Tombs to 2025 – Gold’s Unshakable Throne
• Today, you stare at candlesticks.
You mark order blocks, gaps, and key level zones.
But beneath that technical setup is a story written in blood, empire, and survival.
• Gold has outlived Kings. Outlasted currencies. Outsmarted every attempt to replace it.
You can crash a stock. You can ban a coin.
But you can’t cancel this number 1.
• And now? It’s 2025.
The world is uncertain. Digital assets are volatile.
And Gold is still the most traded, most hoarded, most feared asset on Earth.
• You’re not here by accident. You chose to trade this beast — not because it’s easy, but because you know what it means to master chaos.
So you’re not trading a metal.
You’re trading a legacy, so pay respect.
Every setup is a whisper from history — and every move on Gold is just the past repeating itself…
Only this time, the empire isn’t outside.
It’s YOU.
And your chart is your battlefield. So make an effort and study XAUUSD before trading it.
If this lesson helped you today and brought you more clarity:
Drop a 🚀 and follow us✅ for more published ideas.

Overfitting Will Break Your Strategy — Here’s Why█ Why Your Backtest Lies: A Quant’s Warning to Retail Traders
As a quant coder, I’ve seen it time and again: strategies that look flawless in backtests but fall apart in live markets.
Why? One word: overfitting.
Compare the signals in the images below. They’re from the same system, but one is overfitted, showing how misleading results can look when tuned too perfectly to the past.
⚪ Overfitting is what happens when you push a strategy to perform too well on historical data. You tweak it, optimize it, and tune every rule until it fits the past perfectly, including every random wiggle and fluke.
To retail traders, the result looks like genius. But to a quant, it’s a red flag .
█ Trading strategy developers have long known that “curve-fitting” a strategy to historical data (overfitting) creates an illusion of success that rarely holds up in live markets. Over-optimizing parameters to perfectly fit past price patterns may produce stellar backtest results, but it typically does not translate into real profits going forward.
In fact, extensive research and industry experience show that strategies tuned to past noise almost inevitably disappoint out-of-sample.
The bottom line: No one succeeds in markets by relying on a strategy that merely memorized the past — such “perfect” backtests are fool’s gold, not a future edge.
█ The Illusion of a Perfect Backtest
Overfitted strategies produce high Sharpe ratios, beautiful equity curves, and stellar win rates — in backtests. But they almost never hold up in the real world.
Because what you’ve really done is this:
You built a system that memorized the past, instead of learning anything meaningful about how markets work.
Live market data is messy, evolving, and unpredictable. An overfit system, tuned to every quirk of history, simply can’t adapt.
█ A Warning About Optimization Tools
There are many tools out there today — no-code platforms, signal builders, optimization dashboards — designed to help retail traders fine-tune and "optimize" their strategies.
⚪ But here’s the truth:
I can't stress this enough — do not rely on these tools to build or validate your strategy.
They make it easy to overfit.
They encourage curve-fitting.
They give false hope and lead to false expectations about how markets actually work.
⚪ The evidence is overwhelming:
Decades of academic research and real-world results confirm that over-optimized strategies fail in live trading. What looks good in backtests is often just noise, not edge.
This isn’t something I’ve made up or a personal theory.
It’s a well-documented, widely accepted fact in quantitative finance, supported by decades of peer-reviewed research and real-world results. The evidence is overwhelming. It’s not a controversial claim — it’s one of the most agreed-upon truths in the field.
█ Why Overfitting Fails
Let me explain it like I do to newer coders:
Random patterns don’t repeat: The patterns your strategy "learned" were noise. They won't show up again.
Overfitting kills the signal: Markets have a low signal-to-noise ratio. Fitting the noise means you've buried the signal.
Markets change: That strategy optimized for low-volatility or bull markets? It breaks in new regimes.
You tested too many ideas: Try enough combinations, and something will look good by accident. That doesn’t make it predictive.
█ The Research Backs It Up
Quantopian’s 888-strategy study:
Sharpe ratios from backtests had almost zero predictive power for live returns.
The more a quant optimized a strategy, the worse it performed live.
Bailey & López de Prado’s work:
After testing enough variations, you’re guaranteed to find something that performs well by chance, even if it has no edge.
█ My Advice to Retail Traders
If your strategy only looks great after a dozen tweaks… It’s probably overfit.
If you don’t validate on out-of-sample data… you’re fooling yourself.
If your equity curve is “too good” to be true… it probably is.
Real strategies don’t look perfect — they look robust. They perform decently across timeframes, markets, and conditions. They don’t rely on lucky parameter combos or obscure filters.
█ What to Do Instead
Use out-of-sample and walk-forward testing
Stick to simpler logic with fewer parameters
Ground your system in market rationale, not just stats
Risk management over performance maximization
Expect drawdowns and variability
Treat backtest performance as a rough guide, not a promise
Overfitting is one of the biggest traps in strategy development.
If you want your trading strategy to survive live markets, stop optimizing for the past. Start building for uncertainty. Because the market doesn’t care how well your model memorized history. It cares how well it adapts to reality.
-----------------
Disclaimer
The content provided in my scripts, indicators, ideas, algorithms, and systems is for educational and informational purposes only. It does not constitute financial advice, investment recommendations, or a solicitation to buy or sell any financial instruments. I will not accept liability for any loss or damage, including without limitation any loss of profit, which may arise directly or indirectly from the use of or reliance on such information.
All investments involve risk, and the past performance of a security, industry, sector, market, financial product, trading strategy, backtest, or individual's trading does not guarantee future results or returns. Investors are fully responsible for any investment decisions they make. Such decisions should be based solely on an evaluation of their financial circumstances, investment objectives, risk tolerance, and liquidity needs.

Risk and Probability in Trading — Why Risk Assessment MattersRisk and Probability in Trading — Why Risk Assessment Matters More Than Chasing the “Holy Grail”
In trading, most participants and analysts are focused on finding the so-called “Holy Grail” — the perfect entry point where the price moves in the desired direction and yields profit. However, few actually assess the risks involved, as if success is possible without factoring them in. Market reviews are often filled with levels, forecasts, and price directions, but rarely include probability estimates or potential losses.
In my view, the real Holy Grail isn't a guaranteed profitable entry, but a scenario where the market offers a position with minimal risk relative to historical context. To identify such setups, we need a risk scale based on historical data — how favorable the current risk-to-reward ratio is compared to the past.
It’s also crucial to understand that no one can predict price direction with certainty. The key to opening a position is not hope, but evaluating all possible scenarios — upward, downward, or sideways — and knowing the outcome in each case. Risk management is more than just placing a stop-loss; it’s a structured approach that should be central to any trading strategy.
What Are Minimal Risks?
“Minimal risk” is a relative concept — it only makes sense when measured against a defined scale. Building such a scale requires historical statistics: what were the maximum and minimum losses and profits for similar positions in the past?
Profit-to-Loss Ratio
The idea behind the search for the “Holy Grail” is to find moments when the market offers the best possible profit-to-risk ratio. For example, if the current ratio is 10, and historically it has ranged from 0 (low risk) to 100 (high risk), then 10 may be a good entry point. If the ratio approaches 80–90, it signals that the position is extremely risky.
Why Are Probability and Risk Assessment Important?
Market reviews often talk about resistance levels, volatility, and price direction — but rarely address the risks of different scenarios. No expert can predict market movements with certainty — if they could, they’d be billionaires. Opening positions without accounting for risks and scenario probabilities is extremely dangerous.
How to Factor in Risks When Entering a Position
The key question is: what will the profit-to-loss ratio be after entering a position, depending on whether the price goes up, down, or stays flat? It’s important to understand the consequences of each case and make decisions based on risk assessment.
Risk Management Must Account for the Inability to React Instantly
Conventional tools like stop-losses and limit orders often fail to protect capital effectively during sudden price spikes. These tools are particularly vulnerable when market makers or high-frequency algorithms trigger stop levels en masse.
This highlights the need for more resilient risk management instruments — ones that can respond to volatility instantly and automatically. Options are one such tool, capable of limiting losses regardless of market dynamics.
Without robust risk management, long-term profitability becomes statistically unlikely. Sooner or later, the market will present a scenario that can wipe out your capital — unless you’re properly protected.
Important note: this is not an endorsement of options or any specific broker. It’s simply a conclusion based on the logic of building effective capital protection. If a broker only provides access to linear instruments (futures, spot, stocks) without the ability to hedge, it will inevitably lead to capital erosion — even for systematic traders.
And if this article gets more than 100 rockets, I’ll continue sharing specific examples of low-risk trading assessments.

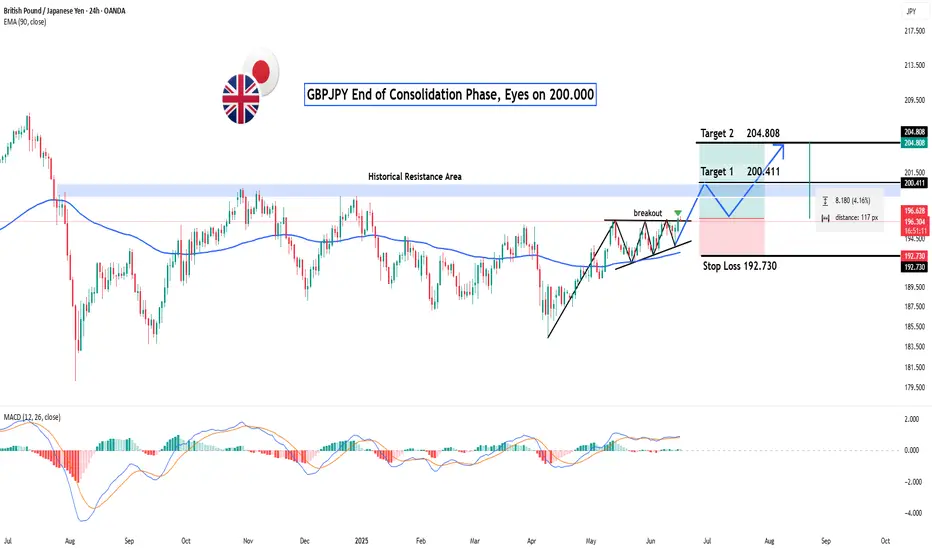
GBPJPY: End of Consolidation Phase, Eyes on 200.000?Hey Realistic Traders!
Could this be the beginning of a major bullish wave ?
Let’s Break It Down..
On the daily timeframe, GBPJPY has formed a Symmetrical Triangle Pattern, followed by a bullish breakout, a classic technical signal that typically marks the end of a consolidation phase and the start of a new bullish trend. This move is further confirmed by the appearance of a strong bullish candlestick, reflecting a surge in buying momentum.
Supporting this bullish scenario, the MACD indicator has also formed a bullish crossover, where the MACD line crosses above the signal line. This crossover is widely regarded as a momentum shift from bearish to bullish, strengthening the case for continued upward movement.
Given these technical signals, the price is likely to advance toward the first target at 200.411, with a potential extension to 204.808.
This bullish outlook remains valid as long as the price holds above the key stop-loss level at 192.730.
Support the channel by engaging with the content, using the rocket button, and sharing your opinions in the comments below.
Disclaimer: "Please note that this analysis is solely for educational purposes and should not be considered a recommendation to take a long or short position on OANDA:GBPJPY ".
CHAMBAL FERTILIZERS FOR SWING TRADECHAMBAL FERTILIZERS a good opportunity for swing trade plan, entry and exit point mention, add your watchlist and observe.
This is for Education purpose only...


GOLD (XAUUSD) Technical Analysis – MMC Strategy Breakdown🧠 Conceptual Foundation:
This analysis is rooted in Market Maker Concepts (MMC), focusing on how smart money manipulates liquidity, traps retail traders, and shifts structure before making big moves. The GOLD market today gave us a high-probability setup that combined several key technical elements: SR interchanges, structure shifts, trendline breaks, and a major arc pattern.
Let’s dissect it step-by-step:
1️⃣ Initial Downtrend & Liquidity Sweep
In the early part of the chart, GOLD was in a clear bearish trend, forming lower highs and lower lows, consistently respecting a descending trendline. This downtrend attracted retail sellers who kept entering shorts, reinforcing the bearish sentiment.
🔻 However, right before the reversal, GOLD made a sharp move down to grab liquidity below previous lows near the $3,361–$3,364 support zone. This is a classic MMC liquidity trap — clearing out stop-losses of early buyers before initiating a reversal.
2️⃣ SR Interchange Zones (Smart Money Play)
Around the levels of $3,361 and $3,364, we noticed strong Support-Resistance Interchange (SR Flip) behavior:
These zones were first used as support during the initial decline.
Once broken, they acted as resistance, and again flipped to support post-breakout.
This flip signals institutional involvement — smart money often builds positions in these zones.
These interchanges also acted as the base of accumulation, preparing for a bullish breakout.
3️⃣ Trendline Breakout – Early Reversal Confirmation
As the price consolidated and coiled around the SR zones, it finally broke the descending trendline — a major reversal signal.
This breakout was accompanied by strong bullish candles, showing a sudden shift in momentum. It's likely that smart money stepped in aggressively, initiating a structure shift.
4️⃣ Arc Pattern Formation – Visual Clue of Accumulation
The most eye-catching part of this chart is the arc pattern — a rounded bottom formation. This type of pattern typically indicates accumulation phase, where institutions quietly enter positions while retail sentiment is confused or bearish.
🟡 The arc acts like a pressure cooker: as price coils and liquidity builds, it eventually explodes in the direction of accumulation — in this case, bullish.
5️⃣ Structure Shift – Confirmation of Bullish Intent
Once price broke above the internal structure (previous lower highs), it confirmed a structure shift from bearish to bullish.
📈 This is one of the most critical elements in MMC:
It tells us that smart money has reversed the flow.
The shift often leads to expansive moves in the new direction (as we saw here).
6️⃣ Next Reversal Area (Key Supply Zone)
Price continued surging upward and reached a predefined Reversal Area around $3,405–$3,410. This zone is likely to contain historical supply and institutional sell orders.
As expected:
Price showed early rejection signs from this level.
A potential short-term pullback or distribution phase may now be underway.
If bulls reclaim this zone, it may lead to further upside toward $3,420–$3,430.
📌 Key Technical Highlights:
Component Observation
Trendline Clean break signals momentum shift
SR Interchange Zones Strong demand re-entry near $3,361–$3,364
Arc Pattern Indicates bottoming and accumulation phase
Structure Shift Broke prior lower highs confirming bullish bias
Reversal Zone $3,405–$3,410 acting as resistance; possible rejection/pullback point
🔮 What to Expect Next?
If price rejects the $3,405–$3,410 zone again and forms a lower high, expect a pullback to $3,375–$3,380.
A break above the reversal zone with strong volume may open the door to new highs, targeting $3,420+.
Use caution around news events or high-impact fundamentals (e.g., USD data releases).
💡 Trading Strategy Ideas:
✅ Long Scenario (Already Played Out):
Entry: Post-trendline break + arc confirmation
TP1: Reversal Zone at $3,405
SL: Below $3,361 SR Flip
🔁 Potential Short Setup:
Entry: On bearish confirmation from $3,405–$3,410
TP1: $3,375
TP2: $3,364
SL: Above $3,412 (reversal zone high)
📢 Final Thoughts:
This chart is a great example of how MMC (Market Maker Concepts), when combined with clean price action tools like trendlines, SR zones, and structure shifts, can offer high-accuracy trades.
Don't chase price. Wait for zones to react. Let the market show its hand before taking action.

EURJPY Weekly Analysis – Major Structural Breakout & Target🧱 1. Consolidation Zone: The Dual Directional Area
From around August 2024 to May 2025, EURJPY traded inside a well-defined consolidation range, marked between approximately 155.00 to 165.00. This phase can be categorized as a Dual Directional Zone, meaning both buyers and sellers had tactical entries, but the market was in accumulation/distribution mode.
This phase often traps breakout traders and builds liquidity on both sides.
Price repeatedly swept highs and lows inside this zone but lacked any commitment, signaling that larger players were building positions.
The flat structure over months hinted that a major move was imminent.
⚠️ 2. Major CHoCH (Change of Character)
The first clue of shifting momentum was the CHoCH, which signaled a change in direction and flow of control.
The lower highs and lower lows began to shift into higher lows, showing buying strength beneath the surface.
This change didn’t immediately lead to breakout, but it marked the early intention of bullish dominance.
🚀 3. Major BOS (Break of Structure): Confirming the Bullish Bias
The clean break above the range high was the confirmation of a major bullish BOS.
This wasn’t just a minor pop — it was an aggressive breakout, validating that institutional liquidity had been accumulated and was now being deployed.
The price ran swiftly toward the Bullish Target Zone (~177.50–180.00) with very little pullback, suggesting urgency from buyers or short-covering from trapped sellers.
🎯 4. Bullish Target Reached – What's Next?
Price has hit the projected Bullish Target Area — a region of prior imbalance and psychological round numbers.
Traders who caught the breakout now face a critical decision point: Will price continue higher into price discovery mode, or is this the exhaustion phase?
If price holds above the BOS level (~165.00), there’s still room for continuation. But signs of rejection or slowing momentum here could lead to a correction.
🔻 5. Bearish Alternative: Trap and Reversal Scenario
The bearish path is not out of play — in fact, this move upward could potentially be a liquidity sweep.
If price fails to stay above the BOS and rapidly closes back into the consolidation range, it would suggest a bull trap.
This would confirm a deviation, which often leads to violent reversals.
The projected Bearish Target Zone (~145.00–147.50) aligns with prior unmitigated zones and imbalance that may attract price if sentiment flips.
🧭 6. Trading Strategy & Risk Planning
For Bulls: Watch for consolidation above 165.00. Breakout + Retest entries toward 180.00 or beyond offer high R/R.
For Bears : Look for exhaustion or fakeout patterns (like a Quasimodo or supply engulfing) near current highs. A breakdown and close below 165.00 signals short entries targeting 150s and potentially 147s.
💬 Final Thoughts:
This chart is a prime example of how patience during a range and reaction after breakout pays off. Smart traders don’t chase — they prepare.
A bullish continuation may still be in play.
However, if this move was only a liquidity purge, the reversal could be deep and fast.
Stay alert, mark your key levels, and trade what you see — not what you feel.

THE KOG REPORT Bank Holiday tomorrow so we'll keep it simple and update the KOG Report on Tuesday ready for the week ahead. Please have a look at the last few KOG Reports to see how it went, wasn't a bad week at all.
This week, immediate red boxes are on the chart, there is a red box active above and the indicator is suggesting a potential retracement on the move. So we'll look for price to attempt the high, if failed we can expect the move downside into the order region where we may settle.
RED BOXES:
Break above 3365 for 3370, 3376, 3381, 3390 and 3403 in extension of the move
Break below 3350 for 3343, 3335, 3330, 3323 and 3310 in extension of the move
Please do support us by hitting the like button, leaving a comment, and giving us a follow. We’ve been doing this for a long time now providing traders with in-depth free analysis on Gold, so your likes and comments are very much appreciated.
As always, trade safe.
KOG

$CPNG is flying and has more room: 61% UpsideNYSE:CPNG has been on a heater! 🚀
First target is $35 🎯
CupnHandle breaking out = $43.65 📏
Looking for a pullback off the red barrier to enter this name after the breakout! 💪

GOLD DAILY CHART ROUTE MAP Hey Everyone,
Please see the daily chart update. As shown, the Goldturn channel is still being respected by price action. After a failed breakout attempt above the channel alongside the EMA5, we saw a rejection back toward the channels half line, a level we've identified as a potential support zone.
This support held, resulting in a bounce that aligns with our strategy of buying dips. As long as price continues to hold above this level and the EMA5 remains supportive, we could see a gradual move back toward higher levels. However, if the midline is retested and fails, and the EMA5 crosses below the half line, this could signal a potential move toward the lower boundary of the channel.
This is the beauty of our Goldturn channels, drawn using weighted averages instead of pure price action. This unique approach helps us clearly identify fake-outs and real breakouts, cutting out much of the noise that usually confuses traders.
Moving forward, we’ll focus on smaller timeframes (1H and 4H) to buy dips off the weighted Goldturns, aiming for clean 30–40 pip moves. Ranging markets are perfect for this style, allowing us to capitalize on quick moves without getting caught in the chop of larger swings.
Thank you all again for your continued likes, comments, and follows, we truly appreciate your support!
Mr Gold
GoldViewFX

Bitcoin - The Bottom Is In!Bitcoin ( CRYPTO:BTCUSD ) is reversing right now:
Click chart above to see the detailed analysis👆🏻
It was really just a matter of time until Bitcoin actually manages to create a potential short term and longer term bottom. With this monthly candle, bulls are taking over again and starting to buy cryptos quite heavily. The chart just tells us that this is not the end, but rather the continuation.
Levels to watch: $70.000, $300.000
Keep your long term vision,
Philip (BasicTrading)

Gold Target $4054 Year 2025-2026 With Reasons & 4$rules.1st Tp completed at 3341
2nd Tp 3437
3rd Tp 3622
4th Tp 3747
Final target is $ 4054 for Year 2025 to 2027
Below the Base line mentioned in chart will be the Seller profit zone which is marked as 1st Support, 2nd Support, 3rd Support & 4th Major Support.
Current Major reasons mentioned in the chart and future will be running of food, drinking water crisis and health issues will remain on high alerts (after covid 19 and pollution issues) and Insurance companies profits will be on Top of every Monthly trading results.


EUR/USD at a Pivotal Level – Will Bulls Push Higher?The EUR/USD pair is showing signs of a trend reversal after breaking above a long-term descending trendline. This breakout, coupled with an inverse head and shoulders pattern and RSI bullish divergence, signals strengthening bullish momentum. However, the price faces key resistance around 1.0500-1.0527, aligned with the 200 EMA.
A confirmed break above this level could push the pair toward 1.10+, while failure to do so may lead to a pullback before another attempt higher.

Weekly preview and trading idea for Monday 24.03.2025🔹 W1 – Weekly Bias
Bias: Bullish
SMC: Valid Break of Structure (BOS) to the upside, with consecutive higher highs.
Order Block: Last bullish OB (gray zone) still valid and respected.
Premium/Discount: Price is currently in the premium zone, indicating a higher probability of retracement.
FVG / Imbalance: Unfilled FVG zones remain between 2900 - 2800.
EMA 5/21/50/200: Price trades above all EMAs, confirming strong bullish momentum.
Key POI: 3060 – 3085 (potential reversal or reaction zone).
EQH: Potential Equal Highs forming, suggesting a liquidity grab is likely.
✅ Note: Weekly structure is intact, but we may expect a correction down into discount levels.
🔹 D1 – Daily Bias
Bias: Bullish (with active retracement)
SMC: BOS confirmed + liquidity grab above recent highs.
Price Action: Strong rejection from premium zone with a significant bearish candle.
Order Block: Valid OB between 2970 – 2990, aligning with Daily FVG.
EMA: EMA 5 and 21 are tightening up, signaling a potential short-term bearish cross.
Imbalance: Clear gap between 2985 – 2940 remains unfilled.
Daily POI: 2995 – 2970 → key zone to monitor for bullish reaction.
RSI: Not yet oversold, suggesting more room for downside movement.
🎯 Retracement Target (Daily): 2990 – 2950 for potential long setups.
🔹 H4 – Intraday Swing Setup
Bias: Bearish retracement
SMC: Confirmed BOS on H4
Order Block: Strong OB between 3025 – 3035 (origin of previous impulse drop)
FVG: Valid Fair Value Gap between 2988 – 2940
Imbalance: Still unfilled under 2970
EMA: Bearish EMA 5/21 crossover, EMA50 flattening
POI: 3030 (short setup zone), 2970 (potential buy reaction zone)
🔁 Scenario:
If price retests 3025–3030 and shows bearish PA → valid short.
If price drops into 2970–2950 and sweeps liquidity → potential long setup.
🔹 H1 – Entry Refinement
Bias: Temporary bullish correction
SMC: CHoCH printed, but no BOS yet
PA: Last reaction suggests mitigation
OB: OB zone at 3033–3037 still valid for shorting opportunities
EMA: EMA 5 and 21 remain bearish; 50 and 200 beginning to flatten
RSI: Nearing overbought – watch for signs of bearish reversal
POI (H1): 3033–3037 (short setup), 2985–2970 (buy zone)
🔹 M15 – Sniper Entry
Bias: Bullish correction in progress
SMC: CHoCH formed, waiting for confirmation of BOS
OB (M15): 3028 – 3033 → clean Order Block for possible bearish reaction
Imbalance: Unfilled gap at 3029 – 3032
EMA: EMA 5 > EMA 21 → minor bullish trend
RSI: Close to overbought – ideal for a reversal sniper short
EQH: Equal High at 3032 → ideal liquidity inducement
🎯 Sniper Trade Plan (Short):
Sell Entry Zone: 3029 – 3033
TP1: 3010
TP2: 2995
SL: Above 3035 (above OB high)
🔄 Alternative Scenario
If price breaks and closes above 3035 with bullish volume → short invalidated
Long setups only valid if price drops into discount zones (below 2985) with a bullish PA reaction + CHoCH confirmation
✅ Summary
Overall Bias: Bullish on higher timeframes, but currently in retracement → only looking for short-term sells
Sniper Short Zone: 3029 – 3033
Buy Zone to Re-enter: 2970 – 2940 (only on proper confirmations)
✨ If you enjoy my analysis, I’d really appreciate it if you followed my TradingView profile and left a boost\like on the post. Thank you!