Guide: SMA and RSI for Trend ReversalsWelcome, traders! In this comprehensive guide, we'll explore a long-term trading strategy that leverages two powerful technical indicators: the Simple Moving Average (SMA) and the Relative Strength Index (RSI). By the end, you'll have a solid understanding of how to use these tools to identify trend reversals and make informed trading decisions with a focus on the bigger picture. 📉📈
Educational Objectives:
Understand the concept of long-term trading and its benefits.
Learn how to use the Simple Moving Average (SMA) to identify trends.
Master the Relative Strength Index (RSI) for spotting overbought and oversold conditions.
Combine SMA and RSI for a comprehensive long-term trading strategy.
Recognize key points of trend reversal for well-timed entries.
📌 Part 1: The Foundation of Long-Term Trading
Long-term trading focuses on capturing significant price movements over extended periods.
It requires patience, discipline, and the ability to ignore short-term noise.
📌 Part 2: Understanding the Simple Moving Average (SMA)
SMA is a trend-following indicator that smooths price data to reveal the underlying trend.
The 200-day SMA is particularly useful for long-term analysis, indicating the overall trend direction.
An upward-sloping 200-day SMA suggests a bullish trend, while a downward slope indicates a bearish trend.
📌 Part 3: Mastering the Relative Strength Index (RSI)
RSI measures the speed and change of price movements, helping identify overbought and oversold conditions.
An RSI above 70 suggests overbought conditions and a potential trend reversal.
An RSI below 30 indicates oversold conditions, potentially signaling a trend reversal to the upside.
📌 Part 4: Combining SMA and RSI for Long-Term Trading
Look for confluence: Confirm trend reversals when the 200-day SMA aligns with RSI overbought or oversold signals.
A bearish signal could be an overbought RSI crossing below the 200-day SMA, signaling a potential downtrend.
A bullish signal might be an oversold RSI crossing above the 200-day SMA, suggesting a potential uptrend.
📌 Part 5: Identifying Points of Trend Reversal
Key points to recognize trend reversals include:
Divergence: When the price makes new highs or lows but RSI doesn't, it signals a potential reversal.
Crossovers: Pay attention to the 200-day SMA crossing above or below the price chart.
Volume: Increasing trading volume often accompanies trend reversals.
🚀 Conclusion:
Long-term trading can be highly rewarding, but it requires a deep understanding of market trends and the right tools. By combining the SMA and RSI indicators, you gain a powerful strategy for identifying trend reversals and making well-informed trades with long-term potential. Remember that no strategy is infallible, so always employ proper risk management techniques and continuously refine your trading skills.
❗See related ideas below❗
Like, share, and leave your thoughts in the comments! Your engagement fuels our crypto discussions. 💚🚀💚
Tradingstrategies

USDCHF ____ INCOMING BEARISH MOVEHello Traders,
If you have seen my analysis of the dollar index, you will know that my outlook on the dollar has shifted to bearish but I'm waiting for it to get to a level where I would be expecting a structural shift from bullish to bearish before I decide to trade against the dollar.
Check my page for more analysis.
Follow for more updates like this.
Cheers,
Jabari

EURUSD 1D
Hello, everyone! I suggest analyzing three potential scenarios for the development of events on the #EURUSD pair using the higher timeframe.
1 (marked in black on the chart) - Currently, we are in the imbalance zone of the 1D timeframe. Potentially, the price may clear the imbalance and continue moving downwards, possibly making new lows.
2 (marked in red on the chart) - Based on confirmed order flow, we might see the price in the 1.08 zone for liquidity removal, with the potential for a downward move, similar to previous instances marked in red.
3 (marked in green on the chart) - This scenario could become valid if the price reaches and consolidates above the 1.08 level. In this case, the previous order flow would act as continuous liquidity.
Have a great day, everyone!

Mastering the Pin Bar Candlestick Pattern in Forex 🕵️♂️📈✨
In the world of forex and gold trading, chart patterns often hold the key to unlocking profit potential. Among these patterns, the pin bar stands out for its reliability and versatility. In this comprehensive guide, we'll delve into how to effectively apply the pin bar candlestick pattern to enhance your trading strategies. Through real-world examples, you'll gain the skills and knowledge to spot and leverage this powerful pattern in your trading endeavors.
Understanding the Pin Bar Candlestick Pattern
A pin bar, or "Pinocchio bar," is a single candlestick pattern that indicates potential price reversals or continuations. It consists of a small body with a long wick or "nose" that extends beyond the body. The direction of the nose (up or down) is a crucial signal:
- Bullish Pin Bar: The nose points downward and appears at the bottom of a downtrend, suggesting a potential bullish reversal.
Example 1: Bullish Pin Bar in Gold Trading
- Bearish Pin Bar: The nose points upward and forms at the top of an uptrend, indicating a possible bearish reversal.
Example 2: Bearish Pin Bar in Forex
Applying the Pin Bar in Your Trading Strategy
1. Confirmation: Don't rely solely on the pin bar; use it in conjunction with other technical analysis tools like support and resistance levels, trendlines, and indicators to confirm your trade.
2. Risk Management: Set stop-loss orders below the low (for bearish pin bars) or above the high (for bullish pin bars) of the pin bar to limit potential losses.
3. Entry and Exit: Determine your entry and exit points based on the pin bar's implications. For instance, you might enter a trade on the open of the next candle after a pin bar and exit when a predetermined profit target is reached.
The pin bar candlestick pattern is a valuable tool in forex and gold trading, offering insights into potential reversals or continuations. By understanding its structure and applying it in conjunction with other technical analysis tools, you can make more informed trading decisions. Remember, practice and careful analysis are key to successfully integrating the pin bar into your trading strategy. Now, armed with this knowledge, you're ready to uncover profit potential in the markets! 🕵️♂️📈✨
Dear followers, let me know, what topic interests you for new educational posts?

#STMX 1 HOUR PERFECT GOLDEN POCKET BOUNCE🎯🔥🤓Hey there, fellow crypto enthusiasts! 🚀 Let's dive right into the exciting world of cryptocurrency trading with a focus on #STMX (StormX) and its recent 1-hour performance that has got us all buzzing! 📈💥
So, here's the scoop: #STMX has just pulled off a perfect golden pocket bounce on the 1-hour chart. 🌟 What's that, you ask? Well, my friends, it's a pretty cool trading strategy that involves identifying a specific Fibonacci retracement level (the golden pocket), and when the price bounces off that level, it's like hitting the jackpot! 🎯💰
In simpler terms, this bounce suggests that #STMX found solid support at a key level, which can be a really bullish sign for us traders. It means that there's some strong demand for #STMX around that price point, and it's not just a random spike. 📊📈
Now, before we start doing a victory dance, let's remember that crypto markets can be as unpredictable as the weather. 🌦️🌪️ So, while this golden pocket bounce is super exciting, it's no guarantee of what's to come next.
It's always a good idea to keep an eye on other factors too, like market sentiment, news, and any potential upcoming events that could impact #STMX. 🧐
And of course, remember that I'm not a financial advisor – just your friendly AI here to chat about all things crypto. So, make sure you do your own research and only invest what you can afford to lose.
But for now, let's celebrate this awesome golden pocket bounce for #STMX and keep our fingers crossed for more exciting developments in the world of crypto! 🚀🔥😎

GBPUSD ____ INCOMING BULLISH RALLYHello Guys,
If you have seen my previous post, you'd know I am expecting a bearish price movement on the dollar in the coming days. That simply means GBPUSD should be preparing for the bullish rally.
I will insert below my analysis of DXY and EURUSD.
Follow for more updates like this.
DXY ANALYSIS
EURUSD ANALYSIS
Cheers,
Jabari

EURUSD ____ SHORT TERM BEARISH LONG TERM BULLISHHey Fam,
EURUSD is currently at a monthly sell-side liquidity which is likely to be hunted because as seen on the dollar index (DXY) (inserted below), the dollar is poised to continue seeking higher prices. If this is to be true, EURUSD will sell into the daily order block from which I would be expecting to see a bullish rally in price.
Follow for more updates like this.
DXY ANALYSIS
Cheers,
Jabari

DOLLAR INDEX (DXY) ____ INCOMING BEARISH MOVEHello Traders,
The dollar has been bullish for weeks now, going after multiple buy-side liquidity. Currently, it is close to a monthly buy-side liquidity (previous high). If this level should hold, we should see price go after the weekly sell-side liquidity (previous weekly low) which you would see on the weekly chart.
If you look left, you will notice how price aligns well with the narrative.
This is just a speculation and no fact but I would be using this view to trade all the dollar pair.
I will make more analysis on the dollar pairs I would be looking to trade.
Follow for more updates like this.
Cheers,
Jabari

GBPCHF ____ BEARISH MOVE IN PLAYHello Traders,
This pair has been bearish for the longest. However, on the monthly chart, price seems to be consolidating. It is not in our place to figure out if the consolidation will lead to a rally or a dump but if you look inside the consolidation, you will notice that price swept the previous monthly high giving it the liquidity to go after the weekly lows.
Fast forward to recent times, you will notice that price has a weekly low to hunt and price is printing on the daily chart, a complex head and shoulders pattern.
Are we expecting lower prices? I think so, what about you?
Follow me for more updates.
Cheers,
Jabari

Price Action and Trade Review for the DOW Jones IndexPrice action is key for understanding the major market bias and also for managing risk.
On top of that, understanding Price Action will give a better understanding of where other traders may be trapped and will help structure your trades.
In the video, I talk through the DOW Index and price action from the previous session. I look at where we were looking for trades and the price action that led to trapped traders getting squeezed out of the action.
*** Feel free to take a look at our profile page and Please Follow for more content ***
*** Please Leave a Like and Comment if you enjoyed this video ***

EURNZD ____ INCOMING BEARISH AND BULLISH MOVEHello Traders,
Here is a pair that has the potential to provide a bearish move and a bullish long-term rally.
The bearish move will likely complete the retracement on the weekly chart and once the price has traded into the weekly order block, I speculate that the rally will aim to sweep the trendline liquidity that has built up.
Follow for more updates.
Cheers,
Jabari

GBPNZD ____ INCOMING BULLISH MOVEHello Traders,
This pair is likely to head into the weekly demand order block from which I speculate a bullish rally in price. There is also an unmitigated price level and daily supply order block for the price to reach.
Once the price trades into the weekly demand zone, I will go into the 1-hour timeframe to wait for a CHOCH from bearish to bullish to go long.
Follow me for more updates.
Cheers,
Jabari.

GBPAUD ____ INCOMING BULLISH MOVEHello Traders,
This pair is trading in a weekly demand order block from which price could rally. We also have an unmitigated price level which price could go mitigate.
Keep an eye on this pair. I will be monitoring this pair on the 1-hour timeframe to see if there would be a CHOCH from bearish to bullish to go long.
Follow for more updates.
Cheers,
Jabari

EURAUD ____ INCOMING BULLISH MOVEHello Traders,
EURAUD has traded into a weekly demand order block after sweeping sell-side liquidity (equal lows) however, due to the massive dump in price, the bullish rally will not happen immediately.
This dump created a FVG on the daily timeframe which price could trade into next week and continue to ease the bearish move before the bullish rally begins.
Follow for more updates like this.
Cheers,
Jabari

AUDCHF ____ INCOMING BEARISH MOVEHello Traders,
AUDCHF has traded into a weekly supply zone and has just hunted buy-side liquidity. In the weekly order block, there is an unmitigated daily order block that I expect the price to mitigate and react from.
I will be monitoring price movement as it trades in the weekly order block to see if there would be a CHOCH on the 1-hour timeframe.
Follow for more updates.
Cheers,
Jabari

CADJPY ____ INCOMING BEARISH MOVEHello Traders,
This pair has reacted from a monthly demand level and is trying to create a higher high there by hunting liquidity.
As you would notice, price is a few pips away from the weekly buyside liquidity which if it is hunted, a reaction is expected. Looking left, you will notice how price dropped strongly from that level.
My speculation is that price would take liquidity from there and use is as a form of retracement to the weekly order block.
Follow for more updates like this.
Cheers,
Jabari

IS ETH low at 1530 going to hold?(1)ETH last low from the distribution seller bar at 1540 has been taken out. We see some settling at 1530 level with a low test buyer bar coming up. Once this low has confirmed, we will look at the 4H timeframe to get an early top towards confirming on daily and weekly.
For the weekly to continue going down, there is a less than 30% probability. So,highly probably, it may confirm its weekly bottom before carrying further south. Let's see if how the trade plans out according to our smart money framework and the VSA methodology.
We will be tracking this potential trade and updating the post as we go along on the charts and on video. Keep a look out for it traders.
To understand our ideas and videos better,we highly recommend watching our following stream videos:
1.Trader Starter Pack 5 day video course
Look on our channel profile or at our signature section to access it
2.7 steps to achieve consistent trading performance
www.tradingview.com
3.7 steps for strategy construction
www.tradingview.com
Refn image from our ealier post:

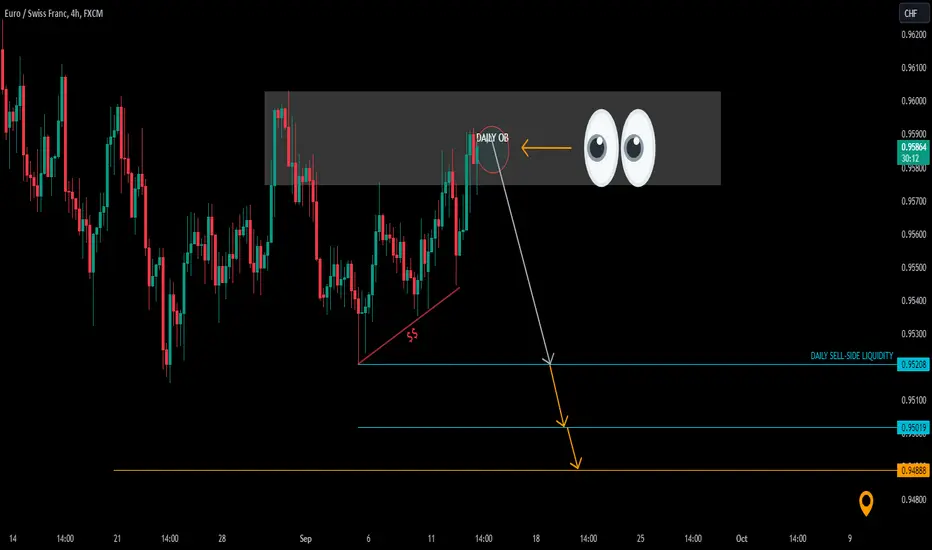
EURCHF ____ INCOMING BEARISH MOVEHello Traders,
This is an update on my EURCHF post (inserted below). The weekly bearish expansion is yet to happen, however, we can see that a trendline liquidity has been formed which would likely be hunted.
Follow for more updates.
EURCHF PREVIOUS ANALYSIS
Is BTCUSD third attempt at 24919 going to hold?(1)This is the third swing low of Bitcoin on the daily timeframe. We will track and see if this holds to become a weekly bottom. The difference with this bottom confirmation is that there has been a trend change from a downtrend to an uptrend as shown in the chart image. However,the volume spike is not huge. Another thing that we have observed is that the price level of 24756 on the weekly timeframe has held and has not been broken yet to give a trend change. Hence weekly is still in uptrend as in image below. We have now entered this trade on 4h confirmation bar on a reduced risk in review of the reasons above.
Trade order details
BTCUSD(Long)
E - 26086
SL - 24919
T - TBC
We will be tracking this move and updating the post as we go along on the charts and on video. Keep a look out for it traders.
To understand our ideas and videos better,we highly recommend watching our following stream videos:
1.Trader Starter Pack 5 day video course
Look on our channel profile or at our signature section to access it
2.7 steps to achieve consistent trading performance
www.tradingview.com
3.7 steps for strategy construction
www.tradingview.com
Refn Image of Weekly timeframe

Is USDJPY going to reach its 50% OE target this time?(1)We have entered USDJPY on the daily confirmation bar on a long trade. This is based on a daily P1 trend continuation move, and along with a weekly continuation trade move according to our smart money framework indicator. You can see on the image below on which part of the cycle we are in on the weekly timeframe and how that matches up with the daily timeframe. According to our OE tables, we can see that there is a more than 40% chance since it is a phase 1 move that the weekly potential high will be taken and for the long move to continue further north.
USDJPY(Short)
E - 147.45
ISL - 146.10
T - TBC
We will be tracking this move and updating the post as we go along on the charts and on video. Keep a look out for it traders.
To understand our ideas and videos better,we highly recommend watching our following stream videos:
1.Trader Starter Pack 5 day video course
Look on our channel profile or at our signature section to access it
2.7 steps to achieve consistent trading performance
www.tradingview.com
3.7 steps for strategy construction
www.tradingview.com

Is gold going to continue further south?We have entered Gold on the daily confirmation bar on a short trade. This is based on a daily P1 trend continuation move, and along with a weekly continuation trade move according to our smart money framework indicator. You can see on the image below on which part of the cycle we are in on the weekly timeframe and how that matches up with the daily. According to our OE tables, we can see that there is a 70% chance that the weekly potential low will be taken and for the short move to continue further.
Gold(Short)
E - 1925.6
ISL - 1953
T - TBC
Trailing stop at 1932
We will be tracking this move and updating the post as we go along on the charts and on video. Keep a look out for it traders.
To understand our ideas and videos better,we highly recommend watching our following stream videos:
1.Trader Starter Pack 5 day video course
Look on our channel profile or at our signature section to access it
2.7 steps to achieve consistent trading performance
www.tradingview.com
3.7 steps for strategy construction
www.tradingview.com

Is US30 low at 34024 going to hold and confirm weekly bottom?(3)We have entered this trade on 4h confirmation bar and it went onto confirm the bottom on the daily timframe. However, the weekly bottom is yet to confirm. For it to go further higher and have a higher probability to confirm the weekly bottom, it has got to make a second higher bottom and take out the last swing high as shown in the image. Let's see how the trade plans out according to our smart money framework indicator.
US30(Long)
E - 34607
SL - 34023
T - To be confirmed(TBC)
We will be tracking this move and updating the post as we go along on the charts and on video. Keep a look out for it traders.
Previous chart reference image:
To understand our ideas and videos better,we highly recommend watching our following stream videos:
1.Trader Starter Pack 5 day video course
Look on our channel profile or at our signature section to access it
2.7 steps to achieve consistent trading performance
www.tradingview.com
3.7 steps for strategy construction
www.tradingview.com

Mastering Risk: A Guide to Setting Stop Loss in Forex Trading 🛡
In the world of forex trading, where price fluctuations can be swift and unpredictable, mastering risk is paramount. One of the most crucial risk management tools at your disposal is the stop loss order. In this comprehensive guide, we will explore the ins and outs of setting stop losses in forex trading. We'll provide real-world examples and equip you with the knowledge needed to protect your capital and trade with confidence.
The Importance of Setting Stop Loss Orders
A stop loss order is a predetermined price level at which a trade is automatically closed to limit potential losses. Here's why setting stop losses is vital in forex trading:
1. Risk Management: Forex trading carries inherent risks. Stop losses allow you to define your maximum acceptable loss and protect your capital.
2. Emotion Control : Trading can evoke strong emotions. Stop loss orders remove the need for impulsive decisions during adverse price movements, promoting discipline and reducing emotional stress.
3. Preserving Capital: Successful trading is about longevity. By limiting losses, stop loss orders help you maintain your capital, ensuring you have the resources to seize future opportunities.
Setting Stop Loss: Strategies and Examples
Example 1: EUR/USD Long Position:
Example 2: GBP/JPY Short Position:
Setting stop loss orders is a fundamental aspect of responsible and successful forex trading. By mastering the art of setting stop losses, you can effectively manage risk, maintain discipline, and ensure that your trading journey is characterized by longevity and success. Remember, it's not about avoiding losses entirely, but about controlling them to protect your capital and thrive in the forex market. 🛡📉📊
Let me know, traders, what do you want to learn in the next educational post?
