Tradingstrategies
How to Trade the Markets - Step 2 - Develop the Mega TrendHello,
In this video series i will be walking you through my new approach on how i am currently trading the markets.
Step 2 - Develop the Mega Trend
Once you have entered your position and set your stop loss, you will then want to align the Trend Meters with your current lifeline candle. Ultimately we want to see the next day candle break below the previous day of support and start to create space from our position. We align the 7,14 and 21 Trend Meters to confirm the development for a Mega Trend winning position. Let it run and work for you!
We will exit and rotate the position once we have a confirmation from the Trend Meters.
Follow up videos will come in the future to show you how this has performed for the year.
Simplicity is key. Tight stops are key. Mega Trend is WINNING.
Take care.

How to Trade the Markets - Step 1 - Creating a LifelineHello,
In this video series i will be walking you through my new approach on how i am currently trading the markets.
Step 1 - Creating a Lifeline
We need to create a lifeline that factors no more than 2% on a stop loss playing the current daily candle. I will show you how to enter and factor in a stop loss for security in your capital.

Trading IMX in a Ranging MarketLet’s see how you can trade IMX in a ranging market successfully!
What is ImmutableX IMX? ImmutableX IMX is the native cryptocurrency of the ImmutableX platform. ImmutableX is a layer-2 scaling solution for Ethereum, designed to offer fast and secure trading of non-fungible tokens (NFTs). ImmutableX uses the Ethereum network for security and settlement but offloads the heavy lifting of transaction processing and validation to its own layer-2 solution. ImmutableX aims to be the fastest and most secure way to trade NFTs on the Ethereum network.
IMX's performance in 2022: IMX has had a good year so far, increasing about 200% since the start of the year. However, it is currently caught between two levels, which makes it an excellent candidate for range trading.
Trading with the Relative Strength Index (RSI) indicator
The Relative Strength Index (RSI) indicator is a momentum oscillator that measures the speed and change of price movements. It is used to determine when an asset is overbought or oversold. The RSI is usually an excellent choice to use on coins that are ranging.
In this chart above, we traded with the RSI on the 1-Hour chart with the basic settings of Period 14, buy when the RSI is below 30 and sell when the RSI is above 70. This setup brought a profit of 89% since February 1st. This indicates that range trading with the RSI indicator can be a profitable strategy for IMX.
Disclaimer: Please take into account that the RSI works well when the market is ranging. When the market is in a downtrend, it will start working significantly worse.
Bottom Line: IMX showed significant growth in 2022, and is now ranging. The RSI indicator is a useful tool for trading IMX in its current-ranging market.

Game Plan Gold ShortHi all
Gold did see some movement since the beginning of 2023, yet in the past days, Gold has been selling off very strongly. Price has retreated into that crucial range of 1825- 1800. This support area needs to hold, if we break 1800, we could see the shiny metal slide all the way down to 1720 or even further.
Prices in precious metals have been seeing an uptick in volatility since Powells Testimony on Tuesday. Let's see if this downward pressure continues.
Here is my Game Plan for a short scenario:
- Price needs to consolidate further in the box (range 1820- 1800)
- Steep upwards movements are fine, should not move higher than 1830
- Consolidation on 1800 is of interest to find an entry
- Optimally, some flat price movement on 1800 or slightly under it for a relevant amount of time
- Clear break of 1800 is needed, seeking entry around 1795 depending on how clean we cut through 1800
1800 is the area of interest in this Game Plan, before we not see some further movement into the 1800 region, I will be staying out of this one as we are sitting on a very strong support for the metal.
This will be my plan.
If you want to learn more about my market approach, make sure to follow me on Tradingview!
Cheers.

Xau/UsdHello traders! In my opinion, in short term this pair is mix.
Be careful and wait for a confirmation!
Don`t forget to look at the economic calendar!
MAKE MONEY AND ENJOY LIFE 💰
THANK YOU!
GOOD LUCK!
🙏🏻🙏🏻🙏🏻

Xau/UsdHello traders! In my opinion, in medium term this pair is buy.
Target:
Buy 1865.00 ; 1900.00
Be careful and wait for a confirmation!
Don`t forget to look at the economic calendar!
MAKE MONEY AND ENJOY LIFE 💰
THANK YOU!
GOOD LUCK!
🙏🏻🙏🏻🙏🏻

Eur/UsdHello traders! In my opinion, in medium term this pair is buy.
Target:
Buy 1.0722 ; 1.0784
Be careful and wait for a confirmation!
Don`t forget to look at the economic calendar!
MAKE MONEY AND ENJOY LIFE 💰
THANK YOU!
GOOD LUCK!
🙏🏻🙏🏻🙏🏻

US500 - key levels, trend lineThe price reached the ascending trend line and the fibo level of 0.5-0.618, from here I expect a short-term rise.
D1:
Good trading!
If you find it useful, like, follow, share!

EURCADlooks like corrective, this is from my view, price might be drop 300 pips to finish the 4 wave impulse, EURCAD!

XAUUSD YSSINEIØSS M15👣👣👀👀Please respect the analysis. Today is a beautiful day, a golden opportunity. Just a little patience and diligence, we will be the best Happy holiday Any questions about the transaction are 🤗

Xau/UsdHello traders! In my opinion, this pair is sell.
Targets:
Buy 1850.00 or 1855.00
Sell 1834.00
Be careful and wait for a confirmation!
Don`t forget to look at the economic calendar!
MAKE MONEY AND ENJOY LIFE 💰
THANK YOU!
GOOD LUCK!
🙏🏻🙏🏻🙏🏻

CABLE BULLISH 3 DRIVEAfter some careful consideration of the price action I realized that CABLE was making a very RARE, DOUBLE HARMONIC pattern called the 3 drives.
In this case it appears as though CABLE is creating a BULLISH THREE DRIVES DOWN harmonic pattern. Which would frame our sells at this point and give us a nice potential EXIT to any CABLE sells at point #3.
From point #3 it is a very high likelihood that CABLE will experience some form of bullish impulse wave. The current trading plan is to ride the THIRD DRIVE TO THE BOTTOM, which is wave 3 of the second harmonic pattern that is contained WITHIN a 3 Drive pattern.
After completion of wave 3, the size of the resulting impulse wave should give clues to the next step in CABLE

Xau/UsdHello traders! In my opinion, in short term this pair is mix.
Be careful and wait for a confirmation!
Don`t forget to look at the economic calendar!
MAKE MONEY AND ENJOY LIFE 💰
THANK YOU!
GOOD LUCK!
🙏🏻🙏🏻🙏🏻

NZDUSD descending trend lineThe price has returned to the previous support and descending trend line, from here I expect further fall.
H4:
Good trading!
If you find it useful, like, follow, share!

This Pivot Point Supertrend Strategy has up to 90% Success!Traders,
I'll review the Pivot Point Supertrend Trading Strategy in this video. This strategy has up to a 90% success rate with an avg. of 80-100% profits weekly. I think it's well worth our time to review and potentially implement or even automate going forward. Enjoy.
Stew

CADCHF High probability of a buy positionI have carried out proper research, the pair hasn't started to but yet but there are high chances it will soon. Don't miss out as a inform on the entry. Lets be patient enough.

How to Trade With Relative Strength Index (RSI) Indicator
Hey traders,
Relative strength index is a classic technical indicator.
It is frequently applied to spot a market reversal.
RSI divergence is considered to be a quite reliable signal of a coming trend violation and change.
Though newbie traders think that the application of the divergence is quite complicated, in practice, you can easily identify it with the following tips:
💠First of all, let's start with the settings.
For the input, we will take 7/close.
For the levels, we will take 80/20.
Then about the preconditions:
1️⃣ Firstly, the market must trade in a trend ( bullish or bearish )
with a sequence of lower lows / lower highs ( bearish trend ) or higher highs / higher lows ( bullish trend ).
2️⃣ Secondly, RSI must reach the overbought/oversold condition (80/20 levels) with one of the higher highs/higher lows.
3️⃣ Thirdly, with a consequent market higher high / lower low, RSI must show the lower high / higher low instead.
➡️ Once all these conditions are met, you spotted RSI Divergence.
A strong counter-trend movement will be expected.
Also, I should say something about a time frame selection.
Personally, I prefer to apply it on a daily time frame, however, I know that scalpers apply divergence on intraday time frames as well.
❗️Remember, that it is preferable to trade the divergence in a combination with some price action pattern or some other reversal signal.
Let me know, traders, what do you want to learn in the next educational post?

AUDNZDHello Traders, here is the full analysis on AUDNZD, let me know in the comment section below if you have any questions, the entry will be taken only if all rules of the strategies will be satisfied. Kindly tap on like and follow button l.. Please also refer to the Important Risk Management

BTC - Shorting Target 22000BYBIT:BTCUSDT.P
4h time frame
-
We already opened short at the rejection of 23800.
Now, there is an opportunity to add more positions if Bitcoin closed BELOW 23340.
-
Target: 22750, 22000
SL: 24000

Bitcoin is now expected to reach levels 23.8K - K22.4 - K21.5The first target was reached by Bitcoin yesterday, by a slight difference, and the price bounced from it, and it is expected to return to touching this level, and it is considered a minor and weak support, and it can be broken easily
Today, it is expected to break 22.8K, and head towards the second support levels at 22.4K, and it is likely to be broken if the rise continues on Dominance Tether..

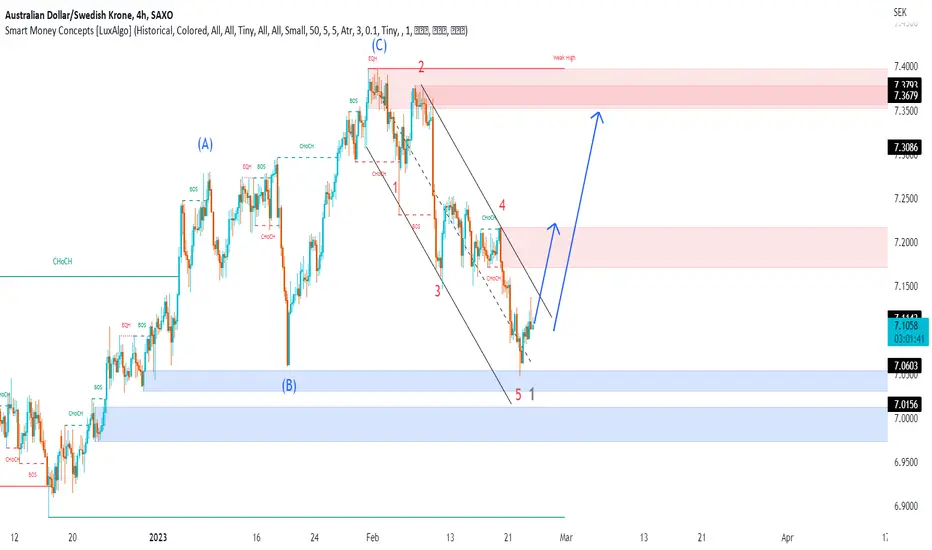
AUDSEK Next Possible MovePair : AUDSEK ( Australian Dollar / Swedish Krone )
Description :
Divergence
Impulse Correction Impulse
Elliot Waves - Completed " ABC " Corrective and Impulsive Waves " 1 ( wxyxz )
Flag Pattern
Break of Structure
Why is trading NOT working for me?!Even with the right markets, time frames, systems, rules and ideas…
Trading is just not playing out you the way you thought it would.
It’s not growing your portfolio at the rate you wished…
It’s taking forever to get right…
It’s overwhelming and you don’t know which strategy to choose…
From my experience this is because of one reason.
You’re not treating trading for what it is…
Let’s REMIND you…
TRADING IS… A fun hobby
Trading isn’t a tiring job where you need to sit for hours countlessly looking at a screen.
It’s also not a job where you need to be cramped up in a cold room, sitting on an uncomfortable chair, wearing a suffocating ‘noose’ I mean tie, around your neck while you’re waiting for the next pay-cheque.
If that was the case, I would have stopped trading 19 years ago.
Trading should be treated as a fun hobby.
With this hobby…
You don’t need a lot of time (half an hour a week will do just fine).
You don’t need a lot of effort. (Just a few click of the buttons and a few simple grade-8 maths calculations).
You don’t need to worry and stress yourself out. (Opportunities come every day, you can manage your own risk and no one is watching over your shoulder.)
In other words this is one opportunity which will give you:
More free time, Less work and a hobby that will consistently pay you.
TRADING IS… A patience game
When you’re enjoying a hobby, you look forward to doing it the next day.
It’s like anything you enjoy…
Watching TV, playing sports, eating your favourite snacks or even having sex…
You’ll adapt, incorporate and most importantly look forward to the next time you do it.
And the more you do it, the more you’ll improve, the better you’ll get and the easier it will become.
Trading is a patience game.
The longer you spend the time and days working on it and improving, the faster, better, and more powerful of a trader you will become.
And this will lead to one outcome – Financial Independence.
TRADING IS… Ever evolving
This isn’t your run on the mill, rat-race kind of hobby.
This is one heck of an interesting, exciting and thrilling activity that changes so quickly.
Every day, week, month and year you’ll to learn a ton of trading tips and lessons.
That’s because the markets are always, changing, evolving, adapting and are even suprising…
They evolve with:
Ever-changing market conditions.
New financial markets added to the exchanges.
New created instruments to incorporate i.e. Crypto- currencies, ETFs, CFDs etc…
New mega-trends driving new global demand i.e. AI, Machine learning, Electric cars, Cannabis, NFTs, Smart contracts and Extended Mixed Reality.
TRADING IS… A lonely journey
This is one hobby, where YOUR success entirely depends on YOU.
This won’t work if you’re asking your family, friends, dogs and even strangers for their opinions on what to buy and sell.
This won’t work if you’re listening to the random billionaire analyst on Bloomberg talking about what they have in their portfolios.
This won’t work if you’re scrolling on Facebook for an individual’s trading prediction. (INCLUDING MINE).
No! With your system, your money and your time – You need to trade alone and on your own terms…
You know what will make you money?
Taking more trades according to YOUR criteria.
Listening to YOUR rules according to YOUR strategy.
Spending more of YOUR time, improving on executing trades well.
Notice the word YOUR… Not others, not him, not her – YOU…
So take trading for what it is and enjoy the process.
TRADING IS… A fun hobby
TRADING IS… A patience game
TRADING IS… Ever evolving
TRADING IS… A lonely journey
