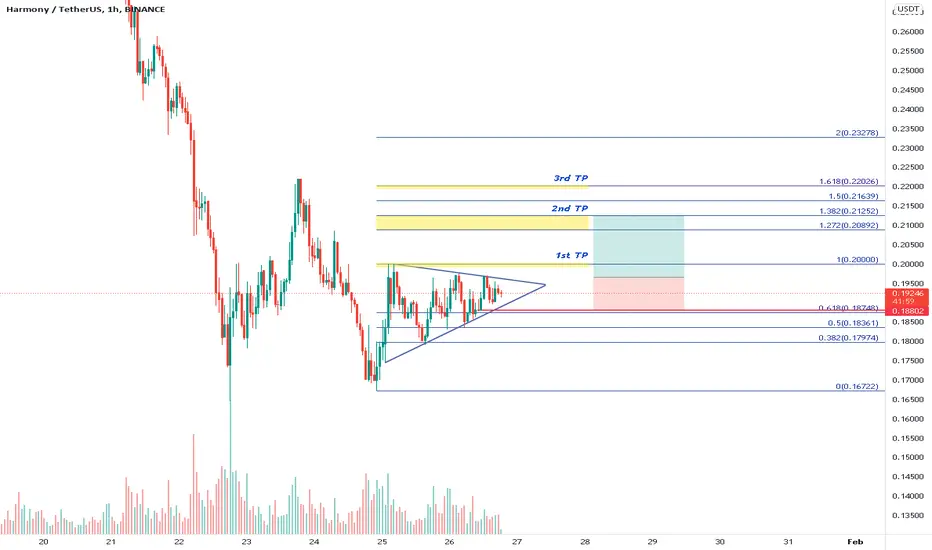
ONE - TP/SL for this triangleBINANCE:ONEUSDT
1H trend chart
-
ONE is converging in a triangle, and there is a possible bottom in it.
If price can break out the downtrend line, trading strategy as below.
-
Profit Targets:
a) 0.2----Fib(1)
b) 0.20892~0.21252----Fib(1.272~1.382)
c) 0.22026----Fib(1.618)
Stop losses:
a) 0.18802-----Red horizontal ray
-
If you like this analysis, smash the "like button" and leave a comment below to share your thoughts
or let me know what crypto you want to see!
Trading is a reflection of yourself. Learn more daily and be ready for every opportunity.
Have a nice trading!
Tradingstrategies
ETH - Possible inverse head and shouldersBYBIT:ETHUSDT
1H trend chart
-
ETH is forming a HS pattern on 1H trend.
We can buy it here gradually and open more after breaking out 2548
-
Profit Targets:
a) 2654.9~2698.15----Fib(1.272~1.382)
b) 2744.5----Fib(1.618)
Stop losses:
a) 2348.85-----Red horizontal ray
-
If you like this analysis, smash the "like button" and leave a comment below to share your thoughts
or let me know what crypto you want to see!
Trading is a reflection of yourself. Learn more daily and be ready for every opportunity.
Have a nice trading!

BTCUSDT Elliott wave count update#BTC update on my Elliott wave count;
As I shared with you before, we are in wave C, IMO, and we are very close to the end of this wave. I expect to see $28k to $30k. If this level cannot hold, then even $20k is possible and still, the EW rules don't invalidate.
I have no idea about the time period.

BNB - the end of falling? and another short timing1H trend chart / D trend chart
-
From the right side chart, we can notice that BNB falls seriously while breaking out the uptrend line.
And it is gonna find support with previous accumulation zone, which will be a nice long timing for left side trading.
From the left side chart(1H), BNB might rally back to 410~420 to hit 144/169ema and the broken uptrend line.
It will be a good short level if price meets 144/169ema then gets pullback to 12ema, which meets 1H Vegas shorting entry.
-
Profit Targets:
a) 316.5----Blue horizontal ray
b) 254.6--------Blue horizontal ray
-
If you like this analysis, smash the "like button" and leave a comment below to share your thoughts
or let me know what crypto you want to see!
Trading is a reflection of yourself. Learn more daily and be ready for every opportunity.
Have a nice trading!

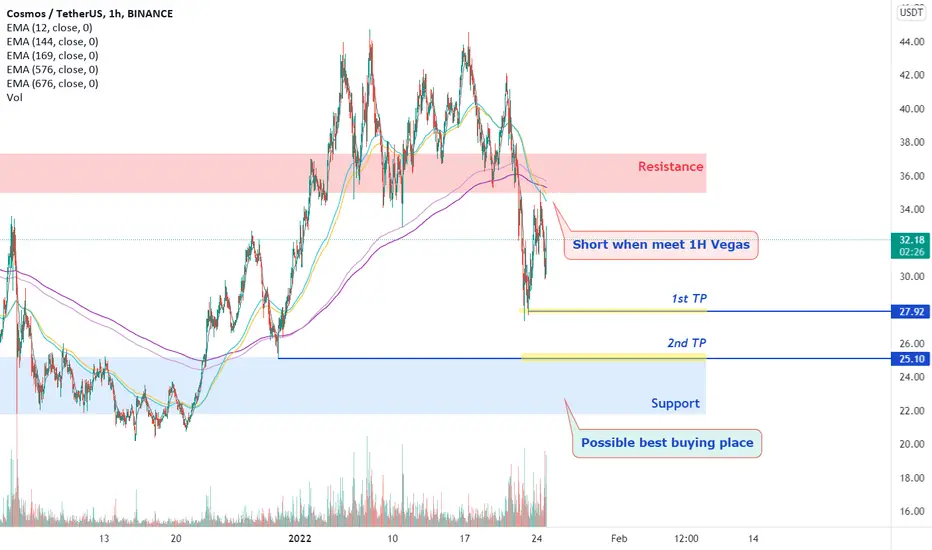
ATOM - Nice levels for Short and LongBINANCE:ATOMUSDT
1H trend chart
-
ATOM is resisting to fall continuously, but the H1 Vegas tunnel is forming bearish structure.
If price goes back to 144/169ema, but breaks down through 12ema quickly, it's a good level to short.
-
Profit Targets:
a) 27.92----Blue horizontal ray
b) 25.1--------Blue horizontal ray
-
Also, we can see an accumulation zone around 22~24.
So it'll be a good bottom for buying with left side trading.
-
If you like this analysis, smash the "like button" and leave a comment below to share your thoughts
or let me know what crypto you want to see!
Trading is a reflection of yourself. Learn more daily and be ready for every opportunity.
Have a nice trading!
BTC - little pullback, but still not the bottomD trend chart
-
Pattern
BTC shows a serious dip after penetrating the long-term downtrend line, and also forms a big head and shoulders.
The first targets of HS will be 31000~28000.
Possible bottom
Although it seems trying to stop falling, but the reasonable bottom is 28000, it's not only the satisfied level of Fib, but also the previous lows.
Volume
Moreover, notice that every relative bottom areas accumulated big volume.
So we can observe bigger volume shows or not in near future.
-
If you like this analysis, smash the "like button" and leave a comment below to share your thoughts
or let me know what crypto you want to see!
Trading is a reflection of yourself. Learn more daily and be ready for every opportunity.
Have a nice trading!

NEAR - Buy it with these TP/SLBYBIT:NEARUSDT
4H trend chart
-
NEAR has broken the short-term downtrend line.
And it also met 4H Vegas entry.
So we can open position here with good R/R ratio.
-
Profit Targets:
a) 18.714----Blue horizontal ray
b) 20.597--------Fib(1)
c) 22.635~23.460--------Fib(1.272~1.382)
Stop losses:
a) 16.122-----Red horizontal ray
-
If you like this analysis, smash the "like button" and leave a comment below to share your thoughts
or let me know what crypto you want to see!
Trading is a reflection of yourself. Learn more daily and be ready for every opportunity.
Have a nice trading!

Eurusd retest leveleurusd
the euro and the dollar pair have again given positive signal towords the top which could be the target 1.1365
buy above at 1.1337
pattren;revesal head and shoulder

MATIC - has broke the line and TP/SLBYBIT:MATICUSDT
4H trend chart
-
MATIC has already broken out the downtrend line
It also keeps being support from an uptrend line
So we can take entry on this blue area, and trading strategy as below.
-
Profit Targets:
a) 2.6526----Blue horizontal ray
b) 2.9240--------Fib(1)
c) 3.4437~3.6538--------Fib(1.272~1.382)
Stop losses:
a) 1.8983-----Red horizontal ray
-
If you like this analysis, smash the "like button" and leave a comment below to share your thoughts
or let me know what crypto you want to see!
Trading is a reflection of yourself. Learn more daily and be ready for every opportunity.
Have a nice trading!

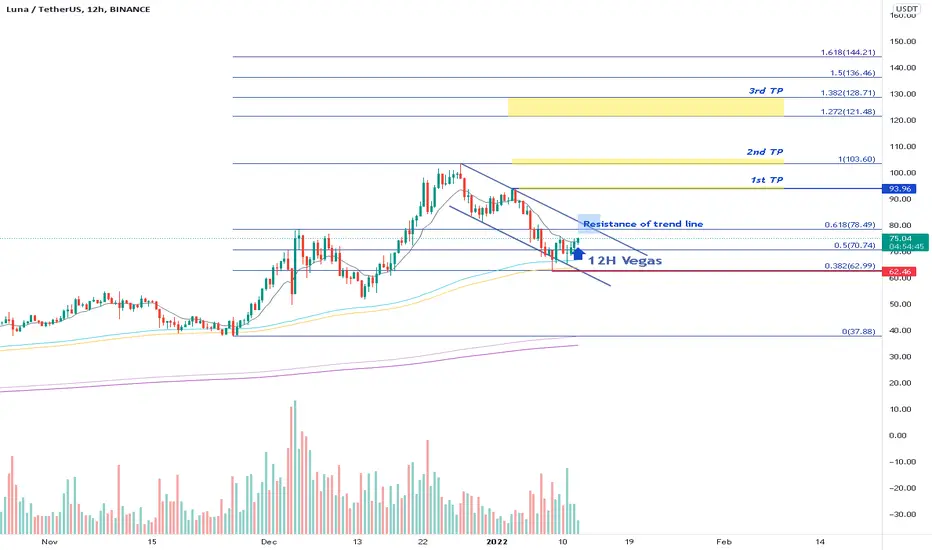
LUNA - Open position if meet this priceBINANCE:LUNAUSDT
12H trend chart
-
LUNA is going to meet Vegas entry on 12H trend,
If price can keep being above the 12ema(black line), trading strategy as below.
-
Profit Targets:
a) 93.96----Blue horizontal ray
b) 103.6--------Fib(1)
c) 121.48~128.71--------Fib(1.272~1.382)
Stop losses:
a) 62.46-----Red horizontal ray
-
If you like this analysis, smash the "like button" and leave a comment below to share your thoughts
or let me know what crypto you want to see!
Trading is a reflection of yourself. Learn more daily and be ready for every opportunity.
Have a nice trading!
BTC - Buy it after going back to this areaCOINBASE:BTCUSD
3D trend chart
-
BTC is correcting around 2 months
Now, it has touched Vegas tunnel 144ema on D3 chart, and also got support from the long-term uptrend line.
For bull, we can wait it to go back 12ema then open position.
You can also see that a good surge happened with last 3D Vegas entry, so here is a potential great buying area.
-
If you like this analysis, smash the "like button" and leave a comment below to share your thoughts
or let me know what crypto you want to see!
Trading is a reflection of yourself. Learn more daily and be ready for every opportunity.
Have a nice trading!

ATOM - Try this entry opportunityBINANCE:ATOMUSDT
1H trend chart
-
ATOM is meeting the Vegas tunnel strategy on 1H chart
We can open it with following strategy.
-
Profit Targets:
a) 39.73----Blue horizontal ray
b) 43.93--------Fib(1)
Stop losses:
a) 34.59-----Red horizontal ray
-
If you like this analysis, smash the "like button" and leave a comment below to share your thoughts
or let me know what crypto you want to see!
Trading is a reflection of yourself. Learn more daily and be ready for every opportunity.
Have a nice trading!

ENJ - Open position in this scenarioBYBIT:ENJUSDT
4H trend chart
-
ENJ is converging and approaching to the end of triangle.
It encountered resistance from the downtrend line many times.
If price can breakout this trend line, trading strategy as below.
-
Profit Targets:
a) 2.9475----Fib(1)
b) 3.0645~3.1120--------Fib(1.272~1.382)
c) 3.2140----Fib(1.618)
Stop losses:
a) 2.6615-----Red horizontal ray
-
If you like this analysis, smash the "like button" and leave a comment below to share your thoughts
or let me know what crypto you want to see!
Trading is a reflection of yourself. Learn more daily and be ready for every opportunity.
Have a nice trading!

usdchf sell trade setupnice risk to reward trade
entry 0.91598
stop loss 0.91710
take profit 0.91610
risk 1% of your account
wins can exceed losses please use proper risk management and trade management

CHR - Nice entry timingBYBIT:CHRUSDT
1H trend chart
-
CHR already met Vegas tunnel for entry.
Additionally, it got support at Fib 0.382 and uptrend line.
Therefore, we can buy it with trading strategy as below.
-
Profit Targets:
a) 0.9708----Fib(1)
b)1.0395~1.0673--------Fib(1.272~1.382)
c) 1.0971----Fib(1.5)
Stop losses:
a) 0.8127-----Red horizontal ray
-
If you like this analysis, smash the "like button" and leave a comment below to share your thoughts
or let me know what crypto you want to see!
Trading is a reflection of yourself. Learn more daily and be ready for every opportunity.
Have a nice trading!

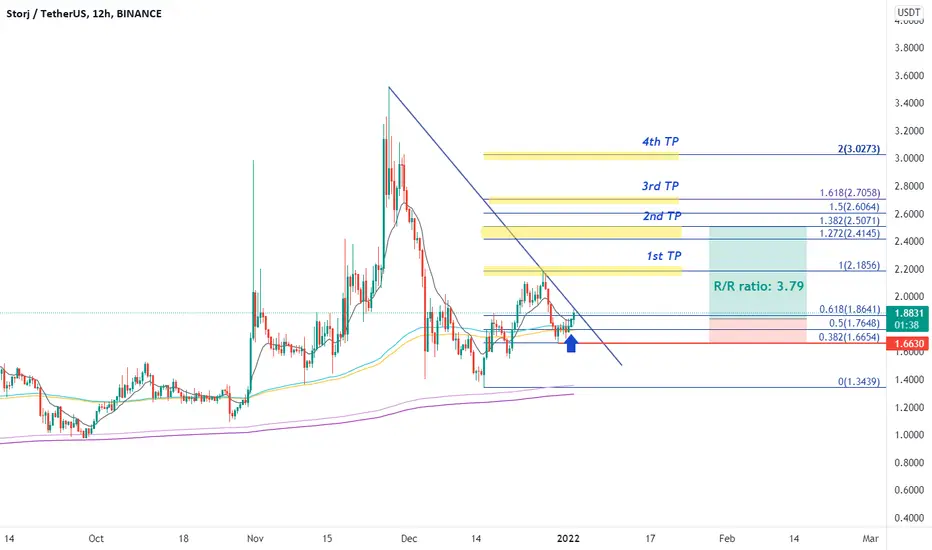
STORJ - Good timing to long with these TP/SLBINANCE:STORJUSDT
12H trend chart
-
STORJ jsut met the condition of Vegas on 12H chart (Blue arrow)
And there is a downtrend line keeps resisting price.
So we can take entry here and add position after breaking out the trend line.
Both have good reward/risk ratio and trading strategy as below.
-
Profit Targets:
a) 2.1856----Fib(1)
b) 2.4145~2.5071--------Fib(1.272~1.382)
c) 2.7058----Fib(1.618)
d) 3.0273----Fib(2)
Stop losses:
a) 1.6630-----Red horizontal ray
-
If you like this analysis, smash the "like button" and leave a comment below to share your thoughts
or let me know what crypto you want to see!
Trading is a reflection of yourself. Learn more daily and be ready for every opportunity.
Have a nice trading!
MITX-USDT Trade SetupA good R:R trade here with a tight SL.
I like to take the trades which are at a good support with tight SL.

CHR - Buying timing and good R/R ratioBINANCE:CHRUSDT
4H trend chart
-
CHR has gotten rid of the downtrend line.
Also, it has met the entry condition of Vegas tunnel strategy(blue arrow)
We can buy it with great reward/risk ratio and trading strategy as below.
-
Profit Targets:
a) 0.8929----Fib(1)
b) 0.9923~1.0324--------Fib(1.272~1.382)
c) 1.0756----Fib(1.5)
d) 1.2582----Fib(2)
Stop losses:
a) 0.6868-----Red horizontal ray
-
If you like this analysis, smash the "like button" and leave a comment below to share your thoughts
or let me know what crypto you want to see!
Trading is a reflection of yourself. Learn more daily and be ready for every opportunity.
Have a nice trading!

VET - can buy it with these TPBYBIT:VETUSDT
1H trend chart
-
VET has broken out the triangle and it is testing Fib1
If price can take out 0.0961, trading strategy as below.
-
Profit Targets:
a) 0.0996~0.1010----Fib(1.272~1.382)
b) 0.1040----Fib(1.618)
c) 0.1089----Fib(2)
Stop losses:
a) 0.09275-----Red horizontal ray
-
If you like this analysis, smash the "like button" and leave a comment below to share your thoughts
or let me know what crypto you want to see!
Trading is a reflection of yourself. Learn more daily and be ready for every opportunity.
Have a nice trading!

✅BAT - 🚀Surge as told you and higher TP for Christmas gift🎁-
BAT just be crazy after breaking out the resistance as post below.
-
If you are holding some since our buying timing, can expect TP4(1.5045)
SL could be 1.3160
Just take it anytime you satisfy and Merry Christmas!.
-
If you like this analysis, smash the like button and leave a comment below to share your thoughts
or let me know what crypto you want to see!
Trading is a reflection of yourself. Learn more daily and be ready for every opportunity.
Have a nice trading!

GALA and MANA - Buy both with these TP/SL on Christmas!🎄🎁🚀GALA met 1H Vegas tunnel strategy.
MANA met 4H Vegas tunnel strategy. (at blue arrow)
Time to buy them with TP/SL as charts.
Also, 🎄Merry Christmas and hope you have a great profit here!🚀
-
If you like this analysis, smash the "like button" and leave a comment below to share your thoughts
or let me know what crypto you want to see!
Trading is a reflection of yourself. Learn more daily and be ready for every opportunity.
Have a nice trading!

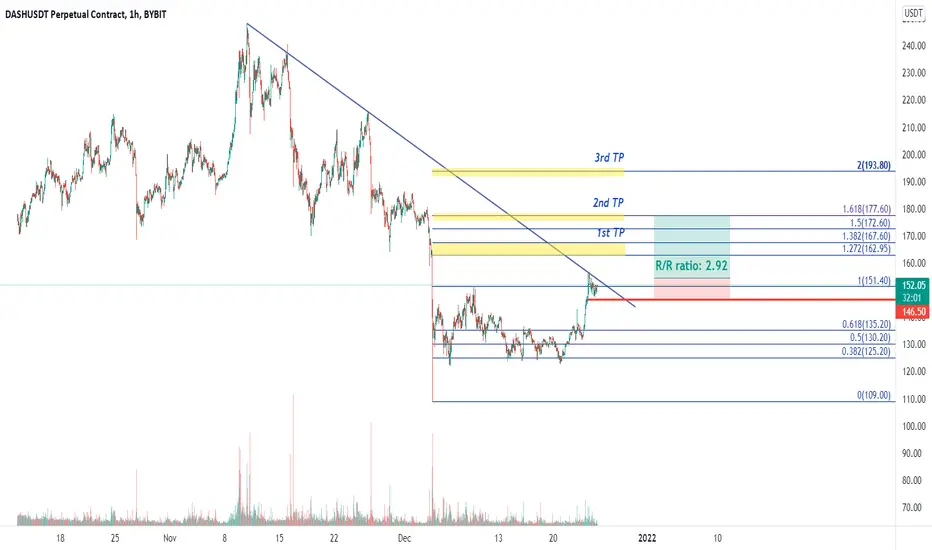
DASH - TP/SL for getting rid of this trend lineBYBIT:DASHUSDT
1H trend chart
-
DASH is squeezing under the downtrend line.
If price can break out the trend line, we can have a trading strategy with 2.92 R/R ratio.
-
Profit Targets:
a) 162.95~167.6----Fib(1.272~1.382)
b) 177.6----Fib(1.618)
c) 193.8----Fib(2)
Stop losses:
a) 146.5-----Red horizontal ray
-
If you like this analysis, smash the "like button" and leave a comment below to share your thoughts
or let me know what crypto you want to see!
Trading is a reflection of yourself. Learn more daily and be ready for every opportunity.
Have a nice trading!
SOL - Buying opportunities with these TP/SLBYBIT:SOLUSDT
1H trend chart
-
SOL has built a double bottom, and retested the Fib 0.382 immediately.
Now it already took out Fib 1, and we can set a trading strategy as below.
-
Profit Targets:
a) 198.465~200.435----Fib(1.272~1.382)
b) 204.650----Fib(1.618)
c) 211.480----Fib(2)
Stop losses:
a) 187.855-----Red horizontal ray
-
If you like this analysis, smash the "like button" and leave a comment below to share your thoughts
or let me know what crypto you want to see!
Trading is a reflection of yourself. Learn more daily and be ready for every opportunity.
Have a nice trading!
