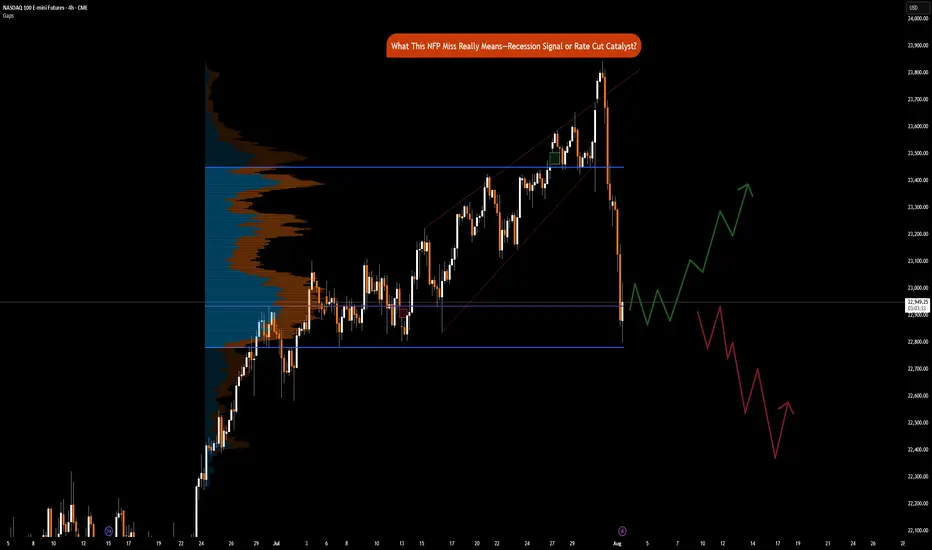
NFP Miss Implications: Recession Signal or Rate Cut CatalystCME_MINI:NQ1! CME_MINI:ES1! CME_MINI:MNQ1!
Happy Friday, folks!
Today is the first Friday of August, and that means the highly anticipated Non-Farm Payroll (NFP) numbers came in at 7.30 am CT.
US Non-Farm Payrolls (Jul) 73.0k vs. Exp. 110.0k (Prev. 147.0k, Rev. 14k); two-month net revisions: -258k (prev. +16k).
Other key labor market indicators were as follows:
• US Unemployment Rate (Jul) 4.2% vs. Exp. 4.2% (Prev. 4.1%)
• US Average Earnings MM (Jul) 0.3% vs. Exp. 0.3% (Prev. 0.2%)
• US Average Earnings YY (Jul) 3.9% vs. Exp. 3.8% (Prev. 3.7%, Rev. 3.8%)
• US Labor Force Particle (Jul) 62.2% (Prev. 62.3%)
Data and Key Events Recap:
What a year this week has been! It's been packed with high-impact economic data and pivotal central bank decisions, especially from the Federal Reserve. On top of that, trade and tariff announcements have dominated the headline.
U.S. economic data this week was broadly strong. Second-quarter GDP came in at 3.0%, beating expectations and signaling solid growth. The ADP employment report also surprised to the upside, printing 104K vs. the 77K forecast. Consumer confidence showed resilience as well, with the Conference Board’s reading rising to 97.2.
Inflation data was mixed but mostly in line. Core PCE for June rose 0.3% MoM, while the YoY reading ticked up to 2.8%, slightly above the expected 2.7%. The broader PCE Price Index also came in at 0.3% MoM, with a YoY print of 2.6%, slightly higher than forecast.
The Federal Open Market Committee (FOMC) voted to keep the federal funds rate target range unchanged at 4.25% – 4.50%. Notably, Governors Waller and Bowman dissented, favoring a 25-basis-point rate cut as expected, however, marking the first dual dissent by governors since 1993.
Changes to the FOMC Statement included a downgraded assessment of economic growth, reflecting slower real consumer spending. The Committee reiterated that uncertainty around the economic outlook remains elevated. It maintained its view of the labor market as "solid" and inflation as "somewhat elevated." Forward guidance remained unchanged, emphasizing the Fed’s readiness to adjust policy as necessary while continuing to monitor risks to both sides of its dual mandate.
Here’s a summary of key points from the FOMC press conference:
• On current policy stance:
“We decided to leave our policy rate where it’s been, which I would characterize as modestly restrictive. Inflation is running a bit above 2%... even excluding tariff effects. The labor market is solid, financial conditions are accommodative, and the economy is not performing as if restrictive policy is holding it back.”
Chair Powell commented on the need to see more data to help inform Fed’s assessment of the balance of risks and appropriate Fed Funds rate.
• On labor market risks:
“By many statistics, the labor market is still in balance... You do see a slowing in job creation, but also a slowing in the supply of workers. That’s why the unemployment rate has remained roughly stable.”
• On inflation and tariffs:
“It’s possible that tariff-related inflationary effects could be short-lived, but they may also prove persistent. We’re seeing substantial tariff revenue—around $30 billion a month—starting to show up in consumer prices. Companies intend to pass it on to consumers, but many may not be able to. We’ll need to watch and learn how this unfolds over time.”
Trade Headlines:
US President Trump announced tariffs on countries ranging from 10%-41%. Average US tariff rate now at 15.2% (prev. 13.3%; 2.3% pre-Trump), according to Bloomberg. US officials said that if the US has a surplus with a country, the tariff rate is 10% and small deficit nations have a 15% tariff, US officials said they are still working out technicalities of rules of origin terms for transshipment and will implement rules of origin details in the coming weeks. No details on Russian oil import penalty. Sectoral Tariffs White House said new reciprocal tariff rates take effect on Friday. Although Canada’s tariffs were increased to 35%, excluding USMCA goods, the effective rate is only 5%.
The economic data is showing strength, on the contrary, tariffs announcements for most countries have now been announced. Investors need to consider that tariffs are not just a tool to reduce trade deficit, it is also a geopolitical tool presently being used to shape alliances. The US wants to soften BRICS, China and Russian influence on the world stage.
Key to note is that these tariffs are substantially lower than what was announced on April 2nd, 2025.
The key question now remains, do participants buy the dip or ‘sell the fact’ is the current playbook?
Market Implications
Given the prior revisions in NFP data of -258K, July’s payroll came in at 73K, missing forecasts of 110K. What does this mean for markets? Markets are now pricing in 75% chance of a September rate cut. Prior revisions along with the current job market slowing down imply that risks to the downside are substantially increasing. Fed’s current policy is not just moderately restrictive but rather it may likely tip the US into a recession if Fed Funds rates remain elevated. The Chair asked to see more data, and here it is but I do wonder why they did not take this data into account for the July meeting. Surely, it would have been available to them.
Another question to ask would be, is it due to defiance of rate cut calls by the US administration? Is the Fed already behind the curve?
Fed’s dual mandate targets inflation and maximum employment. While inflation is sticky, the Fed may need to abandon their 2% mandate in favor of average inflation of 2.5% to 3%. A less restrictive policy will provide needed stimulus along with the fiscal stimulus provided via the BBB bill.
This drastically changes, in our analysis, how investors position themselves heading into the remainder of the year.
Markets (equities) may retrace slightly but the dip in our opinion will still be the play given weaker labor market data and increased rate cut bets. The bad news here means that the Fed has the data it wants to see to start cutting. Market pricing in 2 cuts seems to be the way forward for now.
Tradingtips
Tariffs, Trade Deals, & Central Bank Watch: Key Week in MarketsCME_MINI:NQ1! CME_MINI:ES1! CME_MINI:MNQ1! COMEX:GC1! CME_MINI:MES1! NYMEX:CL1!
This is a significant week in terms of macroeconomic headlines, key data releases, central bank decisions, and major trade policy developments. We get numbers for growth, inflation and decision and insights into monetary policy. Combining this with ongoing trade policy developments, we have a key week which may shape how the rest of the year unfolds.
Below is a consolidated summary of the latest trade negotiations, scheduled economic releases, and policy outlooks.
US - EU Trade Deal:
• US–EU Tariffs: The US will impose a 15% tariff on most EU goods, including cars, semiconductors, and pharmaceuticals, but retain a 50% tariff on steel and aluminium with a new quota system.
• Exemptions: Zero-for-zero tariffs agreed for agriculture, aircraft parts, and chemicals; aircraft exports are temporarily exempt.
• EU Commitments: The EU will invest $600 billion in the US and purchase $750 billion in US energy, mainly LNG.
• Agriculture: The EU will lower tariffs on many US agricultural goods, though not comprehensively.
• Political Reactions: EU leaders are mixed, Germany and the Netherlands praised the deal, France called it unbalanced, and Hungary viewed it unfavorably.
• The deal is not final until it is ratified by all EU national parliaments and the EU Parliament.
China Talks: US and China expected to extend their trade truce by 90 days. US-China meeting expected in Stockholm on Monday and Tuesday. Trump to freeze export controls to secure a deal. A group of US executives will visit China for trade discussions, organized by the US-China Business Council.
South Korea Trade Talks: Korea proposes a shipbuilding partnership with the US and is preparing a trade package.
UK–US Relations: PM Starmer and Trump to meet in Scotland to discuss the UK–US trade deal implementation, Middle East ceasefire, and pressure on Russia.
Thus far, the US has announced trade deals with the UK, Vietnam, Philippines, Indonesia, Japan and The EU. Trade delegations are working to finalize deals with China, Mexico, Canada
Key Economic Data Releases:
Monday: Treasury refunding financing estimates.
Supply: 2-Year and 5-Year Note Auction, 3 & 6-Month Bill Auction
Tuesday: US Advance Goods Trade Balance, Wholesale Inventories Advance, CB Consumer Confidence, JOLTS Job Opening (Jun), Atlanta Fed GDPNow, Australian CPI Q2
Supply: 7-Year Note Auction
Wednesday: German GDP Q2, EUR GDP Q2, US ADP Non-farm Employment, US GDP Q2, Crude Oil Inventories, Chinese Manufacturing PMI
Canada: BoC Interest Rate Decision, Rate Statement, Monterey Policy Report, BoC Press Conference
US: Fed Interest Rate Decision,FOMC Statement, Fed Press Conference.
Japan: BoJ Interest Rate Decision, Monetary Policy Statement
Thursday: EU Unemployment (Jun), US PCE & Core PCE Price Index (Jun)
Japan: BoJ Press Conference
Friday: EU CPI, US NFP, Unemployment Rate, Average Hourly Earnings, ISM Manufacturing PMI, Michigan 1-Year & 5-Year Inflation Expectations.
It is also a busy earnings week. See here for a complete earnings schedule .
Markets are interpreting trade deals as positive news thus far. The dollar is strengthening.
As we previously mentioned, we anticipate no rate cuts this year as economic data proves to be resilient and inflation largely under control. WSJ also posted an article stating that most tariffs costs are being absorbed by companies due to weaker pricing power. We previously wrote about this on our blog: “ In our analysis, the inflation impact of tariffs may not show up until Q4 2025 or early 2026, as tariff threats are mostly used as a lever to negotiate deals. While effective tariff rates have increased, as Trump reshapes how tariffs are viewed, cost pass-through to consumers will be limited in Q3 2025, as companies’ front-loaded inventory helps mitigate the risks of increased tariff exposure.
So, what we have is an interesting development shaping up where, while inflation may rise and remain sticky, it is yet to be seen whether slowing consumer spending will weaken enough to the point where companies must start offering discounts, which would nullify the tariff risk to the end consumer and result in companies absorbing all tariffs. This scenario will see reduced earnings margins leading into the last quarter and early 2026. However, it will materially reduce risks of higher inflation.”
In our view, the US dollar has a higher probability to rally in the short-term i.e., Q3 as markets re-align FX rate differentials. Bond yields stabilize, Equities continue pushing higher, while Gold retraces as previously mentioned. This in our view, is what investors and participants refer to as the Goldilocks scenario. If this plays out as expected we anticipate continued strength with AI, tech, energy and defense sectors outperforming into mid- 2026.
Institutional View: Morgan Stanley
Morgan Stanley also sees no rate cuts in 2025, despite market pricing for two 25 bps cuts. They forecast more aggressive cuts in 2026 due to:
• Tariff-related inflation emerging before labor market deterioration
• Slowing US growth, as fiscal support fades
• Impact of tighter immigration policy and global trade realignment
That said, MS continues to cite longer-term risks to the dollar, including:
• Twin deficits (fiscal + current account)
• Ongoing debate around USD’s safe haven status
• USD hedging activity picking up by international investors
• Strained credibility of the Fed due to tension between Fed Chair and the US Administration
How Fed policy evolves in Q4 2025 and Q1 2026 will depend heavily on the incoming Fed Chair nominee, who is expected to replace Jerome Powell in May 2026. This nomination could significantly influence future policy direction around growth and inflation targets.

USD/CHF Update: Missed the Last Short? Grab the New Trigger!Yo traders and market lovers, it’s Skeptic from Skeptic Lab! Here’s a quick USD/CHF update: my last short trigger after the support break gave us a 50-pip drop . With a solid stop loss, you’re likely sitting on a 2:1 R/R; risk-takers might even be at 5:1. I’m breaking down a fresh trigger in this video—don’t miss it! Drop your thoughts or coin requests in the comments, give it a boost if it helped , and don’t miss my educational post coming tonight on Skeptic Lab’s TradingView page with lessons from my first 100 trades—it’s gonna be fire. Catch you tonight! 😎

Learn the 3 TYPES of MARKET ANALYSIS in Gold Forex Trading
In the today's post, we will discuss 3 types of analysis of a financial market.
🛠1 - Technical Analysis
Technical analysis focuses on p rice action, key levels, technical indicators and technical tools for the assessment of a market sentiment.
Pure technician thoroughly believes that the price chart reflects all the news, all the actions of big and small players. With a proper application of technical strategies, technical analysts make predictions and identify trading opportunities.
In the example above, the trader applies price action patterns, candlestick analysis, key levels and 2 technical indicators to make a prediction that the market will drop to a key horizontal support from a solid horizontal resistance.
📰2 - Fundamental Analysis
Fundamental analysts assess the key factors and related data that drive the value of an asset.
These factors are diverse: it can be geopolitical events, macro and micro economic news, financial statements, etc.
Fundamental traders usually make trading decision and forecasts, relying on fundamental data alone and completely neglecting a chart analysis.
Price action on Gold on a daily time frame could be easily predicted, applying a fundamental analysis.
A bearish trend was driven by FED Interest Rates tightening program,
while a strong bullish rally initiated after escalation of Israeli-Palestinian conflict.
📊🔬 3 - Combination of Technical and Fundamental Analysis
Such traders combine the principles of both Technical and Fundamental approaches.
When they are looking for trading opportunities, they analyze the price chart and make predictions accordingly.
Then, they analyze the current related fundamentals and compare the technical and fundamental biases.
If the outlooks match , one opens a trading position.
In the example above, Gold reached a solid horizontal daily support.
Testing the underlined structure, the price formed a falling wedge pattern and a double bottom, breaking both a horizontal neckline and a resistance of the wedge.
These were 2 significant bullish technical confirmation.
At the same time, the escalation of Israeli-Palestinian conflict left a very bullish fundamental confirmation.
It is an endless debate which method is better.
Each has its own pros and cons.
I strongly believe that one can make money mastering any of those.
Just choose the method that you prefer, study it, practice and one day you will make it.
❤️Please, support my work with like, thank you!❤️
I am part of Trade Nation's Influencer program and receive a monthly fee for using their TradingView charts in my analysis.

Crude Oil Trade Idea: Intraday mechanicsNYMEX:CL1! NYMEX:MCL1!
Bigger Picture:
Traders should note that news headlines do not always drive the price action. More often, news outlets look for narrative to align with the price action.
Previously, it was about the supply glut and worsening demand due to an uncertain outlook. Now the latest news flow is about Aramco OSP rising, OPEC+ adding another 548K bpd in August — higher than anticipated 411K — of the wounding of involuntary cuts. News outlets now view this as signs of demand growth and low inventories.
What has the market done?
Market has consolidated, building acceptance around microComposite Volume Point of Control at 65.50 (mcVPOC). Market then broke out of this balance.
What is it trying to do?
Market is building value higher; 2-day mcVPOC is at 68.29.
How good of a job is it doing?
Market is holding support and has tested resistance multiple times. It has also held support.
What is more likely to happen from here?
Further movement higher as long as it holds above support and yearly open confluence in the short term.
Key Levels:
• Resistance zone: 68.95 - 68.85
• pHi: 68.87
• 2-day VPOC: 68.29
• pSettlement: 68.38
• yOpen: 67.65
• Support zone: 67.70 - 67.50
• pLow: 67.89
Primary Scenario:
Crude oil pit session begins with open auction in yesterday’s range. Prices move lower to test prior day's low, 2-day balance support in confluence with yearly open. Prices push back higher towards yesterday's settlement and 2-day Volume Point of Control (VPOC) at 68.33.
Secondary Scenario:
Crude oil pit session begins with open auction in yesterday’s range. Market consolidates and chops around pSettlement and 2-day VPOC. Market takes out overnight high, fails to go further higher, and reverts lower. Settles below overnight low, however staying above prior low to continue one-time framing higher for the regular trading hours (RTH).

Weekly Market Outlook: E-mini Nasdaq 100 Futures NQCME_MINI:NQ1!
It’s a quiet week for US economic news. However, the RBA and RBNZ are scheduled to announce interest rate decisions.
As has been the theme this year, markets remain highly sensitive to headline news and associated risks.
US President Trump signed the One Big Beautiful Bill Act into law at the White House.
Treasury Secretary Bessent is currently giving an interview on CNBC as we write this outlook. Explanation of the near-term impact of Trump’s BBB Act, tariffs, and trade deals will be key to monitor, as this may be fuel for further movement. The US is set to announce more trade deals in the next 48 hours, while trading partners who did not reach a deal will revert to April 2nd tariff levels, with the tariffs to take effect on August 1st.
As many as 100 smaller countries will get a set tariff rate.
How does this all translate into price action and expectations for the market?
NQ and ES are currently trading near all-time highs. RTY has potential upside as it plays catch-up. With the BBB Act signed into law, many of the investment banks anticipate a near-term positive impact on GDP.
In NQ, we are looking at the following scenarios:
Key LIS zone: 22860.50 – 22825.50
Support Zone: 22600 – 22582.25
Key Support Zone: 22000 – 22050
Scenario 1: Hold above key LIS
In this scenario, we expect new ATHs and continuing price discovery higher.
Scenario 2: Hold below key LIS
In this scenario, we expect the price to re-test the support zone at 22600 – 22582.25 and consolidate to build value higher. A break below support may lead to further short opportunities to retest the 22000 level.

9 Essential TIPS For Newbie Traders (Learn from my Mistakes!)
In the today's article, I will reveal trading secrets I wish I knew when I started trading.
1️⃣ Forget about becoming a pro quickly
Most of the traders believe, that you can learn how to trade easily and that it takes a very short period of time in order to master a profitable trading strategy.
The truth is, however, that trading is a long journey.
I spent more than 3 years, trying different strategies and looking for a profitable technique to trade. Once I found that, it took more than a year to polish a trading strategy and to learn how to apply that properly.
Be prepared to spend YEARS before you find a way to trade profitably.
2️⃣ Focus on One Strategy
While you are learning how to trade you will try different techniques, tools and strategies. And the thing is that newbies are trying multiple things simultaneously. The more strategies you try at once, the more setups you have on your chart. The more setups you have on your chart, the more complex and difficult is your trading.
Remember that in this game, your attention is the key.
You should meticulously study each and every trading setup.
For that reason, I highly recommend you to focus on one strategy, one approach, one technique. Test it, try it and look for a new one only when you realize that it doesn't work.
Here is the example how the same price chart can provide absolutely different trading opportunities depending on a trading strategy.
Price action pattern trader would recognize a lot of a patterns, while indicator based trader could spot absolutely different bullish and bearish signals.
Now, try to imagine how hard it would be to follow both strategies simultaneously.
3️⃣ Start with small capital that you can afford to lose
You will lose your first trading deposit and, probably, the second one and potentially the third one as well.
Losses are the only way to learn real trading. While you are on a demo account, you feel like a king, but once you start risking your savings, the perspective completely changes .
For that reason, make sure that you trade with an account that you can afford to lose. The fact of blowing such an account should be unpleasant, but that should not affect your daily life.
4️⃣ Use stop loss
I am doing trading coaching for more than 4 years.
What pisses me off is that the main reason of the substantial losses of my mentees is the absence of stop loss. Why can it be if naturally everyone: from your broker to Instagram trading gurus repeat that day after day.
Set stop loss, know in advance how much you risk per trade, and know the exact level on a price chart where you become wrong.
Imagine what could be your loss, if you shorted USDJPY and hold the trade while the market kept going against you.
5️⃣ Forget about getting rich quick
That is the iconic fallacy. I believe that around 90% of people who come in this game want to get rich quick , want easy money.
And no surprise, when I share a trading setup in my free telegram channel, and it loses I receive dozens of messages that I am a scammer.
People truly believe that professional trading implies 100% win rate and quick and easy money.
The truth is, traders, that trading is a very tough game. And with a good trading strategy, you have just a little statistical edge that will give you the profits that would slightly overcome your losses.
6️⃣ Train your eyes
Professional trading implies pattern recognition: it can be some technical indicators pattern, the price action or candlestick formation, etc.
Your main goal as a trader is to learn to identify these patterns.
Pattern recognition is a hard skill to acquire.
You should spend dozens of hours in front of the screen in order to train your eyes to identify certain patterns.
Here is how many patterns you would spot on GBPUSD chart, paying close attention.
7️⃣ Track and analyze your trades
Study all the trades that you take, especially the losing ones.
Look for mistakes, look for the reasons why a certain setup played out and why a certain one didn't. Journal your trades and make notes.
8️⃣ Don't use technical indicators
Newbies believe that technical indicators should do the work for them.
They are constantly looking for one or a bunch that will accurately show where the market will go.
However, I always say to my mentees that technical indicators make the chart messy and distract.
If you just started trading, focus on a naked chart, learn to analyze the market trend, key levels, classic price action patterns.
Learn to make accurate predictions relying on a price chart alone.
Only then add some technical indicators on your chart.
They won't do the work for you, but will help you to slightly increase the accuracy of a certain setup.
Above is the classic chart of a newbie trader.
A lot of indicators and a complete mess
The same chart would look much better without technical indicators.
9️⃣ Find a Mentor
There are hundreds of trading mentors on Instagram, YouTube, TradingView. Find the one with a trading style that you like.
Follow him, learn from his trading experience, listen to his trading recommendations.
11 years ago I found a guy on YouTube, his name was Jason.
I really liked his free teachings, and they were meaningful to me.
I decided to purchase his premium coaching program.
It was 200$ monthly - a huge amount of money for me at that time.
However, with his knowledge I saved a lot, I learned a lot of profitable techniques and tricks that helped me to become a professional forex trader.
Of course, this list could be much bigger.
The more I think about different subjects in trading, the more important tips come to my mind. However, I believe that the tips above are essential and I truly wish I knew all that before I started.
I hope that info will help you in your trading journey!
Good luck to you.
❤️Please, support my work with like, thank you!❤️
I am part of Trade Nation's Influencer program and receive a monthly fee for using their TradingView charts in my analysis.

Crude Oil Weekly OutlookNYMEX:CL1! NYMEX:MCL1!
With Nasdaq futures hitting all-time highs, our attention now turns to Crude Oil, which has seen a sharp pullback over the past week.
All-time highs in equity indices present a unique challenge:
There are no historical reference points—no prior price or volume data to lean against. Traders typically turn to tools like Fibonacci extensions, measured moves, or rely on market-generated information and emerging intraday levels before making decisions.
What Has the Market Done?
Crude Oil Futures (CL) posted a record drop last week, falling sharply from a Sunday open high of $78.40 to a Monday close low of $64.38—a $14.02 decline.
This sharp sell-off followed developments suggesting a potential Iran–Israel ceasefire and the end of a two-week conflict, prompting markets to rapidly unwind the geopolitical risk premium.
What is it trying to do?
CL Futures have since consolidated around the 2025 mid-range. The market appears to be in a balancing phase, digesting the removal of war-related premiums and recalibrating based on fundamentals.
How Good of a Job Is It Doing?
Having effectively priced out war risk, the market is now refocusing on fundamentals.
The global demand outlook is improving, driven in part by progress in trade deals.
OPEC’s June Monthly Oil Market Report (MOMR) forecasts global oil demand growth of 1.3 mb/d for 2025.
This transition from headline risk to fundamental drivers indicates market maturity and resilience, albeit within a still-volatile regime.
What Is More Likely to Happen From Here?
Today marks the final trading day of the month, and seasonal demand will become increasingly relevant.
Summer weather and travel activity are expected to drive demand for jet fuel and gasoline.
These seasonal tailwinds, if sustained, could help stabilize price action around key technical zones.
Key Levels:
yOpen: 67.65
pHi: 66.09
pIB Hi: 66
2025 mid-range: 65.39
pLow: 64.80
Overnight Low: 64.55
Naked VPOC: 64.50
Scenario 1: Continued Consolidation (Balance Holds)
Crude oil maintains range-bound behavior.
Strategy: “Outside-in” trading—fade moves at range extremes until new directional information emerges.
Scenario 2: Break from Balance
If directional conviction builds, price could break the current consolidation.
Upside target: Yearly open near $67.65.
Downside risk: March 2025 low if $64.40 fails.
All intraday levels noted above should be monitored for structure and participation.

Risk and Probability in Trading — Why Risk Assessment MattersRisk and Probability in Trading — Why Risk Assessment Matters More Than Chasing the “Holy Grail”
In trading, most participants and analysts are focused on finding the so-called “Holy Grail” — the perfect entry point where the price moves in the desired direction and yields profit. However, few actually assess the risks involved, as if success is possible without factoring them in. Market reviews are often filled with levels, forecasts, and price directions, but rarely include probability estimates or potential losses.
In my view, the real Holy Grail isn't a guaranteed profitable entry, but a scenario where the market offers a position with minimal risk relative to historical context. To identify such setups, we need a risk scale based on historical data — how favorable the current risk-to-reward ratio is compared to the past.
It’s also crucial to understand that no one can predict price direction with certainty. The key to opening a position is not hope, but evaluating all possible scenarios — upward, downward, or sideways — and knowing the outcome in each case. Risk management is more than just placing a stop-loss; it’s a structured approach that should be central to any trading strategy.
What Are Minimal Risks?
“Minimal risk” is a relative concept — it only makes sense when measured against a defined scale. Building such a scale requires historical statistics: what were the maximum and minimum losses and profits for similar positions in the past?
Profit-to-Loss Ratio
The idea behind the search for the “Holy Grail” is to find moments when the market offers the best possible profit-to-risk ratio. For example, if the current ratio is 10, and historically it has ranged from 0 (low risk) to 100 (high risk), then 10 may be a good entry point. If the ratio approaches 80–90, it signals that the position is extremely risky.
Why Are Probability and Risk Assessment Important?
Market reviews often talk about resistance levels, volatility, and price direction — but rarely address the risks of different scenarios. No expert can predict market movements with certainty — if they could, they’d be billionaires. Opening positions without accounting for risks and scenario probabilities is extremely dangerous.
How to Factor in Risks When Entering a Position
The key question is: what will the profit-to-loss ratio be after entering a position, depending on whether the price goes up, down, or stays flat? It’s important to understand the consequences of each case and make decisions based on risk assessment.
Risk Management Must Account for the Inability to React Instantly
Conventional tools like stop-losses and limit orders often fail to protect capital effectively during sudden price spikes. These tools are particularly vulnerable when market makers or high-frequency algorithms trigger stop levels en masse.
This highlights the need for more resilient risk management instruments — ones that can respond to volatility instantly and automatically. Options are one such tool, capable of limiting losses regardless of market dynamics.
Without robust risk management, long-term profitability becomes statistically unlikely. Sooner or later, the market will present a scenario that can wipe out your capital — unless you’re properly protected.
Important note: this is not an endorsement of options or any specific broker. It’s simply a conclusion based on the logic of building effective capital protection. If a broker only provides access to linear instruments (futures, spot, stocks) without the ability to hedge, it will inevitably lead to capital erosion — even for systematic traders.
And if this article gets more than 100 rockets, I’ll continue sharing specific examples of low-risk trading assessments.

Crude Oil Prices Rocketing amid geopolitical risks
NYMEX:CL1! NYMEX:MCL1! NYMEX:BZ1!
Macro:
Geopolitical tensions remain high and markets are now likely to price in our scenario discussing ongoing air and missile war, given one-off intervention from the US thus far. According to Reuters, the U.S. now assesses that Iranian retaliation could occur within the next two days.What happens next is anybody’s guess but as traders, it is important to navigate these uncertainties with scenario planning and/or reduce risk to account for increased volatility.
We also get Services and Manufacturing PMI data today and PCE Price Index on Friday. Chair Powell is set to testify on Tuesday 9am CT.
Key levels:
Jan 2025 High: 76.57
2025 High: 78.40
2025 CVAH(Composite Value Area High): 75.68
Key LIS zone: 73.50-73.15
We anticipate the following scenarios in crude oil:
Scenario 1:
Prices remain elevated as tensions remain high, despite limited retaliation, however, the situation overall now escalated beyond return to diplomacy.
Scenario 2:
Any push towards de-escalation, unlikely in our analysis, but given the headline risk, crude prices may remain volatile and come off the highs.
Given our key LIS (Line in Sand) zone above, we favor longs above this and shorts below this zone.

FED Day: NQ Futures planCME_MINI:NQ1!
Today is FOMC day; however, there is a larger geopolitical risk looming, along with the trade war and tariffs situation unfolding.
Recently, we have noted inflation moving lower, although it is not yet at the FED’s 2% target. Retail sales fell sharply last month. Tariffs have not yet resulted in inflation so far, partly due to the 90-day pause, and with possible extensions, some deals agreed upon, and a framework for others in place, tariff uncertainty has considerably reduced.
On the contrary, lower energy prices that supported lower inflation have risen due to ongoing geopolitical issues. Risks remain high for elevated energy prices even if supply and sea routes remain unharmed. In our view, this is due to the fragility of the situation and what it would take to turn the ongoing war into the worst possible outcome.
The FED releases their Summary of Economic Projections. Key data points will be inflation and growth projections, along with interest rate projections and any talks about neutral rates and expected cuts, given the bleak global outlook and growth. The FED is otherwise expected to hold rates steady in this meeting.
Given this, and what Chair Powell says in the FOMC press conference, their commitment towards driving inflation lower versus maximum employment, risks on the growth and employment side have started to worsen. If rate cut bets are moved forward or if markets price in more rate cuts than currently priced in, we may see equity index futures make further gains.
NQ futures are coiling; the yearly VPOC has shifted higher, as we explained in our previous analysis.
Today’s meeting may be key for further fuel higher or lower, depending on how it pans out. Market participants are in a wait and see mode. Markets are accepting higher prices and break of balance is key to determine the direction price may be headed in. Until otherwise proven, markets are range bound and mean reverting from June Composite Volume Profile towards monthly VWAP and VPOC.

Weekly Market Outlook: FOMC, Trade Deals and GeopoliticsIt is a holiday-shortened week, with the majority of markets halting early on Thursday, June 19, 2025, in observance of Juneteenth. See here for holiday trading schedule
Key Themes to Monitor This Week
Geopolitical Risks
Any outside intervention in the ongoing Israel-Iran conflict will likely be seen as a risk-off event by market participants. Despite Friday’s sell-off, markets shrugged off during the Sunday open and overnight sessions.
There are potential risks to trade routes and energy infrastructure, although disruptions seem unlikely at the moment. Amena Bakr at Kpler noted that, so far, there are no signs of disruptions in oil loadings from Iran. Without a supply outage, there is no pressing need for additional barrels to be brought onto the market.
Trade War and Trade Deals
There have been recent developments with the U.S. reaching key trade deal milestones with several countries. The baseline scenario remains optimistic, with expectations for an extension in negotiations and potential reciprocal tariffs for countries failing to reach agreements.
FED Week
This is a key week for U.S. monetary policy, with the FOMC decision, Summary of Economic Projections (SEP), and Chair Powell’s press conference scheduled.
Traders will be closely watching how the Fed’s inflation and growth expectations have evolved, as reflected in the SEP. All eyes will be on the dot plot to note how interest rate expectations have evolved since last quarter. Of note: Will President Trump’s continued calls for rate cuts influence Chair Powell’s tone or guidance?
Expectations for the Week Ahead
NQ futures have continued one-time framing higher, consistently creating higher lows since the week of April 21, 2025. A strong support zone exists below, anchored at the yearly Volume Point of Control (VPOC) and the Anchored VWAP from May 11, 2025, when markets gapped higher.
Key Levels to Watch
• yVAH: 22,690.50
• R2: 22,510
• R1 / Previous Week High: 22,322.50
• May 11 AVWAP: 21,672.25
• yVPOC: 21,660
Scenario 1: Market Grinds Higher but Stays Cautious
Despite several looming risk factors, the market could continue to grind higher. In this scenario, we anticipate a test above the prior week's high, followed by a potential pullback into last week’s range.
Example Trade Idea 1
• Entry: 22,000
• Stop: 21,930
• Target: 22,322
• Risk: 70 pts
• Reward: 322 pts
• Risk-Reward Ratio: 4.6R
Scenario 2: Pullback to Support, Range-Bound Consolidation
If the market pulls back, we expect the yearly VPOC and AVWAP from May 11 to act as key support levels. In this case, price action may remain range-bound within the previous week’s range, forming an inside week.
Example Trade Idea 2
• Entry: 21,672
• Stop: 21,600
• Target: 22,000
• Risk: 72 pts
• Reward: 328 pts
• Risk-Reward Ratio: 4.6R
________________________________________
Glossary
• VPOC: Volume Point of Control
• VA: Value Area
• VAL: Value Area Low
• VAH: Value Area High
• VP: Volume Profile
• AVP: Anchored Volume Profile
• Y: Yearly
• pWk: Previous Week

Mid-Week Outlook Update: US CPI- Trade TalksCPI day today. Scheduled to be released at 7:30 AM CT.
CME:6E1! CME_MINI:ES1! CME_MINI:NQ1! CME_MINI:MNQ1! CME_MINI:MES1! COMEX:GC1! CBOT:ZN1!
ES futures edged slightly higher after positive commentary from US-China trade talks. The delegations from both sides agreed on a framework to move forward with negotiations.
It is important to note that Trade War 1.0 took about two years to formalize and finalize. However, given the previous experience and the current agreement on the framework, our opinion (which is not the consensus) is that the trade deal between China and the US may be closer than what most analysts and investors might otherwise predict.
Like any negotiations, China and the US have previously discussed these difficult issues and have found a way to resolve them. Although the concerns have shifted towards niche sectors, we still view baseline tariffs with some sectors seeing increased tariffs as likely.
TACO (Trump Always Chickens Out) acronym traders will see a tougher stance from Trump to resolve the overarching trade deficit issue with China, particularly the dumping of Chinese goods.
AI, defense technology, chips, and rare earth minerals are at the center of these discussions. There will be targeted controls on exports of chips from the US and exports of rare earth minerals on the Chinese side, despite the current framework and deals agreed. In our view, these controls will be phased out until agreements are finalized, to maintain leverage and show TACO acronym backers that Trump is not “chickening out,” but rather maintaining a strong stance while negotiating trade deals with China and other countries.
In our analysis, despite positive headlines, the overhanging uncertainty has not dissipated. In fact, there is clarity that President Trump is willing to take the difficult road to negotiate from an apparent position of strength. Would this result in extension of trade deadlines or temporary increase in tariffs followed by an extension of deadlines? This remains to be seen!
If May CPI comes in lower than expectations, this will be a nudge in the direction that tariffs are not translating into higher inflation. We may see a rally in index futures.
On the contrary, any increase in CPI above the previous 2.3% YoY increase will be seen as tariff-induced inflation.
In our analysis, given lower energy prices, rent inflation stabilizing at levels last seen in late 2021, and services inflation in the US trending lower from the peak in January 2023, we are seeing embedded inflation in the prior two months and this may remain sticky in today’s release. However, any stability with lower energy prices seen in the prior month will point to a lower inflation print overall.
Comment with your favorite trade idea from our past trade ideas and what you would like to see more of.

ES Futures-Weekly OutlookCME_MINI:ES1!
Fundamentals and Economic Calendar
Data Recap:
• Friday: 06/06/2025
o US Non-Farm Payrolls (May) 139k vs. Exp. 130k (Prev. 177k, Rev. 147k)
o US Unemployment Rate (May) 4.2% vs. Exp. 4.2% (Prev. 4.2%)
o US Average Earnings YY (May) 3.9% vs. Exp. 3.7% (Prev. 3.8%, Rev. 3.9%)
• Overnight Monday: 06/09/2025
o Chinese Trade Balance (USD)(May) 103.22B vs. Exp. 101.3B (Prev. 96.18B)
o Chinese Exports YY (USD)(May) 4.8% vs. Exp. 5.0% (Prev. 8.1%)
o Chinese Imports YY (USD)(May) -3.4% vs. Exp. -0.9% (Prev. -0.2%)
o Chinese CPI MM (May) -0.2% vs. Exp. -0.2% (Prev. 0.1%)
o Chinese PPI YY (May) -3.3% vs. Exp. -3.2% (Prev. -2.7%)
o Chinese CPI YY (May) -0.1% vs. Exp. -0.2% (Prev. -0.1%)
Looking ahead this week on the calendar, notable economic data releases are as follows:
• Wednesday: 06/11/2025
o US CPI YoY (May)
o US CPI MoM (May)
o US 10 year Note Auction
• Thursday: 06/12/2025
o US PPI MoM (May)
o US PPI YoY (May)
o US 30 year Bond Auction
• Friday: 06/13/2025
o Michigan Consumer Sentiment (Jun)P
o Michigan 1-year and 5-year Inflation Expectations (Jun)P
On the trade and tariff front, we have China-US trade talks continuing in the UK today. The Chinese Vice Premier is visiting the UK from June 8th-13th.
There has been progress made which is visible in terms of China relaxing export controls on rare earth minerals and President Trump stating that they are very far advanced on the China deal ahead of high level talks in London today.
The FED is in a blackout period until the FOMC meeting. Trade, tariffs, and geopolitical risks still need to be monitored.
Technical:
What has the market done?
With NQ leading, ES has also reclaimed yearly open. It held above yearly open in the overnight session.
What is it trying to do?
Climb higher, overlapping bars and yearly VPOC shifting higher denote acceptance at higher prices.
How good of a job is it doing?
Overlapping bars, headline risks and leveraged positions also point towards potential for prices moving lower before resuming higher or remaining range bound. TACO acronym traders may be in for max pain.
What is more likely to happen from here?
Given the data above, we would iterate given our previous explanation that recent data including CPI, PPI, Trade imports, exports is skewed due to trade tensions and this being reflected in business and consumer behavior. FED is likely to remain on hold while it waits and averages out the impact on growth, inflation and labor market.
Scenario 1: Push higher
Prices continue to push higher, if CPI comes in lower than expected, this may prompt a short-term continuation higher.
Scenario 2: Range bound
Markets remain in wait and see mode this week having climbed above yearly open. Markets build value higher and we expect VPOC to shift higher too.
Scenario 3: Sell-off
A mix of factors could e.g., trade talks stalling, weaker than expected US 10 year and 30 year auctions could foreshadow cracks appearing in the bonds market. This may fuel a wider sell-off if yields climb back higher.
Glossary:
ES - emini-S&P 500 Futures
NQ - emini-NASDAQ 100 Futures
VPOC - Volume Point of Control: The most traded price by volume in a given range. Represents acceptance or consensus

ES Trade Idea and Upcoming NFP ReportCME_MINI:ES1!
• What has the market done?
ES futures are lagging compared to tech heavy index NQ futures. ES futures are still below yearly open. Yearly open has been a strong area of resistance since the rally of April 6th Lows in futures complex.
• What is it trying to do?
ES futures are in consolidation mode, building value higher. VPOC has shifted higher since the gap up from May 11th open. VPOC and 0.786 fib level provide a base for a continuation higher.
• How good of a job is it doing?
Markets seem to be slowing its rally. After such a strong rebound, participants are wary of any pull-backs. Although a strong trend higher, consolidation or a pullback is not illogical at these levels.
• What is more likely to happen from here?
o Scenario 1: Hold steady and NFP provides needed boost for markets to get across yearly open resistance and climb higher.
o Scenario 2: A mixed NFP report may point towards further consolidation. Key level 5873 as support on move lower before reverting higher.
o Scenario 3: A hawkish NFP report that signals higher for longer rates, may be interpreted by market participants as less monetary stimulus and dwindling rate cut bets for this year. We anticipate a sell-off towards 0.618 fib level in this scenario, moving to the lower edge of micro composite volume profile.
In all the above scenarios, there is a clear LIS at yearly open. Other key levels are defined cleanly on the higher time frame. Important thing for traders to note here is to trade what you see and not what you think. Having an alignment between fundamentals and technicals is sound but the markets do what they do, and price moves where it should. Painting narrative to any move may sound fancy but it gets less important at intraday time frames in our opinion. Hence why we view all this considering auction markets and volume profile.
Glossary:
ES - emini-S&P 500 Futures
NQ - emini-NASDAQ 100 Futures
VPOC - Volume Point of Control: The most traded price by volume in a given range. Represents acceptance or consensus
NFP - Non-Farm Payroll: Released by the US Department of Labor around the 1st Friday of every month. It reports on Unemployment, Productivity and other key metrics. Key economic release
LIS - Line In the Sand: A key zone that might tip buyers or sellers to act to cover risk and might change the overall bias of our analysis

Multi-Time Frame Analysis (MTF) — Explained SimplyWant to level up your trading decisions? Mastering Multi-Time Frame Analysis helps you see the market more clearly and align your trades with the bigger picture.
Here’s how to break it down:
🔹 What is MTF Analysis?
It’s the process of analyzing a chart using different time frames to understand market direction and behavior more clearly.
👉 Example: You spot a trade setup on the 15m chart, but you confirm trend and structure using the 1H and Daily charts.
🔹 Why Use It?
✅ Avoids tunnel vision
✅ Aligns your trades with the larger trend
✅ Confirms or filters out weak setups
✅ Helps you find strong support/resistance zones across time frames
🔹 The 3-Level MTF Framework
Use this to structure your chart analysis effectively:
Higher Time Frame (HTF) → Trend Direction & Key Levels
📅 (e.g., Daily or Weekly)
Mid Time Frame (MTF) → Structure & Confirmation
🕐 (e.g., 4H or 1H)
Lower Time Frame (LTF) → Entry Timing
⏱ (e.g., 15m or 5m)
🚀 If you’re not using MTF analysis, you might be missing critical market signals. Start implementing it into your strategy and notice the clarity it brings.
💬 Drop a comment if you want to see live trade examples using this method!

Macro Outlook: Trade War Jitters, Deficit, NFP FridayAlthough there is a headline fatigue and markets have been stabilizing with the worst of trade war story behind us, the fact is that uncertainty still looms. President Trump announced over the weekend that he will double down on US steel and aluminum tariffs from 25% to 50% effective June 4th.
Highlight this week is US Jobs data this Friday. A key point to determine the resilience of the US labor market. With FED Chair Powell speaking today and FED speakers scheduled throughout the week, it will be key to watch how they shape markets' probability of rate cuts?
As we previously explained, ongoing uncertainty and dragging trade concerns present more risks until resolved. Here are some key points to consider:
It remains to be seen whether the trade deficit will continue to worsen or begin to reverse. April trade data, along with any policy shifts such as a reversal on reciprocal tariffs, will be important to monitor. These indicators will provide insight into how businesses are interpreting ongoing trade uncertainty. The key question is whether they will continue front-loading inventory in anticipation of future disruptions, or if the focus will shift toward restructuring supply chains and reining in spending as part of a longer-term strategic adjustment.
At the same time, consumer spending remains resilient, supporting overall demand. However, pressure may be building on business balance sheets, particularly businesses with poor cash flow to manage front loading inventory spending as the trade environment remains volatile. If consumer spending begins to weaken, businesses may be forced to cut costs, scale back investment, or offer steep discounts to clear excess inventory. This could lead to a cycle of margin compression, especially if firms attempt to pass higher costs onto price-sensitive consumers, potentially suppressing demand further.
Conversely, if businesses choose to absorb rising costs to maintain competitive pricing, they face deteriorating margins but may be betting on continued strength in consumer credit, household savings buffers as evident. Consumer confidence, despite being low, is not an accurate indicator in times of uncertainty. Here, we should watch what consumers do and not the sentiment.
In this scenario, firms may delay cost-cutting in the hope that continued strength in consumer spending will support revenues through the rest of the year.
A central tension remains: businesses must navigate a delicate balance between protecting margins and preserving demand. Meanwhile, persistent trade uncertainty and tighter financial conditions may slow capital investment and hiring, further complicating the outlook. Whether firms shift from defensive postures like front-loading toward long-term structural changes in supply chains will hinge on how durable current consumer strength proves to be and how responsive trade policy becomes in the months ahead.
Ongoing front-loading has caused ripples as the trade deficit has further widened. Will this reverse as businesses focus on sales and revenue instead of front-loading inventory?
In our analysis, trade imports, trade balance, consumer spending and corporate profits will be key to monitor despite being lagging indicators.
On the other hand, equally important to watch and monitor goods exports, durable goods to assess and evaluate the other side of the equation.
However, our focus is on imports as manufacturing jobs are at their lowest in US history.
Once the dust has settled and trade deals are locked in, it will be important to note if Exports by Country experience any significant shifts.
What does all this mean for the stock market and futures? In simple terms, the yearly pivot and last month’s high is a major resistance area for index futures. Until this is cleared, we may see a range bound market and two way trade. There is a lot of weak structure to revisit lower. Markets may perhaps retest this before resuming higher. What we would want to see is, last month’s low holding support and this month’s price action trading inside previous month’s range or resuming higher.
If we revisit May Monthly Lows, we may see increased selling pressure come in.

Nvidia Earnings Boost, Trade Tariffs Legitimacy, NQ trade ideaCME_MINI:NQ1!
Big Picture Context: .
NQ futures rallied after NVIDIA posted an earnings beat and after the Manhattan-based Court of International Trade blocked President Trump's Liberation Day tariffs.
Goldman Sachs noted that the ruling on Liberation Day tariffs gives the administration 10 days to halt tariff collection, but does not affect sectoral tariffs. The administration can still impose across-the-board and country-specific tariffs under other legal authorities.
Jobless claims and continuing claims have come in higher.
What has the market done?
The rally faded in the overnight session. However, the catalysts provided energy for prices to move higher. Currently, price is trading above the prior week’s high, yesterday’s high, and it is also trading above the yearly open, and 2025 VPOC and mcVPOC for the last 3 weeks.
What is it trying to do?
The market is negating the recent bear market territory sell-off and negating a bear market rally. It is propelling higher.
How good of a job is it doing?
The market has created good structure and micro composites, despite some gaps left open, and it has created higher lows since last Friday.
What is more likely to happen from here?
Scenario 1: Long Continuation
In this scenario, we are looking for NQ to turn at the immediate 2025 LVN support area. If it edges higher, we will be looking for potential long opportunities above the 21710–21720 area, targeting overnight highs and potentially the next HVN.
Scenario 2: Gap Close and Reversal
In this scenario, we are looking for a pullback, testing pHi and pWk-Hi. We will look for a rounded base that consolidates here on a lower timeframe, such as the 5-minute timeframe, and look for a reversal back towards the 21710–21720 level.
pWk-Hi: prior Week's High
pHi: prior Day's High
HVN: High Volume Node
LNV: Low Volume Node
VPOC: Volume Point of Control
C: Composite (prefix before VAL, VAH, VPOC, VP, AVP)
mC: micro-Composite (prefix before VAL, VAH, VPOC, VP, AVP)

Steepening Yields & Uncertainty: What says the Bond Markets?
CBOT:ZN1!
US Yield Curve in Image Above
Showing yields on May 27, 2024 vs May 27, 2025 . What happened in a year and how to understand this?
Looking at the image above, the yield curve was inverted on this day last year. Comparing last year’s term structure to today’s, we can see that the yield curve has steepened sharply.
What does this signify? Let’s dive deeper as we share our insights and assessment of what the bond market is doing.
At the March 16, 2022, meeting, the FED finally pivoted away from their "transitory inflation" narrative to a significant supply shocks narrative—supply-demand imbalances and Russia-Ukraine war-related uncertainty. This started a rate hike cycle, with rates peaking at 5.25%–5.50% in the July 26, 2023, meeting.
The Fed Funds rate was reduced by 100 bps, with a cut of 50 bps on September 18, 2024, and two cuts of 25 bps in the November and December 2024 meetings. The FED paused its rate cutting at the start of the year, citing—as we have all heard recently—that the inflation outlook remains tilted to the upside, and given policy uncertainty and trade tariffs, the risk to slowing growth continues to increase. Businesses are holding back spending due to this confusion and continued uncertainty. ** Refer to the image of FED rate path above.
The start of the rate hike cycle also began the FED’s balance sheet reduction program—from a peak of $8.97 trillion to the current balance of $6.69 trillion. **Refer to the image of FED's balance sheet above.
Rates remained elevated at these levels to bring down inflation, which peaked at 9.1% in June 2022. Inflation has currently eased to 2.3% as of April 2025. Refer to the CPI YoY image above.
Ray Dalio, Jamie Dimon, and most recently non-voter Kashkari (FED) highlighted stagflationary risks. FED Chair Powell noted risks to both sides of its dual mandate in its most recent meeting March 19, 2025.
In the March meeting, they also announced a slower pace of reducing Treasury securities, agency debt, and agency mortgage-backed securities. In this announcement, Treasury securities reduction slowed from $25 billion to $5 billion per month, while maintaining agency debt and agency mortgage-backed securities reduction at the same pace.
Many participants and analysts noted this as a dovish pivot. However, given the current market conditions and the supply-demand imbalance emerging within US Treasury and bond markets, we note the rising yields.
The yield curve steepening signifies that investors want better return on their bond holdings. The interesting turn of events here is that US Treasuries and bonds have not provided the safety they usually do in times of uncertainty and policy risk. The dollar has fallen in tandem with bonds, resulting in a devalued dollar and rising yields. Thirty-year yields touched the 5% level, and the DXY index traded at levels last seen in March 2022.
Looking deeper under the hood, we note that a repeat of COVID-pandemic-style stimulus measures may perhaps result in an uncontrollable inflation spiral. The ballooning twin deficits—i.e., trade and budget deficits—with the new “Big Beautiful Bill,” or as some analysts joked, noting this as a foreshadowing of the newest credit rating: “BBB.”
Any black swan event may just be the catalyst needed to tip these dominoes to start falling.
As we previously noted in some of our commentary, debt service payments are now more than defense spending.
The new bill, once passed, is going to add another $2.5 trillion to the deficit. While the deficit is an issue in the US, it is important to note that it is a global issue.
The key question here will be: in due time, will the US bond market and US dollar regain their usual haven status? Or will we continue seeing diversification into Gold, Bitcoin, and global markets?
So, to summarize these mechanics playing out in the US and global markets—in our view—sure, the US administration, one may debate, is not helping by creating this environment of uncertainty in global trade, coupled with a worsening deficit and higher-for-longer rates. The markets currently are perhaps at their most unpredictable stage, with so much going on in the US and across the world.
It is still too early to write off US exceptionalism, and there will be value in rotating back to US markets once the dust on policy uncertainty settles. We suggest that investors stay diversified, watch for any upside surprises to the inflation and do not chase yields blindly as the move may already be overstretched. It is also our view that we are past the extreme policy uncertainty having already noted Trump put when ES Futures fell over 20%.
Although note that near All-time highs or at 6000 level, we are likely to see further headline risks until trade deals are locked in. As always, be nimble, pragmatic and be ready to adjust with evolving market conditions.
Definitions
Plain-language definition: A “basis point” (bps) is 0.01%. So, a 50 bps cut = 0.50% reduction in interest rates.
Plain-language definition: A steep yield curve means long-term interest rates are much higher than short-term ones. This can reflect rising inflation expectations or increased risk.
A “black swan event”—an unpredictable crisis—could set off a chain reaction if confidence in US finances weakens further.
Trade deficit: Importing more than exports
Budget deficit: Government spending far more than it earns

Gold Futures Analysis: Trade Plan COMEX:GC1!
Gold remains in a strong uptrend on the higher time frames, having recently broken above the $3000 level. This move sets the stage for further upside potential. The chart below highlights a Megaphone chart pattern, signaling volatility and broad price swings.
On the 4-hour chart, a pennant pattern is emerging within the uptrend, marked by a downtrend line from the recent highs. Additionally, an inverse head and shoulders pattern has formed, with a decisive breakout higher towards the 2025 CVAH. This level coincides with a high-volume node (HVN) and the edge of the value area distribution for 2025, suggesting it’s a key point of interest. Some consolidation is expected here before we either continue higher or see a rejection that could pull price back toward the uptrend line.
Scenario 1: Continuation Higher, Capped by 3400 Level
In this scenario, we anticipate further consolidation within the pennant on the 4-hour timeframe. After a brief pause, gold could continue higher, testing the 3400 resistance level. If momentum remains strong, we expect to see price consolidate within the pennant pattern to build energy for the next leg higher.
Scenario 2: Rejection at CVAH
In this scenario, gold struggles to sustain the move higher after breaking out from the inverse head and shoulders pattern. A failure to maintain the rally above the CVAH could lead to a rejection, followed by a retracement within the pennant structure. This would likely set up further consolidation towards the 3200 level before the next move up, possibly testing the uptrend line for support.
Our thoughts:
Gold is currently navigating an important juncture, with key levels at 2025 CVAH, 3400 and 3200 in focus. The near-term direction will depend on how price behaves within the pennant, as well as how it reacts to potential resistance or support levels. Traders should stay alert for volatility, as the consolidation phase could resolve in either a continuation of the uptrend or a pullback towards the trendline. Flight to safety, rising yields and geopolitical tensions will play a key role in shaping sentiment and trend in the Gold market.

Yearly Open in Play — Is This the Real Bull or Just a Bounce?CME_MINI:ES1!
Macro Recap
Late Friday, Moody’s lowered the US’s sovereign rating from AAA to Aa1. This reflects a unanimous downgrade of the US, joining S&P and Fitch in stripping the US of its AAA status.
Would this result in a sell-off?
In our analysis, and consensus from the Street, is that it will be contained since the downgrade puts Moody’s in the same camp as S&P and Fitch.
There are talks of renegotiating UK–EU trade deals, which has boosted cable.
On the geopolitical side, not much has changed. Ceasefire talks are ongoing but stuck in neutral. No new catalysts—yet.
The spotlight, however, is firmly on the Fed. Over the weekend, President Trump called on Chair Powell to cut rates “before it’s too late,” echoing a post from April 17th where he labeled Powell’s speech “a complete mess” and added, “Powell’s termination cannot come fast enough.”
With a packed schedule of Fed speakers this week, the real question is whether they’ll double down on the Fed’s independence—or bend toward political gravity, especially with Trump reportedly eyeing the top job.
Economic data is light. That puts full attention on the Fed and headline risk. Traders should stay nimble and alert. Momentum could shift fast.
Markets are now pricing in two cuts of 25 bps each for September and December 2025.
This is very different from market pricing one month ago, when reciprocal tariffs were announced.
Monitoring rate cut expectations is another key theme this week, with multiple Fed speakers scheduled.
ES Futures
ES Futures have been one-time framing up — i.e., creating higher lows — on the weekly timeframe.
ES Futures have also created higher highs.
Key Levels:
• March 2025 High: 6052.50
• 2025 Yearly Open: 6001.25
• Previous Week High: 5977.50
• Previous Week Mid: 5856
Bull Market—or Just a Bear Bounce?
That’s the question traders are asking.
From our perspective, this looks like a recovery from a trade policy shock. The market took the hit, recalibrated, and bounced back.
But let’s not get ahead of ourselves. After a move this strong, some pause is natural. We’re watching for potential consolidation or profit-taking, especially with price action still holding below the yearly open.
Caution is warranted here—momentum’s in play, but the structure hasn’t fully confirmed the shift.
Scenario 1: Another Up Week, Capped by Yearly Open
In this scenario, the rally will be contained as the yearly open remains a strong pivot and resistance zone.
The LIS (Line in the Sand) for short trade opportunities is the yearly open pivot.
Scenario 2: Range-Bound Week
In this scenario, we expect markets to consolidate, remaining above last week’s low and finding support at the prior week’s mid-range.
We will look to initiate longs from the previous week’s mid-range, looking for level-to-level scalping opportunities in a range-bound market.

WTI Crude Oil: Trade Idea Context and SetupOur Long trade idea has already reached its target at 5921.75 in ES futures.
If you missed it, here’s a link to our article from the start of the week:
Note that, our entry was at 5861, while our stop was at 5837 in the example trade idea. The maximum low price was 5835.75 during Monday’s overnight session. Our stops could have been filled given this, however, we want to remind traders that these example trade ideas are for educational purposes, they are not a recommendation. Stops are never meant to dictate exact stop prices. Trader’s should place their stops according to their own risk management plan whether that be a mix of fixed dollar amount and market structure or filtering down to execution time frames to place stops per market generated information and structure.
Today’s Trade Idea: WTI Crude Oil
We will analyze the Long trade idea in WTI Crude Oil, providing both context and setup.
Fundamental Analysis Supporting Our Scenario:
Following the reciprocal tariff announcements, WTI Crude Oil fell to its lowest level of 54.48, a price last seen in 2023.
While equity markets have recovered, crude oil remains subdued—widely attributed to concerns over OPEC+ overproduction.
However, as we’ve previously explained, this interpretation is incorrect. The OPEC+ production increases were planned as early as December 2024, and the rollback of voluntary cuts is primarily aimed at meeting domestic demand within OPEC+ countries.
This uptick in consumption also coincides with seasonal demand from summer and the Hajj pilgrimage in Saudi Arabia.
Additionally, with the reversal of China’s escalatory tariffs and newly signed deals in the Middle East, many analysts have revised their GDP and recession forecasts upward.
We believe this improved economic outlook is yet to be priced in by the oil markets.
Technical Analysis Supporting Our Scenario:
From a technical standpoint, there is a significant resistance zone and key Low Volume Node (LVN) stacked just above the 2025 mCVAL and Q2 2025 mCVAH. The March 2025 Low also sits just above this cluster.
Our analysis projects a potential move from these levels up to the next major area of stacked levels:
• AVWAP from 2025 High
• Yearly 2025 VWAP
• 2025 Mid-Range
This sets the stage for a potential long opportunity in WTI Crude Oil as markets begin to price in shifting fundamentals and technical conditions align.
Key Levels:
• 2025 mCVAL: 63.38
• Q2 2025 mCVAH: 63.21
• AVWAP from 2025 Hi: 66.70
• Yearly 2025 VWAP: 67.44
• 2025- Mid Range: 66.52
Example Long Trade Idea: Probing Liquidity
Time frame: 1 hour or 30 mins
• Entry: 63.50
• Stop: 62.90
• Target 1: 64.37
• Target 2: 66.70
• Risk: 120 ticks
• Reward: 407 ticks
• Risk/Reward Ratio: 3.4R
Important Notes:
• Note that DOE inventories numbers are scheduled today at 10.30 am ET. Watch your risk amid volatility caused by this economic release.
• These are example trade ideas and not financial advice or recommendations.
• The trade idea considers 2 contracts to calculate risk and reward.
• Traders should conduct independent analysis and ensure proper risk management.
• Stop-loss orders are not guaranteed; slippage may occur, resulting in losses beyond predefined levels.
• AVWAP levels are accurate at the time of posting, they may vary as indicator further calculates prices with new volume and price information.
Glossary Index for all technical terms used:
VAL: Value Area Low
VAH: Value Area High
VP: Volume Profile
AVP: Anchored Volume Profile
C: Composite (prefix before VAL, VAH, VPOC, VP, AVP)
mC: micro-Composite (prefix before VAL, VAH, VPOC, VP, AVP)
AVWAP: Anchored Volume Weighted Average Price
NYMEX:CL1!

Liberation, Altercation & Boom: US China Trade talks CME_MINI:ES1!
Pointing to our previously written blog post (Liberation, Altercation or Doom) on March 31st. A mix of all scenarios played out.
Global universal tariffs with reciprocal tariffs layered on top. It resulted in a huge sell-off on April 2nd.
After months of tit-for-tat tariffs and growing economic friction, the US and China have agreed to hit pause. In a joint statement that’s given markets some breathing room, both countries announced a 90-day suspension on a large portion of their punitive tariffs—an initial step toward dialing back tensions and restarting dialogue.
Key Tariff Measures from US-China Joint Statement (90-Day Pause)
US Tariff Reductions:
Tariffs on Chinese goods were reduced from 145% to 30% for a 90-day period.
24 percentage points suspended, leaving a 10% base tariff in place.
China Tariff Reductions:
Tariffs on US goods reduced from 125% to 10% for the same 90-day period.
China also suspends 24 percentage points of additional ad valorem duties.
Retains a 10% baseline tariff on US imports.
Non-Tariff Measures: China to suspend or remove all non-tariff countermeasures imposed since April 2.
Includes sanctions on certain US companies.
Lifts export controls on some critical minerals.
Timeline & Commitment:
Both parties agree to implement these actions by May 14.
Commitment to continue trade and economic talks through a new bilateral mechanism.
Talks may be held in alternating locations (US/China) or via third-party venues.
No Agreement On:
Currency policy.
E-commerce “de minimis” exemptions.
Sector-specific tariff frameworks.
Future Key Dates and Timeline:
May - Potential US semiconductor tariffs.
May/June - Potential US pharmaceutical tariffs.
July 8th - 90-day tariff lowering for "worst offenders" expires.
July 14th - US tariffs on Mexican agriculture goes into effect.
August 10th - US-China tariff relief expires.
Was this really mutual or just a game of chicken?
There’s an argument to be made that this is more of a tactical pause than a full reconciliation. With China’s GDP in purchasing power parity terms now surpassing that of the US, and its continued technological advancements across sectors like aerospace, semiconductors, and critical minerals, the balance of economic leverage is shifting. For investors, this isn’t just about tariffs—it’s about the evolving structure of global trade.
Geopolitical undercurrents continue to shape the backdrop. China’s strategic influence in regional security, technology supply chains, and commodity access adds another layer to its negotiating position. Recent developments—such as China's reassertion of dominance in strategic corridors and growing control over key mineral exports—suggest its economic posture is becoming more assertive. This, in turn, has implications for US firms dependent on Chinese inputs or facing retaliatory restrictions.
In short, the 90-day window presents a tactical opportunity, but the structural story remains complex. Investors would be wise to monitor not just tariff updates, but broader shifts in trade alliances, export controls, and supply chain vulnerabilities—especially in sectors like tech, energy, and defense-adjacent industries.
ES Futures:
ES Futures and risk on assets are positive across the board following this announcement.
Key Levels:
Key LVN/ Key LIS: 5861-5837.25
200 Day MA: 5872.99
0.786 Fib Retracement level: 5921.75
0.618 Fib Retracement level: 5688.75
pWkHi: 5741
mCVAL 2025: 5639.75
Expectations for the week ahead:
US CPI and Retail Sales data on the docket this week along with slew of FED speakers.
Scenario 1: Risk on
ES Futures get back above 200-day moving average clearing the key LVN resistance zone and our key LIS, head towards 0.786 Fib retracement level before pulling back and consolidating for the remainder of the week.
Example trade:
Entry: 5861
Stop: 5837
Target: 5921.75
Risk: 96 ticks
Reward: 243 ticks
Risk/Reward ratio: 2.5 R
Scenario 2: Further consolidation
Markets consolidate below the key LVN resistance zone and prior weekly high.
Example Trade:
Entry: 5837
Stop: 5861
Target: 5741
Risk: 96 ticks
Reward: 384 ticks
Risk/Reward ratio: 4 R
Glossary:
VA: Value Area
VPOC: Volume Point of Control
VAL: Value Area Low
C: Composite (used as a prefix: VA, VAL, VAH, VPOC, etc.)
mC: micro Composite (used as a prefix: mCVA, mCVAL, etc.)
LNV: Low Volume Node
LIS: Line in Sand
Important Notes:
These are example trade ideas not intended to be a recommendation to trade, and traders are encouraged to do their own analysis and preparation before entering any positions.
Stop losses are not guaranteed to trigger at specified levels, and actual losses may exceed predetermined stop levels.
