ES Futures at a Crossroads: Fed Steady, Market ReadyCME_MINI:ES1!
Recent Market Performance
ES Futures experienced a significant decline of 22.30% from the February 19, 2025 high of 6218.50 to the recent low of 4832 on Monday, April 7th, 2025. This drawdown included a sharp 16.30% sell-off, triggered by the announcement of reciprocal tariffs, marking a decline from the April 2, 2025 high to the April 7th low.
Since forming that low, ES Futures have rebounded impressively—rallying 18.48% into the May 2nd high, retracing well over 50% of the losses. Notably, price action has closely respected Fibonacci retracement levels, as illustrated in the accompanying chart.
Macro Fundamentals
There are several macroeconomic considerations at play:
• Quarterly GDP data appears skewed due to front-loaded imports, evident in the January and February import numbers.
• This week’s March trade balance, imports, and exports data for both the U.S. and China will be crucial. These figures will shed light on how escalating tariff tensions have influenced Q1 business activity.
• The key event this week is the Federal Reserve interest rate decision and FOMC press conference. Of particular interest will be how the Fed’s risk outlook has evolved in light of Trade War 2.0, along with updates to growth and inflation forecasts.
While the Fed is expected to hold rates steady, there are increasing calls from President Trump to cut rates. Although recent soft data has shown signs of deterioration, this has not yet translated into hard data. In fact, April’s Non-Farm Payroll (NFP) report beat expectations, underscoring continued economic resilience.
Key Question: What Comes Next?
Will ES Futures continue to trend higher, reverse lower, or consolidate?
Key Technical Levels
• mCVAL: 5635
• Upper Neutral Zone : 5620 – 5585
• March 2025 Low: 5533.75
• Lower Neutral Zone : 5171.75 – 5150.75
Fibonacci Retracement Levels (2025 High to Low)
• 2025 High: 6218.50
• 0.786 Retracement: 5921.75
• 0.618 Retracement: 5688.75
• 0.5 Level (Mid-Range): 5525.25
• 2025 Low: 4832
Our View
We believe downside risks are currently minimized, barring a new market-moving development—such as a disruptive social media post. Q1 earnings have broadly reflected strength, reducing the probability of further downside in the near term.
Given the current backdrop:
• Positive news could act as a catalyst for higher prices.
• In the absence of significant newsflow, we expect consolidation, followed by a potential resumption of the upward trend.
Scenario 1
A pullback to either the blue support zone near the 0.618 Fibonacci retracement confluence, or a deeper pullback towards the confluence of the 2025 mid-range and March 2025 lows, followed by a continuation higher.
Scenario 2
Seasonality supports consolidation. Historical index behavior at this time of year further aligns with the potential for sideways movement before the next leg higher.
Tradingtips

Candlestick Patterns + Trend and Momentum: A Perfect CombinationCandlestick patterns provide valuable insights into price action, showing potential reversals, continuations, or market indecision. However, to significantly improve their effectiveness, combining candlestick analysis with trend and momentum indicators is essential. Here’s how you can use these combinations to trade with more confidence and accuracy.
1. Why Candlestick Patterns Matter
Candlestick patterns visually represent traders’ psychology through price movements, including four key prices: Open, Close, High, and Low. Some of the most common and useful patterns include:
Doji: Indicates market indecision and potential reversals.
Hammer & Hanging Man: Signals possible trend reversals at support or resistance.
Engulfing Pattern: Often marks the beginning of a significant reversal.
Morning/Evening Star: Combination patterns that strongly suggest a trend reversal.
2. Adding Trend and Momentum Indicators
Candlestick patterns alone might lead to false signals or confusion. By pairing them with other technical tools, such as moving averages, RSI (Relative Strength Index), or MACD (Moving Average Convergence Divergence), you gain crucial context to confirm the reliability of the patterns.
Here’s how:
Trend Alignment:
Using moving averages, such as the 20 or 50-period EMA, helps confirm whether a bullish candlestick pattern appears in an uptrend (strengthening the signal) or countertrend (potentially weaker signal).
Momentum Confirmation:
Oscillators like the RSI or MACD can confirm the underlying momentum behind a candlestick pattern. For instance, a bullish engulfing pattern becomes more reliable if it coincides with RSI moving upward from oversold territory or MACD showing a bullish crossover.
Volume Analysis:
Higher volume on the candle that forms the pattern typically confirms increased market interest and strengthens the validity of the signal.
3. Practical Example: Bullish Engulfing + RSI
Imagine you spot a bullish engulfing pattern forming at a clear support level after a downtrend:
Step 1: Identify the Pattern: Confirm the bullish engulfing visually.
Step 2: Check RSI: Ensure RSI is below 30 or rising, signaling oversold conditions and potential bullish momentum.
4. Why This Approach Works
Enhanced Accuracy: Combining candlestick signals with trend and momentum indicators increases signal reliability.
Improved Risk Management: Clearer signals mean more confident entries and better-defined stop-loss levels.
Reduces False Signals: Multiple confirmations reduce the risk of false breakouts or reversals.
5. Final Tips
Always look for multiple confirmations (trend, momentum, volume) before making trade decisions based solely on candlestick patterns.
Be patient—waiting for full confirmation can help avoid premature trades.
Regularly backtest and practice recognizing these combined signals to strengthen your trading strategy.

The next trade idea for “6B” GBPUSD FX FuturesCME:6B1!
This trade idea is built on very simple premises.
Simplicity in trading is what we all strive for. Where possible, we should aim to simplify our strategies rather than complicate them with excessive information—unless the additional inputs add clear, actionable value to the trade thesis. While that holds true in this analysis, for the sake of clarity and simplicity, we’ve chosen not to include volume profile study or levels derived from volume profiling.
Also, don’t forget to check out how our example trade idea in Crude Oil played out —posted earlier this Tuesday.
6B Weekly Time frame:
Key Levels
Weekly Resistance: 1.3400 – 1.3425
Daily Double Top: 1.3425
April 21 Mid: 1.3350
April 2025 Developing Mid: 1.3067
Scenario 1: Break and Continuation
In this scenario, we anticipate further upside in 6B futures and GBPUSD. A break above the double top at 1.3425 could lead to a push toward 1.3550. Look for confirmation across other FX futures and signs of Dollar weakening to support this thesis.
Example Trade Idea 1:
Entry: 1.3425 (wait for an hourly candle to close above the double top, then enter on the pullback)
Stop: 1.3350
Target: 1.3550
Risk: 75 ticks
Reward: 125 ticks
Risk/Reward Ratio: 1.7 R
Scenario 2: Swing Failure on Weekly Timeframe
Zooming out to the weekly timeframe, 1.3425 aligns with a potential swing failure at prior resistance near 1.3423. A pullback from this level could provide a short opportunity. Watch for Dollar strength and pullbacks in 6E and 6J to further support this thesis.
Example Trade Idea 2:
Entry: 1.3350 (wait for sellers to regain control at Monday’s mid)
Stop: 1.3425
Target: 1.3067
Risk: 75 ticks
Reward: 283 ticks
Risk/Reward Ratio: 3.7 R
Important Notes:
These are example trade ideas provided strictly for educational purposes and should not be considered trade recommendations.
Traders are encouraged to perform their own independent analysis and thorough preparation before entering any positions.
Please note: Stop losses are not guaranteed to execute at specified levels. Actual losses may exceed predetermined stop amounts.

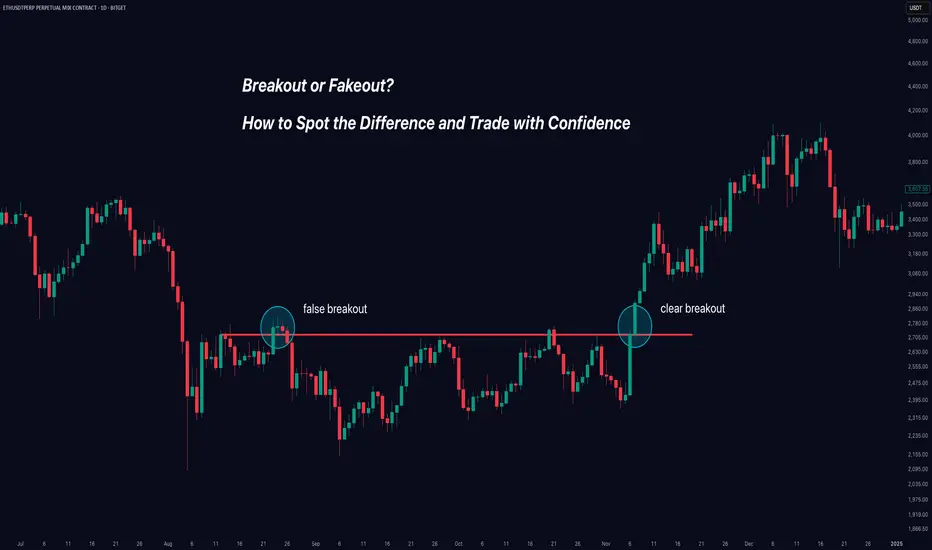
Breakout or Fakeout? How to Spot the Difference and Trade.Trading breakouts can be exciting - and profitable - when they're real. But how do you avoid getting caught in those frustrating false breakouts (fakeouts) that trap many traders?
In this clear and practical guide, you'll learn exactly how to identify genuine breakouts, avoid traps, and improve your trading decisions instantly.
Here's what we'll cover:
✅ Real Breakouts vs Fakeouts: Why it matters.
✅ Market Psychology: Why false breakouts happen.
✅ Volume: Your best friend for spotting authenticity.
✅ Price Structure & Context: When breakouts mean business.
✅ Momentum Confirmation: The hidden indicator that changes everything.
Let’s dive in!
🚩 Real Breakout vs Fakeout: Know the Difference
A breakout occurs when price decisively moves beyond a clear support or resistance level. Imagine Bitcoin breaking above $50,000 or Gold dropping below $1,900.
A fakeout happens when price briefly breaks these key levels—but quickly reverses, leaving traders stuck on the wrong side of the market.
Why it matters: Fakeouts aren't just frustrating—they’re costly. They drain your capital and confidence. Recognizing them early keeps you profitable and disciplined.
🧠 Why Do Fakeouts Happen? (The Psychology)
Fakeouts thrive because traders chase excitement and fear missing out (FOMO). Here’s the secret many traders overlook:
Bull and Bear Traps: Institutional traders deliberately push prices slightly past key levels to trigger stop orders—only to reverse the price sharply.
FOMO-driven trades: Retail traders jump in excitedly at any small breakout, providing fuel for these short-lived moves.
Understanding these tactics can help you stay calm and avoid impulsive entries.
🔥 Volume: The Ultimate Breakout Indicator
Want to know if a breakout is real? Look at volume—it reveals the market’s true intention.
High Volume: Means broad market participation and conviction, supporting a genuine breakout.
Low Volume: A red flag! This signals low market conviction and a higher likelihood of reversal.
Example: If Ethereum breaks above $4,000 with unusually high volume, that's a strong signal. But if volume remains low, beware—it's likely a fakeout.
📐 Context and Price Structure Make a Difference
Not all breakouts are created equal. Pay attention to these key context clues:
Trend Alignment: Breakouts in the direction of a clear existing trend are more reliable.
Significance of Level: Breakouts of major support/resistance levels (weekly or monthly highs/lows) have higher odds of success.
Follow-through and Retests: Genuine breakouts often retest broken levels, turning old resistance into new support.
⚡ Momentum Confirmation: Your Secret Weapon
Momentum indicators (like RSI or MACD) tell you what's happening beneath the surface. They help confirm or reject breakout validity:
Strong Momentum: If indicators confirm the breakout direction, the breakout is more reliable.
Divergence (Warning Sign): If price makes a new high but momentum indicators show lower highs, beware—a fakeout could be near.
Use momentum as your final confirmation step. It’s the missing piece that many traders ignore.
🎯 Quick Breakout Checklist
Use this simple checklist next time you're assessing a breakout:
🚦 Trade Breakouts Wisely: Final Tips
Be Patient: Waiting for breakout confirmation saves you from costly mistakes.
Set Clear Stops: If a breakout fails, exit quickly. Small losses protect your capital.
Scale into Trades: Enter gradually to manage your risk effectively.
Mind Market Context: Always align breakouts with the broader market direction.
Trading breakouts doesn't have to be stressful. When you know what signs to watch for, you trade with confidence—not guesswork.
🚀 Conclusion: Trade Better, Not Harder
Avoiding fakeouts is all about patience, confirmation, and understanding market psychology. By using volume, context, and momentum effectively, you'll greatly improve your breakout trading.
Now, put these strategies into practice. Stop guessing—start confidently trading real breakouts today!
Happy Trading!
Like this post? Follow us for more clear, actionable trading education.
#TradingTips #Breakouts #TechnicalAnalysis #TradingEducation #Crypto #Forex #StockTrading
Why This Bearish Trend Is Actually a Bullish Opportunity?Understanding the Multi Timeframe Analysis – Part 2 of 2
Alright from the prior post we talked about how the corrective move on the 4H timeframe turns out to be a bearish trend on the 1H chart. Now, let’s dive deeper into that 1-hour chart.
In this 1H chart, we can observe a trend shift from bullish to bearish.
Before the red arrow, we can clearly see a bullish structure:
Blue arrows continue to form higher lows, and
Orange arrows form higher highs (except one minor failure, which still maintains the bullish structure because price doesn’t break the previous low).
But everything changes after the red arrow:
Orange arrows fail to create new highs,
Blue arrows start forming lower lows,
→ confirming a bearish reversal on the 1H timeframe.
So… How Can We Use This Bearish Trend as a Bullish Opportunity?
Here's where it gets interesting — instead of seeing the bearish trend as a threat, we use it for better entry with an improved risk-reward ratio.
But here’s the catch – some conditions must be met:
Make sure the bigger timeframe (4H) still supports a bullish trend.
Wait for price to drop lower than the last blue arrow (prior low).
Look for bullish divergence + candlestick confirmation before entering.
Once you get the signal, you can place your stop loss below the confirmation candle to limit your risk.
What If Price Breaks the Orange Arrow (Prior High)?
If price invalidates the bearish structure by breaking the previous high, that means:
The 1H bearish trend is over.
The pullback on 4H timeframe is done.
And price is likely resuming the main bullish trend.
So, whether price goes lower or higher — you’re ready either way.
Alright, that’s my take on using multiple timeframes—hope it helps clear up any confusion you had! Let me know your thoughts in the comments. See you in the next post!

Why This Bearish Trend Is Actually a Bullish Opportunity?Understanding the Multi Timeframe Analysis – Part 1 of 2
Have you ever felt overwhelmed when using multiple timeframes in your analysis? Not sure which timeframes to choose or how to combine them effectively?
In this post, I’ll share my thoughts on how to use multi-timeframe analysis with real chart examples.
Let’s take a look at the movement from the first red and blue arrows – we can clearly see that buyers were not in control at that point. But if we compare it to the next red and blue arrows, it’s clear that buyers took control of the market.
This tells us something important:
➡️ The recent price drop from the last red arrow is likely just a corrective move, not a reversal.
Based on the 4-hour timeframe, we can identify the corrective target zone around 0.5593 - 0.5369.
So what’s next?
In smaller timeframes like the 1-hour chart, this corrective move might appear as a short-term bearish trend. But from a higher timeframe perspective, it’s just a pullback – and that can create an opportunity for a precise entry using a strategy like bottom fishing.
In the next post (Part 2), I’ll show you how this works on the 1-hour chart – including the before and after, and how I plan my entry.
Stay tuned!
Do you usually check the bigger timeframe before taking entries? Let me know your approach in the comments.

Current Mechanics playing out in US and Global MarketsCBOT:ZN1!
COMEX:GC1!
CME:6E1!
CME:6J1!
US Bond Market:
The US bond market—specifically US 10-year Notes—has long been considered a safe haven amid market turmoil. Historically, during periods of uncertainty, investors have flocked to these “flight to safety” assets, resulting in increased demand for US 10-year notes. Mortgage rates also tend to track 10-year note yields, meaning rising yields typically imply rising mortgage rates.
From the chart above, we can observe that ZN futures rose by 6.62% from the January 13 lows to the April 7 highs and what the next possible worst case scenario looks like.
Euro FX Futures:
Euro FX futures rebounded strongly from near-parity levels, climbing to a high of 1.15175—a substantial 12.27% increase versus the USD.
Gold:
Gold futures surged 21.84% from the January 6 lows to the April 11 highs.
What caused investors and market participants to abandon the US dollar and US 10-year notes?
As previously explained, broader macroeconomic forces are at play. Investors are not just pricing in a US recession—they're also reacting to an emerging supply-demand imbalance in the US bond markets. This imbalance is driving safety inflows into gold and other alternative assets, while simultaneously pushing yields higher on the long end of the US yield curve. As a result, the yield curve is steepening.
One noteworthy point: when the 10-year to 2-year yield spread falls below zero, a recession typically follows within 12 to 18 months. After a prolonged period of a negative yield spread during 2024, the yield curve has now steepened sharply.
Additionally, a recent 20% correction in US equities adds another layer of complexity to an already fragile economic outlook. Since the onset of the trade war, both uncertainty and volatility have escalated to extreme levels.
With inflation expectations rising and growth forecasts being revised downward, the most compelling asset class to watch in the coming months is the US dollar—and, specifically, the evolving status of the US 10-year T-Note as a risk haven.
Rising yields may point to further steepening of the yield curve and signal a broader shift away from the US as the global economic leader.
What’s truly at stake is the USD’s reserve currency status. How this unfolds remains anyone’s guess.

How Momentum Divergence Reveals Hidden Market Strength and WeaknMost traders watch price action closely: candlesticks, moving averages, trendlines. But there’s a deeper, less obvious layer of information that often signals shifts in direction before price confirms it: momentum.
📌 Quick overview – what you'll learn:
What momentum divergence is (clearly explained)
How it helps predict potential trend shifts
Practical ways to spot and trade divergences
📈 Price vs Momentum: They're Not the Same!
Momentum doesn't simply track price direction. Instead, it measures the strength behind price movements.
Rising prices, falling momentum often signals upcoming bearish reversals.
Falling prices, rising momentum often hints at bullish reversals building beneath the surface.
These subtle divergences are powerful because they reveal hidden market shifts before everyone else notices them.
⚠️ How to Spot Momentum Divergence (Simple Steps):
Step-by-step:
- Find clear price swings:
Clearly defined highs/lows on your chart.
- Check momentum indicators (RSI, MACD, CCI, etc.):
Does the indicator agree or disagree with the price action?
- Spot divergence:
Bullish divergence: Price makes lower lows, indicator shows higher lows.
Bearish divergence: Price makes higher highs, indicator shows lower highs.
- Confirmation:
Always wait for price confirmation like a reversal candle or break of a trendline.
🔥 Why Momentum Divergence Works:
Divergence highlights hidden accumulation or distribution by smart money.
Helps you anticipate reversals before price confirms.
Filters out weak moves and helps you avoid fake breakouts.
📊 Real Example (XAUUSD – April 2025):
Recently in Gold:
Price was dropping steadily, reaching new lows.
Meanwhile, RSI showed clear higher lows – classic bullish divergence.
Result: Price exploded significantly shortly after momentum divergence appeared clearly.
🧠 Trading Tips to Remember:
Divergence signals are stronger near key support/resistance zones.
Use momentum divergence with your existing strategy for confirmation, not isolation.
Always define your risk clearly (set stops above/below recent highs/lows).
🚩 Common Pitfalls to Avoid:
Trading divergence without confirmation: always wait for the market to show its hand.
Ignoring the bigger picture: check higher timeframes for stronger signals.
Overtrading: not every divergence leads to a reversal; quality beats quantity.
🚀 Your Action Plan for Next Week:
Pick one momentum indicator and identify at least 3 divergences on your favorite assets.
Monitor how they play out.
Note down what works best in your trading journal.
💬 Question for you:
What’s your go-to momentum indicator when spotting divergence? RSI, MACD, CCI, or something else? Drop a comment below!
Happy trading!
TrendGo Team

Is Bitcoin holding up or sell-off coming soon?CME:BTC1!
Surprisingly, the price of bitcoin and bitcoin futures have held up well compared to stocks given that Bitcoin is a high risk, highly volatile crypto currency.
It is almost as if hedge funds, and other investors have not had to liquidate their BTC exposure due to margin calls.
Open Interest has been stable and average daily volume is holding up. This can be viewed by accessing the CME Bitcoin Open Interest and Volume .
What is next for Bitcoin futures?
As noted in our analysis, CME bitcoin futures are currently trading below the key level 2024 mid-range.
Key Levels:
2024 Mid-Range, Key LIS: 79655
2024 till YTD CVPOC: 71705
Support Zone: 63140 - 57275
2024 till YT CVAL: 57275
Scenario 1: Further Downside - technical breakdown
We expect further downside and move towards our support zone marked on the chart. Enter short on a pull back towards mid-range with stops above high of Apr 3rd, 2025.
Example Trade 1:
• Short Entry: 79000
• Stop: 85240
• Target: 60000
• Risk: 6240
• Reward: 22000
• Risk/Reward Ratio: ~ 3R
Scenario 2: Reclaim mid-range and consolidate
In this scenario, if the price gets back above 2024 mid-range and stays above, we expect the price to range between 90K to 80K.
Example Trade 2:
• Long Entry: 80000
• Stop: 74630
• Target: 89000
• Risk: 5370
• Reward: 9000
• Risk/Reward Ratio: ~ 1.68 R
Important Notes:
• These are example trade ideas not intended to be a recommendation to trade, and traders are encouraged to do their own analysis and preparation before entering any positions.
• Stop losses are not guaranteed to trigger at specified levels, and actual losses may exceed predetermined stop levels.
• NFA does not have regulatory oversight over spot cryptocurrencies or virtual currencies derivatives traded on unregulated/decentralized exchanges.
Glossary Index for all technical terms used:
YTD: Year to Date
LIS: Line in Sand
CVPOC: Composite Volume Point of Control
CVAL: Composite Value Area Low
Green Zones: Bull/ Buyers support zones

Paradigm Shift or Panic Selling? ES Futures Weekly PlanCME_MINI:ES1!
Macro Update:
The escalation of reciprocal tariffs and China's countermeasures have sent shockwaves through markets, with widespread selloffs across asset classes, including gold. Fund managers and investors were forced to liquidate positions to cover margin calls. The likelihood of a global recession has surged, with Goldman Sachs raising the probability of a US recession to 45% from 35%. Meanwhile, JPMorgan increased its global and US recession odds to 60%, up from 40%, due to intensifying tariff tensions.
The March 2025 Federal Reserve’s SEP projections suggest slowing growth amid rising inflation concerns, pointing in the right direction. Is this a paradigm shift, or was it already set in motion earlier in the decade? Or is this simply panic selling, with the expectation that US administration policy will soon stabilize markets?
If it is a paradigm shift—as seems more likely based on recent developments—the current environment could prove historic, aligning with Ray Dalio's concepts on the changing world order, debt crises, and how nations go bankrupt.
Investor Confidence: ES futures are currently down over 20%, entering bear market territory for the first time since the 2020 pandemic crash. The big question now is whether we’ll see a relief rally or continued sell-offs with occasional pullbacks, or if markets are establishing a new value range based on auction market principles.
• 2024 YTD mCVAL: 5379.75
• 2022 CVAH: 5376
• March 2025 Low: 5533.75
• August 5th, 2024 Low: 5306.75
• Neutral LVN: 5191.50 - 5156.25
• April 4th, 2025 Low: 5074
• 2024 Yearly Low: 5016.25
• CVPOC 2022: 4610.50
Scenario 1: Further Downside The key downside level for ES Futures is 4610.50, where the most volume has been transacted since 2022. Currently, ES Futures are trading above this level. If the market establishes a value range between 4900 and 4500, further selling with brief pullbacks and consolidation above the 2022 CVPOC seems likely.
Scenario 2: Relief Rally For a rally to take hold, ES Futures faces key resistance levels: the 2024 Low at 5016.25 and the pWeek Low at 5074. If markets sustainably stay above these levels, we could see a rally toward the 2022 CVAH at 5376. However, the sustainability of such a rally remains in question given the mountain of uncertainties ahead.
It is important to note that uncertainty tends to create highly volatile market regimes. Traders should adjust the expected daily range accordingly. A good indicator to measure this is “Daily Average True Range”, many traders also rely on close-to-close standard deviation bands to gauge range on a given trading day. As such, we could see moves of 3% or more in either direction on any day.

Gold Futures: Flight of the PhoenixCOMEX:GC1!
Gold Futures Analysis:
Gold futures are currently presenting a clearer picture compared to equity index futures. Crude oil futures, on the other hand, have already priced in much of the recent tariff news, with a reversal observed from the 2025 mid-range back towards $65. Despite heightened volatility, the WTI crude oil market remains relatively balanced, with bearish sentiment materializing, if prices drop below and stay below the $65 mark.
Gold futures, however, are offering more defined risk-reward opportunities at the moment. Our analysis shows a macro bullish trend in gold, along with price discovery and market auction trends visible on lower timeframes.
On the 4-hour chart below, we observe a rising upward channel, with key levels identified and reasoning for these levels labeled on the chart.
Key Levels:
• ATH: 3201.6
• HVN (High Volume Node) for long entry: 3115
• LVN (Low Volume Node)/LIS for short entry: 3095.1
• Key LVN Support: 3003.7-3018
Scenario 1: Bearish Continuation
If Gold futures stay below the trend line that defines both our long and short trade ideas, the bearish scenario could materialize. For a short trade to be viable, we would look for a close below the LVN/LIS level (3095.1) and enter on a pullback, targeting the major LVN support zone around 3018.0.
Example trade parameters for Scenario 1:
• Entry: 3095.1
• Stop: 3125
• Target: 3018
• Risk: 29.9 points
• Reward : 77.1 points
• Risk to Reward Ratio: RRR=77.1/29.9 ≈2.58
Scenario 2: Bullish Reversal
In the event that Gold futures push back towards all-time highs due to heightened uncertainty and a flight to safety, we expect initial profit-taking by shorter timeframe traders to provide a pullback. This could present a long opportunity towards the all-time highs.
Example trade parameters for Scenario 2:
• Entry: 3115
• Stop: 3095
• Target: 3200
• Risk : 20 points
• Reward : 85 points
• Risk-to-Reward Ratio: RRR= 85/20 = 4.25
Important Notes:
• These are example trade ideas, and traders are encouraged to do their own analysis and preparation before entering any positions.
• Stop losses are not guaranteed to trigger at specified levels, and actual losses may exceed predetermined stop levels.

Liberation, Altercation or Doom? ES Futures weekly planCME_MINI:ES1!
Quick Update
The upcoming week is poised to be critical for financial markets as President Donald Trump's so-called "Liberation Day" on April 2 approaches. On this date, the administration plans to implement new tariffs aimed at reducing the U.S. trade deficit by imposing reciprocal duties on imports from various countries.
As April 2 looms, the full impact of these tariffs remains uncertain, leaving markets and investors in a state of heightened anticipation.
We may get clarity on the tariff situation on April 2, 2025.
Universal tariff announcement of categories of imports may clarify US administration’s maximum tariff escalation approach.
A phased out and unclear tariff approach may keep markets in limbo.
Economic Calendar
Keep an eye on the data docket, NFP and other key releases are due this week.
Tuesday, Apri 1, 2025 : ISM Manufacturing PMI, JOLTS Job Openings
Wednesday April 2, 2025 : ADP Employment Change, Factory Orders MoM
Thursday April 3, 2025 : Balance of Trade, Imports, Exports, ISM Services PMI, Initial Jobless Claims
Friday, April 4, 2025 : Non-Farm Payrolls, Unemployment rate, Average Hourly Earnings MoM,Average Hourly Earnings YoY, Fed Chair Powell Speech
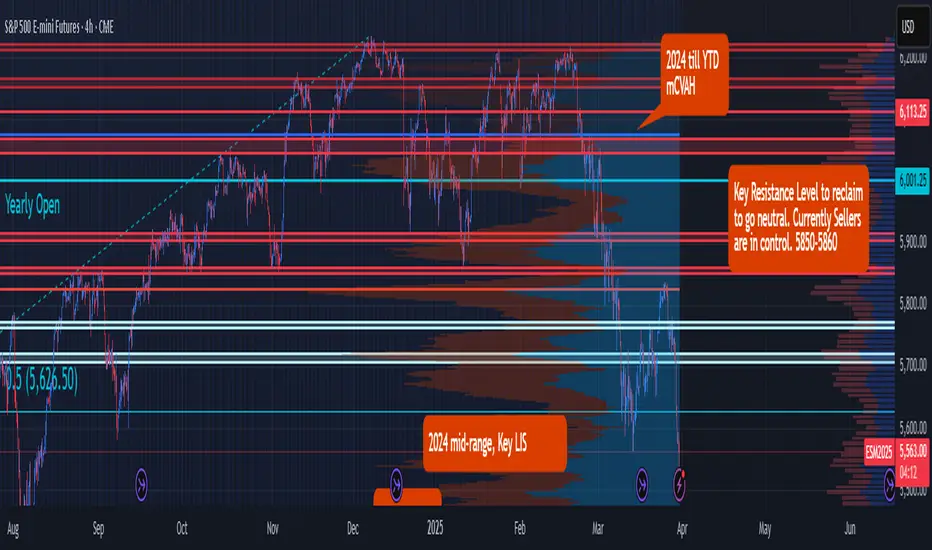
Key Levels to Watch:
Yearly Open 2025 : 6001.25
Key Resistance : 5850- 5860
LVN : 5770 -5760
Neutral Zone : 5705-5720
Key LIS Mid Range 2024 : 5626.50
2024-YTD mCVAL : 5381
2022 CVAH : 5349.75
August 5th, 2024 Low : 5306.75
Scenario 1: Bold but Strategic Tariffs (Effective Use of Tariff to reduce trade deficit and raise revenue) : In this scenario, we may see relief rally in ES futures, price reclaiming 2024 mid-range with a move higher towards key resistance level.
Scenario 2: Maximum pressure, maximum tariff (All out trade war) : In this scenario, we anticipate a sell-off with major support levels, such as 2024- YTD mCVAL, 2022 CVAH and August 5th, 2024 low as immediate downside targets.
Scenario 3: Further delays in Tariff policy (A negotiating tool, with looming uncertainty) : In this scenario, sellers remain in control and uncertainty persists, while we anticipate that rallies may be sold, market price action may remain choppy and range bound.
Trading tipOne solid trading tip: Stick to your risk management plan.
Never risk more than 1-2% of your trading capital on a single trade. Even if you're confident in a setup, the market can be unpredictable. Protect your downside first—profits will follow.

123 Quick Learn Trading Tips #4: Spot or Futures? Real or Fake?123 Quick Learn Trading Tips #4: Spot or Futures? Real or Fake? 🧐
News : $1.3 Billion has been liquidated 💥 from the FUTURES market within the past 24 hours, as Bitcoin plummeted to $86,000. 📉
Futures leveraged traders were forced to close their positions, realizing a collective loss of $1.3 Billion.
This shows how risky trading with leverage (borrowed money) can be. 💸 ⚠️
Traders who use leverage enter into a gambling game with exchanges, which always win the game. In other words, in the last 24 hours, several crypto exchanges made $1.3 billion in profits.
On the other hand, people who bought Bitcoin directly (spot market) only lost a small amount of profit. This shows that owning the actual asset is more stable. 💎
Traders using leverage lose their money. But for spot investors, this is a good chance to buy more Bitcoin at a low price and make their long-term position stronger. 💰
Like I always tell my students and friends:
Let's go up the spot market stairs, step by step. 🪜 Don't think about the futures elevator. 🏢 It has crashed many times, 📉 and it will crash again. ⚠️
Instead of gambling in the "fake" futures game,
invest your money in the "real" spot market. 💎
Build your investments by owning assets, not by risky leverage. 🚫
Have a nice trading journey!

Harsh Truth About Forex & Gold Trading: In Books VS In Reality
Most traders start their trading journey by studying theory first, reading books or taking video courses before putting these newfound skills into practice. But once they start trading on a real market, they quickly realize that things are not as straightforward as the books make them out to be.
In this educational article, we will take a critical look at the difference between theoretical knowledge and practical experience.
📍And first of all, do not get me wrong. I am not trying to imply that trading books or courses are bad.
Theoretical knowledge is essential for successful trading, and of course the books are the best source of that.
The problem is, however, that books can be misleading . The examples in books are always tailored. When the authors are looking for the examples of the patterns, of key levels, they are looking for the ideal cases.
📍The problem becomes even worse, when one start studying the trade examples in books. And of course, the authors choose the brilliant winning trades with huge take profits and tiny stop losses.
I guess you saw these pictures of "sniper" entry trades with 5/1 R/R.
The inexperienced trader may start thinking that the markets are perfect and act in total accordance with the books.
That all the trades that he will take will bring tremendous profits.
That the identified patterns will work exactly as it was described.
📍The harsh truth is that books and courses are simply the compositions of different examples, cases and market situations.
In reality, each and every trading setup is unique .
The reaction of the price to the same pattern will be always different .
Please, realize the fact that books are only good for acquiring the knowledge. But in order to survive on financial markets, you need the experience . And the experience will be gained only after studying thousands of real market examples in real time.
📍Here is the example of a double top pattern that we were trading with my students on AUDJPY.
In books, double tops are always perfect . Once the market breaks the neckline, the price retests that and then quickly drops.
So the one can set a tiny stop loss and a big take profit.
However, after a retest of a broken neckline, AUDJPY bounced and the market maker was stop hunting the newbies. Our stop loss was way above the head, and we managed to survive.
Even though the pattern triggered a bearish movement, the reaction of the market was far from perfect.
Be prepared, that the market will much different from what you see in the books.
Good luck to you!
❤️Please, support my work with like, thank you!❤️

Overtrading Chaos: Classroom Insights & Quick FixesWatching my students get caught up in the whirlwind of overtrading was like watching a rollercoaster ride gone wrong - all that excitement turned into stress, quick decisions based on gut feelings rather than strategy, and seeing their accounts shrink before my eyes. Here's what I've noticed firsthand:
-Emotion Over Logic: They were making choices fueled by the fear of missing out or trying to get back at the market after a loss, not because it was the smart move. Spot on. Emotional trading is the quickest path to financial ruin. It's all about managing those emotions.
-Exhaustion: The constant screen time was draining them, both physically and mentally. This is why I always preach about the importance of having a life outside of trading. Burnout is real and it clouds judgment.
-Costly Habits: Those small fees and spreads started adding up, eating away at their profits with each impulsive trade. Always remember, every trade has a cost. Overtrading is like death by a thousand cuts.
But here’s the good news - I've got some immediate steps I take to turn things around:
1)Trade Log Love: I get them to write down every trade, focusing on the reasons behind their decisions. It’s amazing how this simple act helps them learn from their actions. A trade log isn't just about accountability; it's about education. Every trade is a lesson.
2)Take a Breather: I enforce a little break after each trade. It's like hitting the reset button for your brain, ensuring the next trade isn't just a reaction to the last. This is critical. It’s about breaking the cycle of reactive trading. Think of it as forced discipline.
3)Quality Time: I shift the focus to waiting for those golden opportunities, teaching them that sometimes the best trade is the one you don't make. Patience in trading is not just a virtue; it's a strategy. The markets reward those who wait for the right moment.
Come join me as I navigate through the overtrading storm, helping my students, and maybe you too, become more thoughtful, strategic traders! This is what I call practical wisdom. Overtrading is a symptom of not having a solid plan. I'd recommend this course of action to any trader looking to turn their habits around.
Kris/Mindbloome Exchange
Trade Smarter Live Better

To fade or not to trade? (Example: EUR/USD)There is a correction taking place in the US dollar uptrend. Do we trade against the prevailing trend, or sit on our hands and do nothing? To fade or not to trade, that is the question.
On a surface level, the current environment is a trading range - following a long downtrend.
When a strong major trend has been in place for around 3 months - sometimes sooner - sometimes later (we have observed 3 months as a good benchmark) something has to change - either there is a significant correction or the trend reverses.
The challenge lies in distinguishing between the two. Reacting too early risks fighting momentum, while reacting too late means missing an opportunity.
After years of trading, I’ve realised the goal is not to guess – but to follow a structured trading system that tilts the odds in our favor. The system doesn’t work every time of course but it gives you a way to approach the market.
Let me outline now - a system using Fractals & the 30-Week Moving Average to help you decide which way to trade the market
1. Identify the Primary Trend
Use the 30-week moving average (30 WMA) as the trend filter.
Uptrend: Price is consistently above the 30 WMA, and the slope is rising.
Downtrend: Price is consistently below the 30 WMA, and the slope is falling.
A strong trend remains in place as long as price respects the 30 WMA. A violation suggests a shift is possible.
2. Look for Fractal Confirmation of a Shift
In an uptrend, a higher low followed by a higher high confirms continuation.
In a downtrend, a lower high followed by a lower low confirms continuation.
* The key fractal to watch for a potential bottom after a downtrend – is the first higher low after a downtrend correction that made a higher high (potential bottom)
* The key fractal to watch for a potential top after an uptrend – is the first lower high after an uptrend correction that made a lower low (potential reversal)
So, how about what’s happening now?
The weekly chart shows a base has formed at 1.02 in EUR/USD.
Price closed last week right at support-turned-resistance around 1.05.
A ‘higher high’ was formed followed by a ‘higher low’ as demonstrated by the green and red fractals accordingly.
However, the price remains below the 30-week moving average.
We can see the setup better on the daily chart as a shallow downtrend line.
The pattern beneath the trendline is a messy inverse head and shoulders. As such, should the trendline break to the upside it is a bullish signal. And if the trendline holds, it signals the trend is still just consolidating before a continuation lower.
We think there’s a good chance this trendline breaks given the alignment of the weekly fractals.
So fade the downtrend or ignore the move upwards?
To answer that it helps to think about the next step. If the price does break higher, how high is it likely to go? There is resistance at 1.06 from the late November and December peaks. Then the 50% Fibonacci retracement and the 30-week moving average come in around 1.07.
The reason fading a trend has a lower probability of success vs trading with the trend is because there is so much nearby resistance (in the case of trading a bottom).
You can absolutely fade this trend but our experience tells us the price often fails at a nearby resistance level, capping the risk:reward potential on long positions- and simultaneously offering a nice opportunity for short positions.
But - as always - that’s just how the team and I are seeing things, what do you think?
Share your ideas with us - OR - send us a request!
Drop us a comment!
cheers!
Jasper

123 Quick Learn Trading Tips #3: Better turn up the heat123 Quick Learn Trading Tips #3: Better turn up the heat 🔥
Ever wonder why some traders seem to have all the luck? 🤔 They're not just lucky; they've built an iceberg of hard work, discipline, and even failures beneath the surface of their "success." Don't just chase the tip – build your own solid foundation.
Here's what that iceberg looks like in trading:
Hard work: 📚 Studying markets, developing strategies, and always practicing. No shortcuts here! 🚫
Patience: ⏳ Giving up short-term gains for long-term strategies. Don't rush. Good traders wait for the best opportunities.
Risks: 🎲 Take smart trades, not reckless ones. Be brave, but not foolish.
Discipline: 🎯 Follow your trading plan. Don't let your feelings make you change it. Trust what you learned before. Trust your strategy.
Failures: 🤕 Everyone loses money sometimes. Learn from your losses. It's important to get back up and keep going.
Doubts: 😟 Managing emotions and fear is crucial. It's normal to have doubts.
Changes: 🔄 The market always changes. You need to change your strategies too. Be ready to adapt.
Helpful habits: 📈 Consistent analysis and risk management are your bread and butter. Stick to good routines.
Want to build a success iceberg? 🧊
Better turn up the heat 🔥
– it's going to be a long, cold journey beneath the surface.
👨💼 Navid Jafarian
So, stop scrolling through my TESLA pics 🚗 and get back to analyzing those charts! 📊 Your iceberg isn't going to build itself. 😉

Trendline Flip: Bullish Setup for SUI/USDTSUI/USDT is finding strong support at the trendline, which has now flipped from resistance to support. This trendline, previously acting as a key resistance, has been successfully retested after the breakout, confirming its role as a new support level.
Additionally, the price is holding above the key supply and demand zone, further strengthening the bullish outlook. If this support holds, we could see a potential upward move as bullish momentum builds from this critical level.
DYOR, NFA

Is Tata Motors Ready for a Bullish Reversal?Timeframe: Daily
Tata Motors (NSE) has been in an expanded flat correction pattern for the past 11 months. In this pattern, the highest high (HH) was 1179, and the lowest low (LL) was 683.2. Currently, the price is trading below the 200, 100, and 50 EMA levels, indicating a bearish trend.
In this expanded flat correction:
Wave (A) completed at 855.4,
Wave (B) peaked at 1179,
Sub-wave 4 of Wave (C) touched 786.65,
Sub-wave 5 is now unfolding.
Once Wave 5 is completed, traders can look for buying opportunities with target levels at 799 – 951 – 1050+. First, it’s crucial to identify the end of Wave (C) to confirm the correction’s completion and a bullish reversal.
Projecting ending point of wave (C):
Wave (C) may end at 2.618% of Wave (A) around 628.7.
Wave 5 has multiple potential targets/support levels:
0.618 extension of Wave 1 at 526,
0.382 extension of Wave 1 at 628,
1.618 reverse Fibonacci of Wave 4 at 657,
2.618 reverse Fibonacci of Wave 4 at 562.
We will update further information soon.

123 Quick Learn Trading Tips #2: Stay Cool, Trade Smart🎯 123 Quick Learn Trading Tips #2: Stay Cool, Trade Smart
"Don't let anger empty your pockets. Trade with a cool head."
Navid Jafarian
❓ Ever get mad when you lose a game?
❓ Want to try again and win RIGHT AWAY?
Trading can feel like that, but with real money. It's easy to blame losses on things you can't control, like the news or bad luck.
✅ Truth is, everyone loses sometimes in trading. The best traders don't get angry. They learn from their mistakes and move on.💪
‼️ Don't try to "get even" with the market after a loss. That's how you lose even more!
🗝 Take charge, learn, and make the next trade better.
❗️Remember:
The best traders stay calm and focused. Just like a pro!

Scalp Like a Pro: 5-Minute Trades for Big Wins in Micro-TradingMorning Trading Fam
I'm sharing how I use just price action and candlesticks for my scalping strategy. We'll look at where to enter and exit trades super fast. Perfect for beginners or to refine your skills. Let's get into it with our TradingView setups. Like, Boost, Follow and Share is much appreciated.
Kris/Mindbloome Exchange
Trade What You See

Netflix Eyes $1,200: Can It Break Key Levels to Soar Higher?Good morning, trading family!
Netflix (NFLX) is looking exciting right now, and here’s what I’m watching:
-If we drop below $973, we might see $950 support come into play.
-But if we break above $991, there’s potential for a rally to $1,055 and higher—with $1,200 as the ultimate goal.
Big moves could be coming, so keep these levels on your radar!
If this analysis helped you, I’d love to hear your thoughts. Drop a comment, give it a like, or share with others. Let’s trade smarter and live better!
Kris/Mindbloome Exchange
Trade What You See
