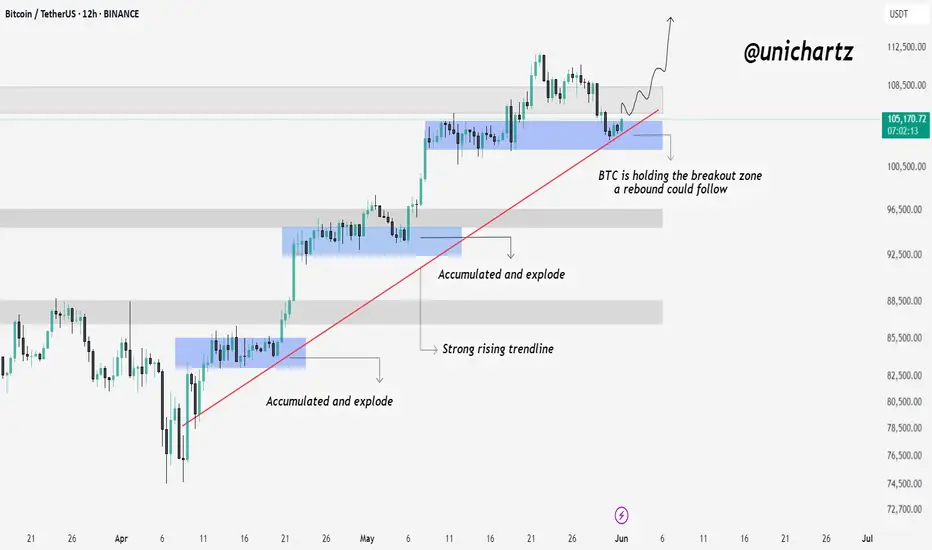
Bitcoin Retests Breakout Zone – Will It Bounce Again?Hello traders, here is the Quick CRYPTOCAP:BTC update
Bitcoin is currently holding right at the previous breakout zone, which also aligns with the rising trendline and previous accumulation area.
This zone has acted as a strong launchpad in the past — where BTC accumulated and exploded higher. If buyers defend this level again, we could see another rebound play out from here.
As long as BTC holds this structure, the bullish trend remains intact.
Tradingview
Etherium Trading Idea, Also for BTC and AltcoinsHello again.
We have some speaking about the price movement and about this pattern formation that I call BAT with WINGS , or Flying BAT .
- I hope you will find something useful in this Trading Idea.
Thank you, Have a nice day.

Using Previous Day’s High and Low to Decide Intraday TrendIntroduction and Disclaimer
This article explains how to use the daily chart to understand and plan for short-term or intraday market direction.
To fully understand this, you should already know what directional bias means. If you’re not familiar with it, I highly recommend reading my previous article on the topic before continuing here.
Disclaimer
I'm not a financial advisor.
This article does not offer financial, investment, legal, or any kind of regulated advice.
It's made for educational and entertainment purposes only.
Trading involves risk. You can lose all your money—or even more—if you’re not careful.
You're reading the thoughts of a 22-year-old.
The goal of this article is to show you how to use the previous day’s high and low on a daily chart to:
Get a clear intraday bias (bullish or bearish).
Find entry signals for your trades.
Set clear invalidation points, meaning when a trade idea becomes invalid.
This is part of what’s called multi-timeframe analysis—looking at higher time frames to understand what might happen on lower ones.
Even if you trade short-term (like on 5 or 15-minute charts), it's still helpful to know what the bigger picture (like the daily chart) looks like. Why? Because it shows the main trend, important levels, and key zones that may not appear on lower time frames.
In my opinion, smart trading involves breaking down the price chart from top to bottom—starting with the big picture—then making decisions based on your trading strategy.
The ideas in this article work well for:
Intraday traders who want to capture moves during the day, and
Swing traders who want to catch bigger moves by entering early.
This concept can also be applied to higher time frames, such as the previous week’s high and low.

ETH's situation+ Target PredictionCurrently, ETH is forming an ascending triangle and cup and handle, indicating a potential price increase. It is anticipated that the price could rise, aligning with the projected price movement (AB=CD).
Continued strength could lead to upward movement toward targets at $2700, $2900, and $3.100
However, it is crucial to wait for the triangle to break before taking any action.
Give me some energy !!
✨We spend hours finding potential opportunities and writing useful ideas, we would be happy if you support us.
Best regards CobraVanguard.💚
_ _ _ _ __ _ _ _ _ _ _ _ _ _ _ _ _ _ _ _ _ _ _ _ _ _ _ _ _ _ _ _
✅Thank you, and for more ideas, hit ❤️Like❤️ and 🌟Follow🌟!
⚠️Things can change...
The markets are always changing and even with all these signals, the market changes tend to be strong and fast!!

BTCUSD HTF cycle analysis
Hi, I’m from Phoenix FX, and today I’ll be sharing my perspective on Bitcoin (BTC) price action based on the higher timeframes.
I’ll also give you my outlook on potential trade setups for today and tomorrow. Please remember that this is not financial advice—use this information as a guide only. If you find it helpful, don’t forget to like and share it with your like-minded communities.
Higher Timeframe Analysis
In my view, BTC tends to follow clear bullish and bearish cycle zones. Typically, we see a pump to new all-time highs (ATH), followed by the formation of resistance and a retracement down to a key support level. Our trading approach focuses on identifying those critical support and resistance levels, with some interim trades based on shorter-term analysis—occasionally even counter-trend, depending on the day’s market bias.
Over the past eight years, BTC has respected a major trend resistance line. The most recent ATH, around $112K, reconfirmed the relevance of this trendline. This makes it a valuable tool for projecting future ATH levels.
Looking ahead, I expect a move towards the $115K level in the coming weeks. This would likely act as a point of resistance, at which stage we might see a reversal and a drop back down to a key support zone.
Trade Setup
The chart I'm referencing highlights what I would consider the first premium buy zone, identified using a 4-hour Fair Value Gap (FVG).
The 50% level of this zone sits at $99,450. If this zone fails to hold, we may drop further to the secondary premium buy zone, which aligns with our higher timeframe (HTF) trend support and a weekly FVG. The 50% level of this deeper zone is around $89,150.
A potential long entry at $92,550, with a stop loss around $88,000, offers an excellent risk-to-reward (RR) ratio, targeting a move up to the $115K level.
Intraday Outlook
For today, I see bearish price action, with potential rejection around the $104,300–$105,000 range. Go short around the $104,750 to $105,000 zone
This could lead to a move down toward the lower key zones highlighted in the HTF analysis.
I recommend taking partial profits (TP) at every $1,000 increment and setting your stop loss to breakeven (BE) after hitting the first target.
Final Thoughts
Price action analysis is always subjective, so I’d love to hear your thoughts and ideas in the comments—each one, teach one.
Thanks for giving me some of your time.
From the Phoenix FX team, have a great weekend!

Skeptic | Bitcoin Weekly Recap #15 Bull Run On? Altcoin Next?Hey everyone, Skeptic here! Bitcoin’s been throwing curveballs this past week—did it leave you spinning? 😵 Still unsure if the bull run’s officially on, or hunting for the perfect altcoin entry? Don’t worry, in this recap, I’m laying it all out with clear reasoning to give you a crystal-clear view of the market and help you ditch those FOMO-driven decisions. Here at Skeptic Lab , we analyze Markets with one motto: No FOMO. No hype. Just reason. We’re not like others who panic over dumps or hype every pump—we’ve got risk management , stop losses , and we stay glued to the market’s pulse. Let’s dive into the Bitcoin Weekly Recap and unpack it all! 📊
Monthly Timeframe: The Big Picture
Let’s zoom out to the last three months. The 74,000 to 82,000 range has been a rock-solid support zone for Bitcoin, with heavy shadows every time we touch it. Big shadows like that scream potential trend reversal, and right now, Bitcoin’s major trend is firmly uptrend. Until we see a clear signal for a trend change, all that noise about Bitcoin crashing to 50K or “the bull run’s over” is pure nonsense. If you hear anyone making those bold future price predictions, run the other way! Our job isn’t to predict the future—it’s to map out scenarios and have a plan when they play out. Comparing the 2022 bear market to now is flat-out silly. Why? Back then, we’d already seen massive gains, but now, we haven’t had significant growth yet—altcoins are quiet, and total market volume hasn’t spiked. The end of a trend isn’t when everyone’s scared of losses; it’s when everyone’s dreaming of becoming a millionaire and the news is pumping FOMO. 😄 So, ignore those baseless analyses and let’s get to the real stuff.
Weekly Timeframe: Momentum Check
On the weekly chart, we kicked off a solid uptrend momentum, even hitting a new all-time high. Bears tried to jump in and sell, but here’s the catch: the previous ceiling hasn’t been technically broken yet, so we haven’t gotten a clear buy signal. Why? Because support and resistance levels aren’t static—they shift over time. The longer time passes, the higher or lower these levels move, and they need updating. Right now, we got rejected after testing the ceiling because our true resistance is still intact. So, when do we get confirmation? Let’s drop to the Daily Timeframe for clarity.
Daily Timeframe: Spot Trigger
After breaking 112,000 , we’ll get the main confirmation that the last ceiling before the correction is broken, signaling the continuation of the major uptrend per Dow Theory. That’s our spot buy trigger—buy above 112,000 with a stop loss below 100,000 , giving you a 10% stop loss size. Please, manage your capital so that if you hit the stop loss, you lose no more than 3% of your total capital. Staying alive in financial markets hinges on risk management. Now, let’s hit the 4-Hour Timeframe for long and short triggers.
4-Hour Timeframe: Long & Short Setups
We had a solid upward trendline on the 4-hour chart, but it broke to the downside. When this happens, two scenarios are possible: either the uptrend’s slope has just softened with no trend change, or we’re entering a correction. My take? We’re likely heading for a time-based correction (think range-bound boxes). If we start ranging, don’t beat yourself up or pile into trades impulsively—win rates for most traders tank in range phases, and losing streaks pile up. For long positions, I suggest waiting for a break above 108,900 . That’s where we got a strong rejection and pullback last time, so we need solid confirmation to go long since bearish momentum is stronger in this phase. For shorts, 105,000 was a good level, but the next short trigger is a break below support at 101,577 . If we see a strong reaction at any level on this timeframe before that, you could short on a break there too. For breakout confirmation, indicators like SMA or RSI work, but volume is king. High volume on a break means it’s likely to continue; low volume screams fake breakout, so cut your risk there.
Bitcoin Dominance (BTC.D): Altcoin Timing
Let’s wrap up with a quick look at BTC.D to figure out if it’s time to jump into altcoins. BTC.D shows Bitcoin’s share of the total crypto market cap—the higher it is, the more liquidity flows into Bitcoin, often from altcoin sales. On the daily chart, we’re still above an upward trendline I mentioned in previous analyses, and altcoins haven’t made any real moves. When I say “moves,” I mean serious 100-500% or even 10,000% rallies , not just 10-20% pops. An altseason would be confirmed by a break of this trendline and a drop below support at 60.27. That’s when we’d expect massive altcoin gains, but it only works if Bitcoin’s already in a strong uptrend with solid market liquidity. Otherwise, don’t expect crazy altcoin pumps. The total market cap needs to be growing too for this to happen.
💬 Let’s Talk!
If this recap sparked some ideas, give it a quick boost—it means a lot! 😊 Got a pair or setup you want me to tackle next? Drop it in the comments. Thanks for joining me at Skeptic Lab—let’s grow together with No FOMO. No hype. Just reason. Keep trading smart! <3✌️

Bitcoin Cash Respects Trendline Again – Is Another Rally LoadingBitcoin Cash is showing strong trendline respect, with multiple successful bounces from the ascending support.
Price is once again bouncing off this trendline, signaling bullish intent. As long as this structure holds, the uptrend remains intact and a potential move toward higher levels looks likely.
Key support and trendline confluence continues to act as a launchpad.

Bitcoin Correction or Trap? Watch This Support Zone CloselyExclusive #Bitcoin Update
I got lots of DMs, people are asking:
Do you think the bull trend is finished, or is it just a correction and pullback?
Guys, first stop panicking.
This is exactly what the shark wants you to do. Don’t let them shake you out.
Let’s get to the chart:
My previous chart got invalidated, and the current situation is that CRYPTOCAP:BTC is defending strongly around the $104.8K to $104.3K support zone.
According to the FIB level, we’re currently at the 0.383 level. This area has previously served as strong resistance, so it can now function as effective support.
If bulls manage to bounce from this area and push above $107K, we could trigger a sharp move toward the $112K–$113K liquidation zone,
where we have almost $12B in short liquidations acting as a strong magnet!
Let's talk about the worst-case scenario, in case we break down below this supportive area, then we have
200 EMA and a strong support around $101.4k to $101.8k.
I’ll keep you posted as things unfold. If you find my updates helpful, don’t forget to like and follow for more! #Bitcoin2025
CRYPTOCAP:BTC BITSTAMP:BTCUSD BINANCE:BTCUSDT

Altseason Isn’t Over – It’s Just Getting Started !!It’s not the end of #Altcoins this is just a small dip before the big move. 🚀
Right now, all EMAs (50, 100, 200) are sitting at the same level. This is acting as very strong support around the $1.12T zone.
Price has bounced from this area before, and if it holds again, we could see a big breakout toward $1.28T+.
Altseason isn’t over. It’s loading.
Be ready. 👀
#TOTAL2 #Altseason2025

TradeCityPro | Comprehensive Bitcoin Analysis for 2025👋 Welcome to TradeCityPro Channel!
Let's go for the most complete BINANCE:BTCUSDT Bitcoin analysis you can see. In this analysis, we are going to examine the data from monthly to weekly to daily time frames and more in the most complete way possible!
🌐 Monthly Timeframe
In the monthly timeframe, as you can see, Bitcoin is positioned between two curved trendlines and has reacted to these zones multiple times.
The last time the price hit the bottom of this channel, it recorded a low of 16,000, after which the crypto bull run began. The top of this channel also coincided with the 69,000 peak in the previous bull run, allowing us to identify the end of that bull run.
One key point about this channel is that the slope of its trendlines is decreasing, and overall, a weakening trend in Bitcoin is observed, which is logical. This is because every time Bitcoin has made an upward leg, a massive amount of capital has flowed into it, so it naturally moves less in the subsequent leg.
This point might seem negative to newer market participants, as Bitcoin’s bull runs used to happen faster in the past, and the price moved more significantly in percentage terms. For example, the 2017 bull run saw Bitcoin grow by nearly 7,000%, while in the 2019 bull run, it grew by about 1,500%.
However, within this seemingly negative point, there’s a positive aspect: this reduction in volatility indicates Bitcoin’s maturity and that of the broader crypto market. When an asset has a large amount of capital invested in it, its volatility naturally decreases, but this also reduces the risk of investing in that asset.
For instance, gold currently holds the top spot globally with a market cap of 21 trillion dollars, while Bitcoin’s market cap is around 2 trillion dollars. This gap makes Bitcoin appear as a better investment choice at first glance, as its lower market cap suggests greater growth potential.
On the other hand, the risk of investing in Bitcoin is higher because it has less capital invested in it, and large institutions like governments prefer to invest in gold, earning lower returns over time compared to Bitcoin. For these institutions, the most important factor is risk optimization, and gold has proven itself as the lowest-risk asset over centuries.
So, overall, we can conclude that the more capital flows into Bitcoin, the lower its volatility becomes. As volatility decreases, it becomes a safer asset for investment, attracting more interest from large institutions.
Additionally, we should consider that if Bitcoin isn’t destroyed or proven to be a scam, it could become a safe-haven asset like gold in the future. Its supply is well-optimized, and due to the halving mechanism, its issuance is tightly controlled, which gives it an inherently bullish nature like gold.
Note that when I say Bitcoin’s movements are slowing down and more capital inflow reduces its volatility, I don’t mean it will stop moving upward. Rather, it means its cycles will take longer, and its movements will be heavier. For example, gold, despite its high market cap, still moved upward last year.
Currently, Bitcoin has started a new upward leg after rising from the 16,000 zone. It first reached the previous high, then, after reacting to the 0.5 Fibonacci Extension level (which overlapped with the 71,000 zone), it pulled back to the 57,000 zone and has now moved to the 0.618 level near 101,000.
Based on the candles formed in the monthly timeframe, it seems the upward movement is ongoing. If the 0.618 level is broken, the price could see a few more bullish candles. The next Fibonacci level is 0.786, near 165,000, and if the price movement extends a bit longer, this level could also overlap with the top of the curved channel.
In my opinion, the maximum potential for Bitcoin in this bullish cycle is between 160,000 and 180,000. However, keep in mind that this is just my personal view, and I’m not making decisions based solely on this analysis or planning to sell if Bitcoin reaches this range. This is merely a mental target, and if I see Bitcoin reaching this range with strong bullish momentum, there’s a chance it could break through.
In that scenario, if Bitcoin reaches this range without any trend weakness and with high momentum, I’ll update the analysis for you and examine higher targets Bitcoin could reach.
On the other hand, if I see Bitcoin’s momentum weakening and showing trend deterioration before reaching the resistance zone, I’ll adjust my perspective. If the trend reversal triggers I’ll discuss later are activated, I’ll exit the market.
In the RSI oscillator, we have very important zones that can help us assess the trend’s health. A ceiling at 77.65 has formed, which, if reached by RSI, could indicate a momentum-based market top. However, if this level is broken, the bullish scenario I mentioned is highly likely to occur, and the price could move beyond our expected target.
On the other hand, there’s a support floor at 58.90, and I believe the confirmation of the end of Bitcoin’s bull run will come with a break of this level in RSI. If RSI consolidates below this zone, bullish momentum will weaken, and the price will gradually enter a corrective phase.
Regarding volume, I should note that the decreasing volume in this timeframe isn’t reliable data because Bitcoin’s volume is spread across various exchanges, and comparing volume at this scale isn’t accurate or useful.
I have nothing more to say about the monthly timeframe. Let’s move to lower timeframes.
📊 Weekly Timeframe
Let’s dive into the weekly timeframe, where we can observe price movements in greater detail.
As you can see, after being supported at the 16,000 zone, Bitcoin faced a significant resistance at 31,000. Breaking this level kicked off the bullish trend. In the first leg, the price moved from 16,000 to 31,000, and after breaking 31,000 in the second leg, the upward move continued to 72,000.
One of the main reasons for this bullish cycle was the U.S. interest rate. Simultaneously with the breakout of the 31,000 zone, the U.S. Federal Reserve changed its policies and began lowering interest rates. This triggered a massive capital inflow into Bitcoin, initiating its bullish move.
During the corrective phase, the price oscillated between the 72,000 and 55,000 zones for several months. After breaking the 72,000 ceiling, another bullish leg took the price to 105,000.
One of the reasons for this bullish move was Trump’s strong support for crypto during the U.S. election. He frequently mentioned Bitcoin positively in his speeches and considered it part of his policies.
However, after Trump was elected president, he didn’t fully deliver on his promises. The imposition of tariffs not only impacted Bitcoin but also significantly affected the U.S. dollar, major company stocks, and indices like the S&P. As a result, Bitcoin dropped back to near the 72,000 zone.
Additionally, for the past few months, the U.S. Federal Reserve has not changed interest rates due to these tariffs. In all its statements, it has indicated that it’s waiting for the tariffs to be finalized and is in no rush to make decisions regarding monetary policy. Thus, in recent months, the interest rate variable has been effectively neutral, with the most significant fundamental news being the U.S. tariffs against China and Europe.
After Bitcoin’s drop to near 72,000, news of a 90-day agreement between China and the U.S. emerged, stating that tariffs would be lifted for 90 days to allow negotiations. This news was enough to restart the bullish move for Bitcoin and stocks like the S&P. As you can see, Bitcoin has now surpassed the 105,000 ceiling and is currently deciding its next move above this zone.
Looking at RSI, there’s a key support level at 44.75, where every time the price has hit this level, a new bullish leg has started. This level accurately indicated the 55,000 and 72,000 bottoms and has been very reliable.
However, there’s a clear divergence in RSI between the 72,000 and 105,000 peaks. The current peak above 105,000 is higher, but RSI is still forming lower highs, which could strengthen the divergence.
Currently, RSI is near the overbought zone and appears to be rejecting from the 70 level. If RSI is rejected from this zone, the price might fake out the 105,000 breakout and drop below it. If this happens, it would signal a significant trend weakness, greatly increasing the likelihood of a trend reversal.
However, if RSI consolidates above the 70 level and the price makes another bullish leg, we’ll still have divergence, but the trend weakness will be much less severe than in the fake-out scenario. If the price makes another bullish leg, our targets based on Fibonacci are the 130,000 and 160,000 zones.
In any case, if RSI forms a lower high compared to its previous peak and the price enters a corrective phase, I believe the 44.75 level will break, activating the divergence. If this happens, we’ll get a momentum-based confirmation of the bull run’s end, and we’ll then need to wait for a price-based confirmation.
Currently, the price confirmation for a trend reversal would first be a fake-out of the 105,000 breakout, with the main trigger being a break of the 72,000 level. If the price forms a higher high, we’ll need to wait and identify the trend reversal trigger based on market structure and conditions.
Personally, I believe Bitcoin will have another bullish move to the 130,000 zone, and simultaneously, dominance will move upward again. After this move, as Bitcoin consolidates or corrects, dominance will drop, leading to an altcoin season for a few months. After Bitcoin’s consolidation and the end of the altcoin season, the market’s bearish phase will begin, which I’ll discuss further if it occurs.
If you’ve bought Bitcoin at lower levels and are holding, I think you can continue holding, as there’s a high chance of another bullish leg, and we don’t yet have any confirmation of a trend reversal. I suggest continuing to hold until we get a clear reversal signal.
For buying Bitcoin on the spot market in this timeframe, it’s not possible to provide a trigger right now, as we’re at the end of a bullish leg, and the upward trend from 16,000 has been very prolonged. I believe we’ll see at most one more bullish leg, so if you’re skilled at trading, I suggest using this capital to open positions in futures to maximize profits.
Be cautious—I’m saying this only if you have trading skills, not to blindly open positions with all your capital without a trigger. That would only lead to losses.
If you haven’t bought any Bitcoin in this bullish trend yet, you can wait for the potential altcoin season. I suggest starting now to identify good projects so that when Bitcoin dominance shows bearish confirmation, you can buy the altcoins you’ve researched and profit from that market phase.
📈 Daily Timeframe
In the daily timeframe, as you can see, Bitcoin underwent a corrective phase, dropping to the 76,000 zone. After forming a base at this level, a bullish leg to 106,000 was triggered at 87,700.
Currently, the price is above the 106,000 zone but hasn’t consolidated above it yet. The reason I say it hasn’t consolidated is that market volume is decreasing after the breakout. Additionally, when the price breaks through a supply zone like an all-time high, significant momentum is required, but that hasn’t happened, and the price is ranging above this zone without significant movement.
If Bitcoin consolidates above this zone, the bullish move could continue. The targets we can consider are the 116,000 and 130,000 zones.
The RSI oscillator has a critical support at 59.78, which is a very important momentum level. If this level is broken, this bullish leg could end, and the market might enter a corrective phase. Volume is also slightly decreasing and showing some divergence with the trend, which is another sign of trend weakness.
If the price consolidates below 106,000, we’ll get confirmation of a fake-out of this breakout, and the price could move downward again. The lower support zones are 102,600 and 92,300.
If the price forms a lower high and low below 106,000, we can confirm a trend reversal. Breaking the 76,000 level would be the main confirmation of a trend change.
💼 4-Hour Timeframe
In the 4-hour timeframe, Bitcoin entered a corrective phase after reaching the 111,700 zone and has formed a descending triangle between the 106,000–107,000 range and a downward trendline.
The 106,000–107,000 range is a very strong support zone, and the price has tested this level multiple times but keeps forming lower highs compared to 111,700, increasing the likelihood of breaking this support zone.
On RSI, there’s a support level at 35.94, which is a very strong momentum zone. Breaking this level could confirm the entry of bearish momentum, increasing the likelihood of breaking the support zone.
With a break of the support zone and the 35.94 level in RSI, we can enter a short position. If the price forms a lower high and low below this support zone, we can confirm a trend reversal. The next key support zones are 101,600 and 93,700.
For the bullish trend to continue, breaking the downward trendline would confirm an upward move. If the trendline is broken, the price could rise to 111,700. Breaking the 111,700 level would be the main confirmation of the bullish trend’s continuation, activating the trendline breakout as the primary trigger.
🔍 Binance Open Interest is Surging as BTC Regains Bullish Momentum
Tracking what’s happening in the derivatives market has become essential, given the current market structure.
Derivatives volumes are significantly higher than those on spot markets or ETFs, especially on Binance, which ranks just behind the Chicago Mercantile Exchange in terms of volume.
As a result, derivatives activity can have a major impact on Bitcoin’s price, making on-chain data related to derivatives extremely valuable to monitor.
This has clearly been the case since BTC resumed its bullish trend, reflected in the rising Open Interest on Binance. It jumped from $7.5B on April 8th to over $11.2B today. We can also note that the 30-day and 50-day SMAs have just crossed back above the 100-day average. Derivatives activity has clearly helped fuel the price move, even though many short positions were opened along the way.
Seeing Open Interest climb is generally a good sign, as it gives the market momentum and can lead to strong upward moves. However, this kind of push tends to be fragile.
At the moment, we haven’t yet returned to a new Open Interest ATH on Binance, which may suggest that we’re not in a full-blown euphoric phase on derivatives markets just yet.
📊 Minimal Sell Pressure Despite STH & LTH Deposits on Binance
Keeping an eye on STH (Short-Term Holders) and LTH (Long-Term Holders) behavior gives us valuable clues about market sentiment.
In this update, we’re focusing on Bitcoin inflows to Binance from both STHs and LTHs. These flows help us measure selling pressure and get a feel for how price action might unfold.
Let’s start with STHs the group that tends to react quickly and emotionally to market shifts.
🧠 We’ve seen their behavior play out clearly in the past:
During the August 2024 correction, they sent over 12,000 BTC to Binance.
Then again, around late February to early March, during the tariff news-driven panic that pushed BTC below $80K, they dumped over 14,000 BTC.
But here’s the good news: right now, STH inflows are still moderate only about 8,000 BTC has been sent to Binance so far, which is roughly in line with the last correction.
🔍 As for LTHs, the numbers are even calmer.
Currently, just 86 BTC has flowed in from long-term holders—far lower than the 254 BTC seen before the last major top and way below the 626 BTC peak back in 2024.
📊 Bottom line?
Whether we’re looking at STHs or LTHs, there’s no real sign of strong selling pressure at the moment. Still, it’s worth watching in the context of ongoing demand—which remains relatively healthy for now.
Coinbase Premium Signals Strong Institutional Demand
There’s no doubt institutions are stepping in and no, it’s not just because of ETFs.
💡 Why not ETFs?
Because spot Bitcoin ETFs aren’t exclusive to institutions. Retail investors can access them just as easily, and in terms of raw volume, ETFs still don’t come close to the spot or futures markets.
That said, the inflows are still impressive: the 30-day average daily inflow is now over $330 million, and that trend is holding strong.
🚀 The Real Signal? The Coinbase Premium Gap
This metric tracks the price difference between Coinbase Pro (favored by U.S. professional/institutional investors) and Binance. Right now, the 30-day moving average of the premium gap is 55 a clear sign of heightened U.S. investor activity, which strongly points to institutional participation.
💰 Futures Activity Surges as Spot Demand Fades on Binance
Futures volume on Binance has been rising, while spot volume has dropped significantly in recent days even as Bitcoin broke into price discovery. This shift in volume composition is worth watching closely, as it provides important clues about the market’s internal strength.
Volume isn’t just a number—it reflects the type of demand driving the market. When demand comes from spot markets, it often suggests long-term conviction. In contrast, demand driven by futures markets tends to reflect short-term speculation, which can introduce instability.
Since May 5, we’ve seen futures activity increase modestly, while spot volumes have clearly declined. This suggests that the current price action may be fueled more by leverage and short-term bets than by solid, long-term buying.
Without strong spot support, trends powered by derivatives are more fragile and prone to sharp reversals. This environment calls for increased caution, especially for those considering new entries or leveraged positions.
⚡️ BTC Gains Bullish Momentum as Binance Open Interest Rises
Tracking what’s happening in the derivatives market has become essential, given the current market structure.
Derivatives volumes are significantly higher than those on spot markets or ETFs, especially on Binance, which ranks just behind the Chicago Mercantile Exchange in terms of volume.
As a result, derivatives activity can have a major impact on Bitcoin’s price, making on-chain data related to derivatives extremely valuable to monitor.
This has clearly been the case since BTC resumed its bullish trend, reflected in the rising Open Interest on Binance. It jumped from $7.5B on April 8th to over $11.2B today. We can also note that the 30-day and 50-day SMAs have just crossed back above the 100-day average. Derivatives activity has clearly helped fuel the price move, even though many short positions were opened along the way.
Seeing Open Interest climb is generally a good sign, as it gives the market momentum and can lead to strong upward moves. However, this kind of push tends to be fragile.
At the moment, we haven’t yet returned to a new Open Interest ATH on Binance, which may suggest that we’re not in a full-blown euphoric phase on derivatives markets just yet.
🔄 Bitcoin Heatmap Analysis
Let’s move on to the Bitcoin heatmap analysis, which was missing from this analysis and completes the most comprehensive data for these days. I hope it’s useful for you.
In the 6-month timeframe, Bitcoin has had a good upward trend but experienced a rejection after hitting orders in the 110,000–113,000 range. It’s currently in the 104,000 zone, with the most important support zone at 92,000, which is likely to hold.
In the monthly timeframe, we’ve broken through the 106,000 zone, which was a strong support level based on orders, but there isn’t a strong support zone immediately below. The next support level is 100,000–102,000, which could be a solid level, while the 110,000–112,000 zone is currently the most valid resistance level for Bitcoin.
In the weekly timeframe, a similar event has occurred. We’ve been rejected from the significant 110,000 resistance zone and are heading for further downside, but at a slow pace. In this timeframe, no specific support orders have been registered yet, and it will take some time for traders to place their buy orders on exchanges. However, even if we bounce from this level, we shouldn’t underestimate the 110,000 resistance.
📝 Final Thoughts
This is the most comprehensive Bitcoin analysis for the community.
We’ve done our best to collect the data comprehensively in this post for your awareness and present it to you in this analysis, hoping it has been useful for you!
Our team has worked on this analysis for several days, so we’d be thrilled if you boost, comment, and share the analysis with your friends.

GOLD - at today ultimate support, short below #GOLD... perfect move as per our analysis and now market just reached at his today ultimate supporting area, that is 3289 again.
Keep close that area and keep in mind guys that below that market can take a dip towards our further supporting areas.
So keep close and only short below 3289
Good luck
Trade wisely

KO 1D — A Diamond Not Yet Broken, But Already CrackingOn the daily chart of Coca-Cola, a classic diamond top structure is forming — not yet completed, but clearly visible. The market expanded its range in the initial stage, then began to compress into a tighter zone, creating the typical shape of a diamond. This isn’t a continuation pattern — it’s the setup phase for redistribution.
The key level sits at $68.50 — the base of the diamond. As long as this line holds, the pattern remains inactive. But current price behavior says more than enough: weakening momentum, falling volume, and a lack of aggressive follow-through on recent highs. This isn’t accumulation — it’s preparation.
Price is currently trading between the MA50 and MA200, signaling a neutral phase with downside risk. The moving averages are narrowing, but no crossover has occurred yet. That’s critical — the trend isn’t broken, but it’s clearly losing energy. If $68.50 gives way, the measured move from the pattern projects a decline toward $61.82.
From a fundamental standpoint, Coca-Cola remains stable — but uninspiring. Earnings met expectations, revenue was steady, and no major catalysts are visible. In this type of environment, technical structure often becomes the tool for institutional rotation — not because the story collapsed, but because the setup makes sense.
The edges of the diamond are in place. All that’s missing is the break. If the neckline fails, the downside scenario is already built — structurally and logically.

"PEPE 1H Analysis - Breakout Incoming? 📊 *PEPE/USDT – 1H Technical Analysis*
An ascending triangle pattern is developing on the 1-hour timeframe, which often indicates potential bullish momentum.
🟢 Price is approaching a key resistance near *0.00001516*.
🟡 A clean breakout above this level with strong volume may open the door for further upside.
🔴 Watch for *confirmation* before considering any move.
🔍 This chart is purely for educational and analytical purposes.
No financial advice. Do your own research before making any trading decisions.
#PEPE #PEPEUSDT #Crypto #TechnicalAnalysis #TradingView #Altcoins

Nvidia Earnings Boost, Trade Tariffs Legitimacy, NQ trade ideaCME_MINI:NQ1!
Big Picture Context: .
NQ futures rallied after NVIDIA posted an earnings beat and after the Manhattan-based Court of International Trade blocked President Trump's Liberation Day tariffs.
Goldman Sachs noted that the ruling on Liberation Day tariffs gives the administration 10 days to halt tariff collection, but does not affect sectoral tariffs. The administration can still impose across-the-board and country-specific tariffs under other legal authorities.
Jobless claims and continuing claims have come in higher.
What has the market done?
The rally faded in the overnight session. However, the catalysts provided energy for prices to move higher. Currently, price is trading above the prior week’s high, yesterday’s high, and it is also trading above the yearly open, and 2025 VPOC and mcVPOC for the last 3 weeks.
What is it trying to do?
The market is negating the recent bear market territory sell-off and negating a bear market rally. It is propelling higher.
How good of a job is it doing?
The market has created good structure and micro composites, despite some gaps left open, and it has created higher lows since last Friday.
What is more likely to happen from here?
Scenario 1: Long Continuation
In this scenario, we are looking for NQ to turn at the immediate 2025 LVN support area. If it edges higher, we will be looking for potential long opportunities above the 21710–21720 area, targeting overnight highs and potentially the next HVN.
Scenario 2: Gap Close and Reversal
In this scenario, we are looking for a pullback, testing pHi and pWk-Hi. We will look for a rounded base that consolidates here on a lower timeframe, such as the 5-minute timeframe, and look for a reversal back towards the 21710–21720 level.
pWk-Hi: prior Week's High
pHi: prior Day's High
HVN: High Volume Node
LNV: Low Volume Node
VPOC: Volume Point of Control
C: Composite (prefix before VAL, VAH, VPOC, VP, AVP)
mC: micro-Composite (prefix before VAL, VAH, VPOC, VP, AVP)

BTC - Let's Do It Again!!Hello TradingView Family / Fellow Traders. This is Richard, also known as theSignalyst.
📈 As per our last analysis (attached on the chart), BTC rejected the lower orange trendline and moved higher as expected! ✅
🔄 BTC is now retesting the lower trendline again, so we’ll be looking for new trend-following buy setups as long as the red structure at $105,000 holds!
📚 Always follow your trading plan regarding entry, risk management, and trade management.
Good luck!
All Strategies Are Good; If Managed Properly!
~Rich

Be careful with TON !!!Currently, TON is forming an ascending triangle, indicating a potential price increase. It is anticipated that the price could rise, aligning with the projected price movement (AB=CD).
However, it is crucial to wait for the triangle to break before taking any action.
Give me some energy !!
✨We spend hours finding potential opportunities and writing useful ideas, we would be happy if you support us.
Best regards CobraVanguard.💚
_ _ _ _ __ _ _ _ _ _ _ _ _ _ _ _ _ _ _ _ _ _ _ _ _ _ _ _ _ _ _ _
✅Thank you, and for more ideas, hit ❤️Like❤️ and 🌟Follow🌟!
⚠️Things can change...
The markets are always changing and even with all these signals, the market changes tend to be strong and fast!!

Skeptic | Gold (XAU/USD): Breakout Triggers Set to Pop?Hey everyone, Skeptic here! Let’s fire up this Thursday morning with a fresh Gold (XAU/USD) analysis! 😊 We’re diving into the Daily Timeframe to spot the trend, then zooming into the 4-Hour Timeframe for juicy long and short triggers. Stay with me—let’s get to it! 📊
Daily Timeframe: The Big Picture
Gold’s been on a tear, climbing to a high of 3416.19 (it went higher, but I’m using the candle close for faster triggers when we hit those levels :)). Now, we’re in a correction phase, forming a downward channel . This correction has been solid, dropping to the 0.5% Fibonacci retracement. What’s cool about this channel is how cleanly it’s reacting to the ceiling, floor, and midline, making it super valid for us. A break of either the ceiling or floor could give us some killer triggers. But since we’re in a correction, it’s smart to dial back risk on all positions. Lowering risk can mean taking profits quicker, shrinking position sizes, tighter stop losses, or a mix of these to keep your account safe.
4-Hour Timeframe: Long & Short Setups
Now, let’s get to the 4-hour chart for our long and short triggers.
📈 For longs, we’ve got two setups. The first is a bit risky since we haven’t confirmed the downward channel breakout yet—it’s a preemptive move. You can go long after breaking the resistance at 3366.71 . Our main long trigger, though, is a break above 3416.19 , which also cracks the channel’s ceiling and sets us up for new all-time highs. If you catch this one, don’t rush to take profits too fast—let it run!
📉 For shorts, a break below support at 3249.68 opens the door, with RSI hitting oversold as a solid confirmation. But since this goes against the major uptrend, it’s risky—take profits early and keep position sizes small to stay safe. :)
💬 Let’s Talk!
If this analysis sparked some ideas, give it a quick boost—it means a lot! 😊 Got a pair or setup you want me to dive into next? Drop it in the comments, and I’ll tackle it. Thanks for joining me—see you in the next one. Keep trading smart! ✌️

Skeptic | USD/JPY Analysis: Bearish Momentum Fuels Short Setups!Hey everyone, Skeptic here! I know some of you might’ve missed our last USD/CHF short signal that hit a sweet 3:1 R/R—no worries! 😊 The market’s always here, so missing a trade isn’t the end of the world. I’m not here to push FOMO; my goal is to take you on a long-term trading journey, and I’m stoked to have you along for the ride! :))) Let’s get back to USD/JPY and break down the latest action. 📊
Daily Timeframe: The Big Picture
First, let’s zoom out and talk about the DXY (US Dollar Index), which recently broke the 99.005 support and turned bearish. This puts USD-based pairs like USD/JPY in the spotlight for short opportunities this week. Here’s what’s happening with USD/JPY:
Trend Context: The major trend is bearish. Last week, sellers showed no mercy to buyers, and with DXY’s bearish move, we’re likely to see more of the same this week.
Key Level: We’re currently reacting to a major daily support at 142.305. Expect a range or reaction here, so we must wait for confirmation before shorting.
Recent Correction: The prior correction reached the 0.50% Fibonacci retracement and seems to have resumed the major bearish trend.
With this in mind, let’s zoom into the 4-Hour Timeframe to hunt for long and short setups.
4-Hour Timeframe: Long & Short Setups
The 4-hour chart is giving us some clear signals to work with. Here’s the plan:
Short Setup:
Key Level: The 142.338 level is critical, as it formed a ceiling at 148.569 in the past and acted as support before.
Trigger: If we form a lower high and then break below 142.305, open a short position.
Confirmation: Use RSI to back up the breakout, ensuring momentum aligns.
Why It Works: A lower high signals increasing weakness in this support, making a break more likely.
Long Setup:
My Take: I personally don’t have a long trigger right now. Both the major and minor trends are downtrends, so going long doesn’t make sense in these conditions.
If You Insist: If you’re set on a long, wait for a break above 144.125. But keep it tight—low risk, small stop loss, and take profits quickly once you hit a decent R/R.
💬 Let’s Talk!
If this analysis sparked some ideas, give it a quick boost—it really helps! 😊 Got a pair or setup you want me to dive into next? Drop it in the comments, and I’ll tackle it. Thanks for joining me—see you in the next one. Keep trading smart! ✌️

Skeptic | SPX 500 Update: Bullish Breakout Brewing?Hey everyone, Skeptic here! It’s been a while since we’ve checked in on the SPX 500 , but the market’s now flashing a killer long opportunity with a high R/R—don’t miss this one! 😊 Stay with me to the end for the full breakdown. Let’s dive into the Daily Timeframe to set the stage. 📊
Daily Timeframe: The Big Picture
The SPX 500 pulled off a deep correction , dropping from a high of 6154.64 to lows around 4810.39 with some wild shadows that caught everyone off guard. But now, it’s firing up with fresh momentum, carving out higher highs and higher lows that scream bullish strength. The corrections in this new uptrend are super shallow and flow with the trend—exactly what we want to see! After hitting resistance at 5961.82 , we’ve had a slight pullback, but it looks like this correction is wrapping up, and we’re on the verge of the next big uptrend leg. Let’s zoom into the 4-Hour Timeframe to hunt for long and short triggers.
4-Hour Timeframe: Long & Short Setups
On the 4-hour chart, the correction shaped up as a descending trendline . We broke it, pulled back, and now we’re primed to crack 5895.39. A breakout above this level is our main long trigger. To get more precise, let’s check the 1-Hour Timeframe.
For the long setup , a clean break above 5896.34 gets us in the game. This move also busts through P.P. Level 1, giving us solid confirmation, and we could ride the wave up to P.P. Levels 3 or 4, targeting 5930.83 to 5956.97 . Those are prime spots to lock in some profits, but don’t close the whole position—since we’re trading with the trend, we can hold for more upside. For shorts, I’ve got nothing. Going against this bullish momentum would be pure madness! I’d wait for a sharp drop below support at 5849.67 before even considering short triggers, but right now, there’s zilch.
💬 Let’s Talk!
If this update sparked some ideas, give it a quick boost—it means a lot! 😊 Got a pair or setup you want me to tackle next? Drop it in the comments. Thanks for hanging out— let’s grow together and remember: Weathermen forecast. We trade! :))) ✌️

GOLD - at CUT N REVERSE area? what's next??#GOLD... market just holds his multi times holds area 3289
keep close that area and if market hold it in that case you we can expect a spike to upside
NOTE: we will go for CUT N REVERSE at breakage of 3289
good luck
trade wisely

XRP Ready for PUMP or what ?Ripple has successfully broken out of the falling wedge pattern and retested the breakout zone,the price is holding firmly above previous resistance, which now acts as strong support.
Continued strength could lead to upward movement toward targets at $2.65, $2.95, and $3.35
Stay Awesome , CobraVanguard

TradeCityPro | Bitcoin Daily Analysis #104👋 Welcome to TradeCity Pro!
Let’s dive into Bitcoin and key crypto indices. As usual, in this analysis I’ll walk you through the triggers for the New York futures session.
⏳ 1-Hour Timeframe
On the 1-hour chart, as you can see, Bitcoin was once again rejected from the 110128 level yesterday and is now hovering near 108237.
✔️ At the moment, price hasn’t yet touched the 108237 support. If it manages to stay above this level without breaking below, the chances of retesting 110128—and even breaking above it—increase.
🔍 If 108237 is broken, a short position could be considered. However, keep in mind that this setup goes against the current uptrend. As mentioned in previous analyses, the 106192–107010 range is a major support zone, and as long as price remains above it, the trend remains bullish.
📉 The main short trigger would be a break below this key support. If that occurs, it could introduce strong bearish momentum. An RSI break below 38.57 would serve as a momentum confirmation.
✨ During this pullback from 110128, market volume has been decreasing, which indicates the strength of the ongoing uptrend.
💥 If 110128 is broken, and considering the strong trend, a long position could be initiated. An RSI break above 50 would provide additional confirmation. The primary long trigger remains a break above 111747.
👑 BTC.D Analysis
Bitcoin Dominance continued to fall yesterday, reaching as low as 63.87. It has shown a slight bounce from that level and is currently in a mild upward correction.
⭐ If a lower high forms below 64.18, the chances of breaking below 63.87 increase. However, if the correction goes beyond 64.18, the probability of resuming the uptrend will grow.
📅 Total2 Analysis
Yesterday, Total2 was rejected from 1.24 and corrected down to 1.21. If price bounces from here and heads back toward 1.24, the chances of breaking that resistance will rise.
📊 If 1.21 fails to hold, a deeper correction toward 1.18 could follow.
📅 USDT.D Analysis
USDT Dominance is forming a lower high compared to 4.56. If this plays out and 4.49 is broken, it would confirm a bearish move.
⚡️ On the other hand, if 4.56 is broken to the upside, the move could extend toward 4.62.
❌ Disclaimer ❌
Trading futures is highly risky and dangerous. If you're not an expert, these triggers may not be suitable for you. You should first learn risk and capital management. You can also use the educational content from this channel.
Finally, these triggers reflect my personal opinions on price action, and the market may move completely against this analysis. So, do your own research before opening any position.

XAUUSD (Gold/USD) – Smart Money Setup with Key Zones & Target 🧠 Market Summary:
This chart shows a classic Smart Money Concept (SMC) play. We're looking at how big players (banks, institutions) trap retail traders, push price through liquidity zones, and move toward their real targets.
📌 Detailed Breakdown:
1️⃣ Ellipse Zone (Left Side – Accumulation Phase)
This shaded ellipse shows where price was moving sideways in a tight range. This is a classic accumulation zone, meaning big players were quietly building their long positions.
✅ Price stayed in this range from May 20–21 before breaking out with strong bullish candles.
👉 What this means: Institutions are loading up. Once they’re filled, they push price upward fast.
2️⃣ Central Zone of Market (Green Diamond)
After the breakout, price made a small pause/retest, which we marked with a green diamond.
This is a re-accumulation area—a temporary consolidation before another push up. It’s also a mid-point, showing the “central engine” of this price move.
👉 What this means: Market still bullish here, collecting more orders.
3️⃣ Major Resistance Zone (Top of Chart)
Price reached this supply zone near 3,360–3,370 and immediately faced strong rejection.
You can see:
Long wicks at the top
Bearish pressure stepping in
Start of a curve formation
👉 What this means: Big players are offloading their long positions and preparing for a reversal.
4️⃣ Rounded Top Curve (Distribution Phase)
Notice the arc shape drawn over the candles.
This is a distribution pattern — a rounding top that shows price is topping out slowly. It’s often a sign that smart money is exiting while trapping late buyers.
🔻Price then dropped aggressively, breaking structure.
5️⃣ BOS (Break of Structure)
A major bearish signal occurred here.
Price broke a recent low and created a BOS (Break of Structure) — a strong confirmation that the market has shifted from bullish to bearish.
👉 What this means: Now we look for retracement entries to go short.
6️⃣ 50% Retracement + Reversal Area
After the BOS, price pulled back to the 50% Fibonacci level and hit a small resistance zone (highlighted in purple). This is a classic area for smart entries.
✅ This level rejected price again — showing bearish confirmation.
7️⃣ Target Zone – 3,330.055
A clean, well-defined target area where:
Liquidity rests
Previous orders may get triggered
Market could react strongly
👉 If price pushes into this zone again, expect a reaction (either continuation or a reversal).
8️⃣ Support Zone – 3,290.345
This is your final support zone if the market continues to drop.
If price breaks this support, it could open room for a larger bearish move.
🎯 Trading Plan (Example):
📈 If price retraces to 3,330.055 and shows rejection → consider short setup
📉 Watch 3,290.345 for bounce or breakdown
❌ Invalidation: Break above 3,370 (major resistance)
💡 Bonus Tip – Trading Psychology:
“Smart money doesn’t chase. It waits for the trap to be set, then strikes with precision.”
Stay patient. Don’t rush entries. Let price come to your zones.
🏁 Summary:
This chart is a full example of smart money manipulation, showing:
Accumulation → Expansion → Distribution → Breakdown
BOS + 50% retrace = high-probability short
Key zones: 3,330 (Target) & 3,290 (Support)
📢 Don’t Forget:
If this analysis helped, drop a like, share, or comment your view below!
#XAUUSD #GoldAnalysis #SmartMoney #PriceAction #TradingView #Minds #ForexStrategy #GoldSetup #SMC #LiquidityZones
