"USDJPY Just Printed a Trap — Smart Money Is In. Are You?"🧠 Smart Money Concepts (SMC) Setup Alert: USDJPY | 15-Min Timeframe
We’re spotting a high-probability bullish continuation setup on USDJPY backed by Smart Money logic. Let’s unpack what’s happening:
🧭 1. Liquidity Grab at the Low
Notice how price created a false breakdown below prior structure — a classic liquidity hunt. Late sellers got trapped before price snapped back aggressively, triggering a Bullish Break of Structure (BOS).
Smart Money needed to grab liquidity before running price higher. Textbook manipulation.
🟩 2. Refined Entry Zone: Discount + Bullish Order Flow
Price has now retraced back to a discount zone, entering the premium-to-discount pullback area. Buyers are expected to defend this level, creating the potential for a bullish continuation.
This entry is cleanly defined by a buy-side imbalance (light green area) which overlaps with a bullish order block and internal trendline support.
📐 3. Risk-to-Reward (R:R) Setup
We’ve got an excellent R:R opportunity here:
🎯 Entry: Near 145.910
❌ Stop Loss: Just above 146.314 (invalidate bullish bias)
✅ Take Profit Zone: 145.367 (with continuation possible beyond)
This gives us roughly a 2.3R setup, highly favorable for swing entries.
🎯 4. Confluence
Trendline support holding
Bullish BOS confirmed
Imbalance filled
Liquidity grabbed
Order block respected
FVG forming structure for propulsion
Smart Money is likely to push price back toward internal liquidity highs — and possibly sweep them for a final exit.
📊 Strategy:
Wait for bullish engulfing or strong rejection wick from this discount zone to confirm entry.
Trail stop as structure develops on lower timeframes. This setup can also be compounded if price forms another internal BOS.
⚠️ Risk Reminder:
Don’t chase. Let price come to you.
Manage risk at all times.
One setup doesn’t define the day — consistency wins.
🧪 Summary:
USDJPY is giving Smart Money vibes — from the liquidity grab, clean BOS, internal order block, to an excellent R:R setup.
This is the kind of trade where you want to be the hunter, not the prey.
💬 Drop a 🔥 if you caught this move.
📩 Tag a trading buddy who needs to learn SMC.
📊 Stay smart. Trade with purpose.
Tradingview

TradeCityPro | Bitcoin Daily Analysis #89👋 Welcome to TradeCity Pro!
Let’s dive into the Bitcoin analysis and key crypto indexes. As usual, in this analysis I’ll go over the futures triggers for the New York session.
⏳ 1-Hour Timeframe
In the 1-hour timeframe, as you can see, Bitcoin is still below the 104866 resistance level and is ranging underneath this zone.
💥 Today, an important news update came from Trump: a deal has been made between China and the U.S., and the two countries have agreed to reduce tariffs for 90 days.
✔️ The impact of this news was that Bitcoin made a wick toward 106247 but didn’t reach it, pulled back, and is now again below the 104866 area.
✨ At the moment, the 104866 level is a suitable trigger for opening a position, but be aware that there’s a significant resistance zone at 106247. Personally, I won’t open a position just on the break of 104866 because it's very close to the ATH zone, and the probability of entering a corrective phase is high.
⚡️ If a correction begins, the first support level for price is at 102391. If the RSI stabilizes below 50, the likelihood of a correction increases.
🔽 As for short positions, we should wait until the market shows a trend reversal.
👑 BTC.D Analysis
Now let’s look at Bitcoin dominance. Yesterday, the dominance chart made a slight upward correction and is now breaking below the 62.65 low.
🧩 If the downward move in dominance continues, altcoins could make another leg upward. The next support for dominance is at 62.17.
📅 Total2 Analysis
Now for the Total2 analysis. The 1.24 area, which was our long trigger, is being broken—and if it confirms, the price could rise up to 1.31.
⭐ This confirmation, along with the drop in Bitcoin dominance, could give us good long setups on altcoins.
📅 USDT.D Analysis
Now to Tether dominance. This index hasn’t triggered yet and is currently sitting at the 4.51 support. If this index also confirms a bearish move, the risk of opening long positions will be much lower.
💫 The next support level for Tether dominance is at 4.37.
❌ Disclaimer ❌
Trading futures is highly risky and dangerous. If you're not an expert, these triggers may not be suitable for you. You should first learn risk and capital management. You can also use the educational content from this channel.
Finally, these triggers reflect my personal opinions on price action, and the market may move completely against this analysis. So, do your own research before opening any position.

SPY WEEKLY 12 MAY 2025Welcome to Spy weekly. I have tried my best to explain the price action here. If you have any doubts, feel free to leave a comment or DM me.
NOTESTAY AWAY FROM OPTIONS

Ethereum ... Don't miss this train!The Ethereum season has arrived, and in the coming days, we'll be focusing on Ethereum and the tokens built on its network.
The chart shows a descending broadening wedge pattern, which has been broken on the daily timeframe.
Don’t wait for a retest or any major corrections—this train won’t wait for you.
The target for this pattern is $6,600.
Best regards Ceciliones🎯

BTCUSDT - High placed ? What's next ??#BTCUSDT - Market placed a very reasonable high so far.and doing to mature his selling turn
Keep close and if market tholda his current high region them we can expect a drop from here.
Region is around 104300 to 105100
Don't be lazy here n try to understand the market current pattern.
Good luck
Trade wisely

Chart is speaking itself...For months, I've been saying Bitcoin is bullish, and few believed it. I hope you made good profits. Get ready, Bitcoin will hit $300K soon.
PREVIOUS ANALYSIS
Stay Awesome , CobraVanguard

Do you think I'm joking ???I might be wrong and this might never happen, but it might come true From a technical perspective!!!
REMEMBER
Give me some energy !!
✨We spend hours finding potential opportunities and writing useful ideas, we would be happy if you support us.
Best regards CobraVanguard.💚
_ _ _ _ __ _ _ _ _ _ _ _ _ _ _ _ _ _ _ _ _ _ _ _ _ _ _ _ _ _ _ _
✅Thank you, and for more ideas, hit ❤️Like❤️ and 🌟Follow🌟!
⚠️Things can change...
The markets are always changing and even with all these signals, the market changes tend to be strong and fast!!

TradeCityPro | Bitcoin Daily Analysis #88👋 Welcome to TradeCity Pro!
Let’s dive into the analysis of Bitcoin and key crypto indexes. As usual, in this analysis I want to review the futures triggers for the New York session.
⏳ 1-Hour Timeframe
In the 1-hour timeframe, as you can see, Bitcoin has formed a slightly better structure and it seems to be undergoing a trend-aligned correction.
✔️ A trend-aligned correction happens when the market enters a corrective phase, but the sellers are so weak that they can’t even stop the price from rising during the correction, and the price gradually moves upward.
🔑 In this case, since the market is in a corrective phase, if we enter with a tight stop loss, we are likely to get stopped out due to the nature of corrections. So it's better to open positions with a wider stop loss so it doesn't get triggered easily.
📊 One thing to note on the current Bitcoin chart is that we are very close to its most important resistance at 106247. This zone is a very strong supply area, and I think breaking through it won’t be easy.
⚡️ So for now, I suggest not opening any new positions on Bitcoin and instead using dominance charts to open positions on altcoins.
📈 If you already have an open position, I recommend keeping your Bitcoin position open, because if 106247 breaks, your position could become highly profitable.
👑 BTC.D Analysis
Let’s move on to Bitcoin dominance. Yesterday, after breaking the 63.61 level, there was another downward leg down to the 62.65 area, and altcoins made another upward move.
⭐ Currently, the dominance is correcting and has risen to the 63.29 area. I think it’s going through a slight correction since its drop was sharp and needs a bit of a breather.
💥 However, if the 62.65 low gets broken, we can take it as confirmation of the next bearish leg, and if that happens, we can again open positions on altcoins.
📅 Total2 Analysis
Now to the Total2 analysis. Yesterday, this index got rejected from the 1.24 top and slightly corrected, but it hasn’t reached the 1.17 area which overlaps with the 0.236 Fibonacci level, so we still haven’t confirmed the start of a correction.
✨ In my opinion, as long as we stay above the 0.382 level, the uptrend remains strong. Only after breaking below this area will we confirm the start of a deeper correction.
🔼 For continuation of the trend, breaking above 1.24 would allow us to open positions on altcoins.
📅 USDT.D Analysis
Now to Tether dominance. This index also broke below 4.63 yesterday and dropped to 4.51, and is currently correcting.
🧩 To get confirmation from Tether dominance, a break below 4.51 would signal that we can open long positions on altcoins.
🎲 The simultaneous break of 4.51 and 1.24 could be a strong confirmation if dominance continues to decline.
❌ Disclaimer ❌
Trading futures is highly risky and dangerous. If you're not an expert, these triggers may not be suitable for you. You should first learn risk and capital management. You can also use the educational content from this channel.
Finally, these triggers reflect my personal opinions on price action, and the market may move completely against this analysis. So, do your own research before opening any position.

TradeCityPro | FARTCOIN: Watching Trendline & RSI for Next Move👋 Welcome to TradeCityPro!
In this analysis, I’m going to review the FARTCOIN token. This project is one of the meme coins that launched in 2024 and has shown good growth so far.
🔍 This meme coin currently has a market cap of $1.31 billion and ranks 65th on CoinMarketCap.
📅 Daily Timeframe
On the daily timeframe, as you can see, the price recorded a major top at the 2.16674 zone in early 2025 and then entered a correction phase.
✨ This correction phase was quite long and extended down to 0.21562, but after a bottom was formed in that area, bullish momentum returned to the coin and it started moving upward again.
✔️ Currently, the price has moved up to around the 1.53002 level and has a rising trendline that it has touched several times, serving well as a dynamic support level.
📊 For now, the issue with this trend is that the volume has significantly decreased compared to the previous leg, which could indicate weakness in the upward trend. We need to wait and see whether buying or selling volume increases in the next move — either a correction or another bullish leg — to confirm whether the trend will reverse or continue.
📈 For a long position, 1.53002 is the closest trigger to the current price. If this level is broken, the price could move toward 2.16674.
🛒 The main confirmation for a bullish continuation and a strong long position would come after the breakout of 2.16674. That’s also our trigger level for a spot buy.
🔽 To turn bearish, the key trigger is breaking the 0.63121 support. However, a riskier trigger would be breaking the trendline and activating the 1.00301 trigger. If that happens, we can consider it confirmation of the beginning of a correction.
💥 The RSI oscillator is currently forming a clean box between 50 and 70 and is now near the top of this box. If RSI enters the Overbuy zone, it would strongly confirm a long position.
📉 For a trend reversal or the start of a correction, a sustained RSI move below 50 would provide confirmation.
📝 Final Thoughts
This analysis reflects our opinions and is not financial advice.
Share your thoughts in the comments, and don’t forget to share this analysis with your friends! ❤️

PEPE It has growth potentialFinally, this pattern was broken and had a positive impact, leading to significant growth. Now, with a slight price correction, higher price levels can be reached.
Stay Awesome , CobraVanguard.

#FILUSDT - bottomed out!On the weekly timeframe, the downward trendline has been broken and successfully retested.
A strong move upward is just a matter of time…
Notice how it bounces hard every time it touches the support zone marked by the grey rectangle — this has happened three times in a row.
Also, FIL has been in an accumulation phase for around 1,092 days — that’s nearly 3 years.
$28 is a target I'm fully confident in for this coin.
Best Regards Cecilion🎯

TradeCityPro | Bitcoin Daily Analysis #87👋 Welcome to TradeCity Pro!
Let’s get into the analysis of Bitcoin and major crypto indices. As usual, I’ll review the triggers for the New York Futures session.
⏳ 1-Hour Timeframe
On the 1-hour timeframe, Bitcoin moved sideways yesterday as I mentioned, and after the RSI exited the Overbuy zone, it corrected down to the 102391 area.
🔍 This was a very minor correction, mainly due to the RSI leaving the Overbuy zone. Currently, the oscillator has reset, and if it re-enters Overbuy, we can confirm the start of bullish momentum.
✨ Now the candle has closed above the 103642 area, and if the price stabilizes above this level, it could move toward the main resistance at 106247.
📊 In my opinion, the price will move toward 106247 and then enter a correction because the breakout of 103642 was accompanied by increased volume, and if this volume continues, the probability of this move increases.
📉 If the correction starts from the current level, the first support we have is 102391, and after that, there is no solid support until 99337.
🧩 The reason I’m not using Fibonacci to find support zones is that the price hasn’t confirmed the start of a correction yet, and a proper top hasn’t been formed. I’m waiting for that top and confirmation of the correction before identifying key correction levels.
✔️ For now, only these two support levels are important, and as long as the price is above 99337, the trend remains bullish.
📈 For opening a position today, the Bitcoin trigger at 103642 has been activated and is currently getting a pullback. If you get confirmation from this pullback, you can enter a position — but be careful, there's a very important resistance at 106247 and that zone is highly significant.
👑 BTC.D Analysis
Let’s move to Bitcoin dominance. Yesterday, dominance had a slight correction and pause, and today it broke the 63.61 area and is moving toward the 63.23 support.
⚡️ It seems there’s strong bearish momentum in dominance, and if it continues to drop, I believe it could easily break 63.23 and move further down.
📅 Total2 Analysis
Let’s check out Total2. Yesterday, the 1.17 trigger for this index also activated, and you could open positions on altcoins.
💥 The next resistance we currently have is the 1.22 area, and considering the drop in Bitcoin dominance, this index can easily move toward that resistance.
🔔 At the moment, I can’t give you any trigger on this index — you can only enter based on confirmation from individual coins.
📅 USDT.D Analysis
Now let’s look at Tether dominance. This index has also continued its move and after a short pause, broke below 4.65 and is moving downward.
🎲 For now, the trend in dominance is bearish, which pushes the market upward.
❌ Disclaimer ❌
Trading futures is highly risky and dangerous. If you're not an expert, these triggers may not be suitable for you. You should first learn risk and capital management. You can also use the educational content from this channel.
Finally, these triggers reflect my personal opinions on price action, and the market may move completely against this analysis. So, do your own research before opening any position.

Testing Red Resistance – Breakout Potential!🚀 CRYPTOCAP:ADA Testing Red Resistance – Breakout Potential! 📈
CRYPTOCAP:ADA is currently testing the red resistance zone. If the price breaks through, the first target could be the green line level! 📊
Let’s catch this breakout together! 💼💸

Waiting for a Perfect Entry! 🚀 SEED_WANDERIN_JIMZIP900:WIF in Uptrend – Waiting for a Perfect Entry! 📈
SEED_WANDERIN_JIMZIP900:WIF is currently in an uptrend! If you missed the entry, you can wait for a correction. Once the price comes back to the green zone, keep an eye out for confirmation to enter long! 🔥
Let’s catch the next opportunity together! 💼💸

TradeCityPro | APT: Testing Momentum After Key Breakout👋 Welcome to TradeCity Pro!
In this analysis, I want to review the APT coin for you. This coin belongs to the Aptos project, which is one of Ethereum’s Layer 2 solutions.
⚡️ APT, with a market cap of $3.6 billion, is currently ranked 32 on CoinMarketCap.
⏳ 4-Hour Timeframe
As you can see in the 4-hour timeframe, after finding support at the 4.687 zone, the price made a very sharp bullish move and reached 5.708. After an initial rejection, it has now managed to stabilize above this level.
🔍 If this bullish move continues, we could see another upward leg, with the next resistance at 6.047. If this level breaks, the price could move up to 6.752.
✔️ There’s a very important RSI ceiling at 80.76, which has consistently caused rejections after sharp upward moves. If the price aims for another bullish wave, this level will be critical and could mark the top of the move.
⭐ A breakout above this level seems unlikely for now, since 80.76 is a very high reading for the RSI oscillator, and the chance of it breaking is quite low. But if it does happen, we could see an extremely sharp and unusual move.
🔽 As for a bearish scenario and short positions, we currently need to wait for a trend reversal. If the breakout above 5.708 turns out to be fake and the price starts moving downward, we can look for a trigger in a lower timeframe to enter.
🔑 But keep in mind that short positions in these market conditions are very, very risky. And if you do open such a position, make sure to secure profits frequently with small risk-to-reward setups.
📝 Final Thoughts
This analysis reflects our opinions and is not financial advice.
Share your thoughts in the comments, and don’t forget to share this analysis with your friends! ❤️

PRQ Bullish Inverted Head and Shoulders – Testing Red Resistance🚀 PRQ Bullish Inverted Head and Shoulders – Testing Red Resistance! 📈
PRQ has formed a bullish inverted head and shoulders pattern and has already broken out of the neckline! Now, the price is testing the red resistance. There’s potential for a retest of the neckline before pushing back up again. 🔥
Let’s monitor this move closely! 💼💸

DEXT Potential Inverted Head and Shoulders – Bullish Setup! 🚀 $DEXT Potential Inverted Head and Shoulders – Bullish Setup! 📈
$DEXT is potentially forming an inverted head and shoulders pattern! 🧠 This bullish pattern could signal a strong move to the upside if confirmed. 📊
Let’s catch this breakout together! 💼💸

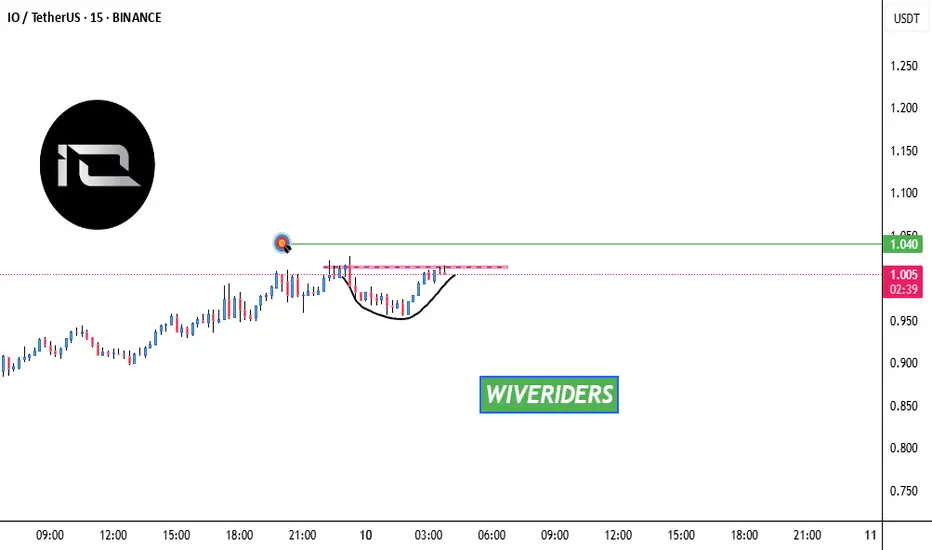
Bullish Cup with Handle🚀 SEED_ALEXDRAYM_SHORTINTEREST2:IO Forming Bullish Cup with Handle – Breakout Potential! 📈
SEED_ALEXDRAYM_SHORTINTEREST2:IO is forming a potential bullish cup with handle pattern! 🧠 If the price breaks the red resistance, the first target could be the green line level! 🔥
Let’s catch this breakout together! 💼💸
PEPE Testing Purple Resistance – Bullish Pattern Formed!🚀 CRYPTOCAP:PEPE Testing Purple Resistance – Bullish Pattern Formed! 📈
CRYPTOCAP:PEPE is currently testing the purple resistance line and has formed a bullish pattern! 📊 If the price breaks through, the target could be the green line level! 🔥
Let’s ride this breakout together! 💼💸

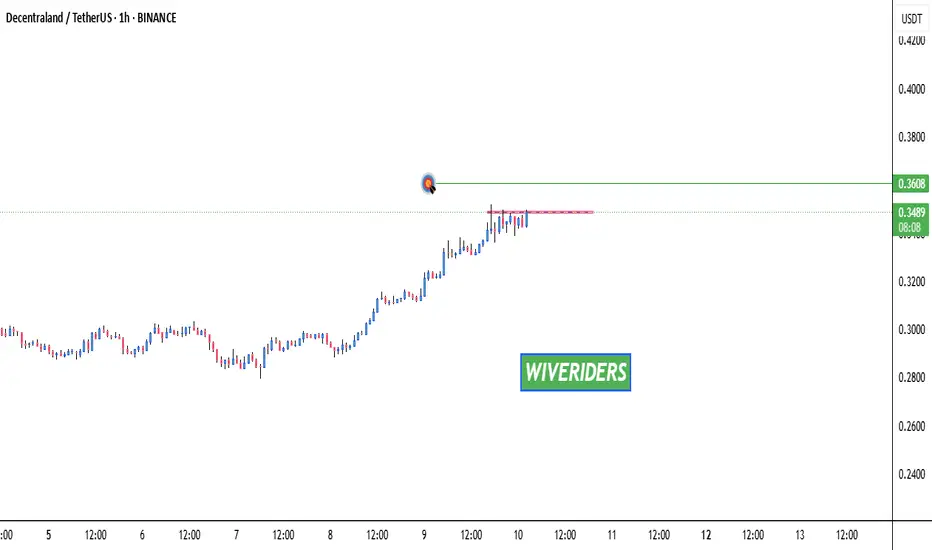
MANA Testing Red Resistance🚀 OTC:MANA Testing Red Resistance – Target Ahead! 📈
OTC:MANA is currently testing the red resistance zone. If the price breaks through, the target could be the green line level! 📊
Let’s watch this breakout together! 💼💸
Watch for Resistance Breakout! 🚨 SPARKS:VIRTUAL Bearish Head and Shoulders Formed – Watch for Resistance Breakout! 📉
SPARKS:VIRTUAL has formed a bearish head and shoulders pattern! 🧠 To confirm the trade, we need a breakout of the red resistance zone. If the price breaks through, it could signal that buyers are back, setting up for a potential reversal! 🔥
Let’s monitor this closely! 💼💸

GOLD - it's breakout ? What's next??#GOLD... perfect move as expected and now market just broke his resistance area that is around 3338
If that is proper breakout then we can expect again long towards upside mentioned areas.
Good luck
Trade wisely
SteroidsFX

TradeCityPro | Bitcoin Daily Analysis #86👋 Welcome to TradeCity Pro!
Let’s move on to the analysis of Bitcoin and major crypto indices. As usual, in this analysis I want to review the futures session triggers for New York.
✔️ Yesterday the market made another bullish leg and has now reached the 103642 resistance. There’s a chance we might enter a correction phase because the move has been very sharp and I think the market needs a rest.
⏳ 1-Hour Timeframe
As you can see in the 1-hour timeframe, we had a bullish move that continued after a pullback to the 99337 zone, climbing all the way to 103642.
💥 The RSI trigger I gave you also got activated and yesterday you could open a momentum-based position. I personally already have a long on Bitcoin from near 88000, so I didn’t open another one yesterday.
⚡️ Currently, RSI is exiting the Overbuy zone, and if that happens, the chance of entering a correction phase increases. As long as the price is above 99337, the main market momentum is still bullish and we’re not confirming a trend reversal just yet due to this strong momentum.
📈 Over the past few weeks, I emphasized a lot that you should definitely have at least one long position open, and not to open short positions unless a trend reversal is confirmed. I hope you’ve used the analyses and opened proper positions on either Bitcoin or altcoins.
📊 Today, it’s a bit late to open new positions because I think the market has made its main move and now we’re waiting for a correction phase to start. However, if you don’t have a position, you can enter a very risky trade on the breakout of the 103642 level.
🚨 This position is very risky and I personally won’t open it because we’re near the ATH and I think even if Bitcoin moves up to 106247, it’ll likely take a breather and won’t go straight up.
🔼 In any case, if you want to open a long position, I personally suggest waiting for a new structure to form and then look for a trigger. Otherwise, the only current trigger we have is 103642.
📉 As for a short position, you definitely know by now that with this strong bullish momentum, I’m not going to give you a short trigger. You have to wait for a proper structure for short entries.
👑 BTC.D Analysis
Let’s go to Bitcoin dominance. Yesterday dominance finally made a bearish move. It was a very sharp and one-sided drop to the 63.61 level without any corrections.
🧩 Currently, dominance is very bearish and altcoins have moved up strongly. Especially Ethereum, which after a long time made a sharp bullish move. I think as the market starts to correct, dominance will also move up and correct.
⭐ For altcoin entries, I personally wait for dominance to make a short-term upward correction and if it continues the second leg downward, I’ll enter altcoins.
📅 Total2 Analysis
Let’s move on to Total2. This index also had a sharp bullish move and after breaking 1.05, it managed to climb to 1.17.
🔔 I’ve talked a lot about the 1.05 zone and repeatedly told you to make sure you have a long position if it breaks. With that trigger activated, the Total2 uptrend has started and reached the 1.17 resistance.
✨ Currently, the only available trigger is the breakout of the 1.17 zone, and if it’s broken, we can enter another position.
📅 USDT.D Analysis
Let’s move to USDT dominance. Yesterday the 4.82 trigger was activated and dominance continued to fall. I also emphasized the 4.99 breakdown a lot and once again, I hope you’ve used the analysis and opened a position.
👀 Currently, the price has reached the 4.65 zone, which is very important and could trigger a correction. But if this zone breaks, we can open short positions.
💫 Overall, today if you notice, all the charts we analyzed seem to have made enough moves and now it’s time for a correction. However, if their triggers are activated and you don’t already have a position, you can still enter.
❌ Disclaimer ❌
Trading futures is highly risky and dangerous. If you're not an expert, these triggers may not be suitable for you. You should first learn risk and capital management. You can also use the educational content from this channel.
Finally, these triggers reflect my personal opinions on price action, and the market may move completely against this analysis. So, do your own research before opening any position.
