TradeCityPro | Bitcoin Daily Analysis #72👋 Welcome to TradeCity Pro!
Let’s move on to Bitcoin analysis and the major crypto indexes. As usual, in this analysis, I’ll be reviewing the New York futures session triggers for you.
🔄 Yesterday’s Analysis
In yesterday’s analysis, I gave you a long trigger and said that if the price is supported at the 92007 area and moves toward 94283, you can enter the position after the breakout. This has happened now, and a few hours ago a candle closed above this area. Now we’ll have to see whether the price movement will continue or if it was a fakeout.
⚡️ Nothing else special has happened and for now, only the trigger is active. Personally, since I already had a Bitcoin position open, I opened this one on an altcoin instead, but Bitcoin was a better choice because dominance is rising again, and if you didn’t already have a position on Bitcoin, it would’ve been better to open one there.
Let’s get into the analysis to see how the market looks today.
⏳ 1-Hour Timeframe
As you can see, I placed a Fibonacci Extension over the bullish leg that started after the breakout of the 85550 level, and the 0.236 Fibonacci level overlaps with the 92007 level, where the price was supported.
💥 When the price rises from the 0.236 Fibonacci level, it means the trend strength is very high, and the price can easily start the next bullish leg. As you can see, that’s exactly what happened—the price quickly moved up to 94283 and is now above that level.
📚 So when the trend is this strong, rising from 0.236 and breaking the previous high, the next leg should start. If that doesn’t happen, it means there’s significant weakness in the uptrend. So if the price doesn’t move upward today and falls back below 94283, it would indicate strong trend weakness, and the likelihood of deeper corrections to lower Fibonacci levels like 0.382 or 0.5 will increase.
📈 For longs, as I told you yesterday, you can enter on the breakout of 94283, which is now active, but the price hasn’t started its move yet. So if you haven’t entered on this trigger, you can enter on a pullback to this level.
🔽 For shorts, even though I said a move back below 94283 would indicate significant weakness, always remember that weakness doesn’t mean trend reversal—it’s just a sign.
We confirm the trend reversal with a break of 92007 and the formation of lower lows and highs under this support. This would be the first short trigger and is considered quite risky.
📊 If you look closely, market volume has increased after the breakout. This shows a battle between buyers and sellers, and we need to see which side wins so we can join the winning team.
🧩 Also, pay attention to the RSI oscillator today. If RSI enters Overbought again, there’s potential for another sharp bullish move.
👑 BTC.D Analysis
Let’s look at Bitcoin dominance. BTC.D finally tested the 64.12 level and was supported there. Because of this volatility and the V-pattern formed in dominance, most altcoins activated their long triggers. But as dominance started rising again, altcoins fell back below their resistance levels, and if you had opened positions, there was a high chance you hit stop-loss. We can see this more clearly in the Total2 chart.
✔️ For BTC.D to continue rising, confirmation of the V-pattern through a breakout of 64.41 could act as a good trigger, with a move up to at least 64.60. However, the main trigger for the next bullish leg in BTC.D is a breakout above 64.60.
📅 Total2 Analysis
Let’s look at Total2. As I mentioned, most altcoin triggers were activated but didn’t follow through, and some even dropped and returned to their lows. This can be seen in Total2 as well.
✨ The reason for this is that money initially flowed into altcoins, activating their triggers. But simultaneously, Bitcoin’s trigger was also activated, and since BTC dominance rose, not much volume flowed into altcoins. That’s why Total2 is currently ranging around its 1.04 trigger level.
🔍 Regarding Total2, just like Bitcoin, this index was supported at the 0.382 Fibonacci level and activated its trigger at 1.04. A bounce from 0.382 indicates strong bullish trend momentum. (Bitcoin bounced from 0.236, which means BTC has an even stronger uptrend than Total2.)
🎲 So once the 1.04 trigger is activated, considering the strong trend momentum, a strong uptrend should start. If this doesn’t happen in the next few candles, the price will likely fall back below 1.04, and bearish momentum could enter the market.
📅 USDT.D Analysis
Let’s look at Tether dominance. As I’ve said in previous analyses, I believe the market is still moving in sync with USDT.D, and now it’s waiting for the 5% level to be broken.
🔑 That’s why Bitcoin and Total2 have both activated their triggers but haven’t started their major moves yet. In this bullish cycle, USDT dominance appears to have more weight than other indicators. I think the entire market is waiting for the 5% level in this index to break so that capital flows into Bitcoin and altcoins.
🔼 I recommend that if the 5% level breaks, be sure to have at least one long position open.
❌ Disclaimer ❌
Trading futures is highly risky and dangerous. If you're not an expert, these triggers may not be suitable for you. You should first learn risk and capital management. You can also use the educational content from this channel.
Finally, these triggers reflect my personal opinions on price action, and the market may move completely against this analysis. So, do your own research before opening any position.
Tradingview

TradeCityPro | ALGO: Key Levels in RWA Coin’s Bullish Revival👋 Welcome to TradeCity Pro!
In this analysis, I’m going to review the ALGO coin for you. This project is one of the RWA (Real World Assets) crypto initiatives, which saw significant growth during the recent hype around this category.
💫 Currently, the market cap of this project stands at $1.99 billion, placing it at rank 47 on CoinMarketCap among crypto projects.
📅 Daily Timeframe
As you can see in the daily timeframe, ALGO has had a notable bullish leg that started from the 0.1085 level and continued up to 0.5138, marking a significant upward move.
💥 However, after reaching that level, the first corrective phase took place down to the 0.3267 support. After breaking this zone, the price continued falling to the 0.1602 support, which also overlaps with the 0.786 Fibonacci level.
🔍 After finding support there, a new high formed at 0.2147, and thanks to the strong buying volume and bullish candles, this resistance has been broken, and price is now heading upward.
📊 The RSI oscillator is currently very close to the Overbought zone, and if it enters that area, we might see some high-volatility moves, increasing the likelihood of sharp bullish candles.
📈 The next resistance levels above are 0.2553 and 0.3267, which align with the 0.5 and 0.382 Fibonacci levels respectively. If price can break through these levels and return to 0.5138, the chances of breaking that top will be significantly higher this time.
✨ On the other hand, if this breakout turns out to be a fake move and price falls below 0.2147, heavy bearish momentum could enter the market, greatly increasing the risk of breaking the 0.1602 level.
🎲 If the market continues to drop, the next major support to watch is 0.1085, which stands as the most critical support for ALGO.
📝 Final Thoughts
This analysis reflects our opinions and is not financial advice.
Share your thoughts in the comments, and don’t forget to share this analysis with your friends! ❤️

SOL in coming weeksThe SOL will increase $150 and reach to the top of the wedge in the coming weeks .
Give me some energy !!
✨We spend hours finding potential opportunities and writing useful ideas, we would be happy if you support us.
Best regards CobraVanguard.💚
_ _ _ _ __ _ _ _ _ _ _ _ _ _ _ _ _ _ _ _ _ _ _ _ _ _ _ _ _ _ _ _
✅Thank you, and for more ideas, hit ❤️Like❤️ and 🌟Follow🌟!
⚠️Things can change...
The markets are always changing and even with all these signals, the market changes tend to be strong and fast!!

Say hello to the 75-cent Dogecoin!So if you pay attention to the DOGECOIN chart you can see that the price has formed a Ascending FLAG which means it is expected to price move as equal as the measured price movement.( AB=CD )
NOTE: wait for break of the FLAG .
Give me some energy !!
✨We spend hours finding potential opportunities and writing useful ideas, we would be happy if you support us.
Best regards CobraVanguard.💚
_ _ _ _ __ _ _ _ _ _ _ _ _ _ _ _ _ _ _ _ _ _ _ _ _ _ _ _ _ _ _ _
✅Thank you, and for more ideas, hit ❤️Like❤️ and 🌟Follow🌟!
⚠️Things can change...
The markets are always changing and even with all these signals, the market changes tend to be strong and fast!!

Bearish Reversal in Play! | Key EMA Rejection & Support Targets🔍 Chart Analysis Summary
🕐 Timeframe: Likely a short-term (H1 or H4) chart.
📈 Asset: Most probably XAU/USD (Gold) or a similar asset.
🔴 Trend Breakdown
📍 Previous Trend:
✅ Strong bullish momentum 📈 pushing price into a resistance zone.
📍 Current Price Action:
🚨 Bearish rejection from resistance 🟥
Price got rejected exactly at the resistance zone (gray box) and the EMA 50 line 🔴 — a classic setup for a reversal ⚠️
📉 Key Technical Levels
🟦 Resistance Zone:
🔹 Between 3,385 – 3,400 USD
🧱 This zone rejected price strongly (see red candles)
📌 Also aligned with EMA 50 (3,400.837) — confluence adds strength 💪
🟩 Support Zones:
First Support Zone – ~3,285 📉
💙 In line with the EMA 200 (3,285.687)
🛡️ Might cause a temporary bounce 📈
Second Support Zone – ~3,240
📉 Marked as the deeper support in the bear case 🕳️
💥 If the first support breaks, this becomes the next target 🎯
📊 Indicator Insights
EMA 50 (🔴 Red): 3,400.837 – acting as dynamic resistance 😤
EMA 200 (🔵 Blue): 3,285.687 – acting as dynamic support 🛡️
📉 Price breaking below EMA 50 = first bearish sign
📉 Approaching EMA 200 = watch for either a bounce 🏀 or a breakdown 💥
🎯 Bearish Setup Forecast
📉 Here's what the arrows show (strategy logic):
📉 Breakdown below resistance → strong bearish move
🎯 Target 1: First support (EMA 200 / ~3,285)
🔄 Minor pullback possible (fake bounce 🪃)
💣 Continuation lower toward next support (~3,240)
📌 Critical Zone to Watch 🔍
⚫️ The circle marked “FOCUS ON THIS POINT” is key:
📌 Failed retest = confirmation of resistance
📌 Price rejected this level + closed below = strong bearish signal 🚨
🧠 Professional Insights
Element Observation Emoji
Trend Shift Bullish ➡️ Bearish reversal 🔄📉
Momentum Bearish pressure increasing 💨🟥
Risk Point Resistance near EMA 50 ⚠️🧱
Trade Idea Short toward supports 📉🎯
Confirmation Rejection candle after retest 🕯️🔁
Focus Level EMA confluence near resistance 🎯📌
🛠️ Possible Trade Plan (for educational purposes only)
Short Entry: Below 3,385 (after rejection 🔻)
Stop-Loss: Above 3,405 (above EMA 50 🛑)
Target 1: 3,285 🧲
Target 2: 3,240 📉

GOLD - where is today support ? What's next??#GOLD.. market perfectly moved as per our last idea and now again market have a immediate supporting area that is around 3343
Keep close and if market hold it in that case we can expect bounce above that.
Good luck
Trade wisely

The next trade idea for “6B” GBPUSD FX FuturesCME:6B1!
This trade idea is built on very simple premises.
Simplicity in trading is what we all strive for. Where possible, we should aim to simplify our strategies rather than complicate them with excessive information—unless the additional inputs add clear, actionable value to the trade thesis. While that holds true in this analysis, for the sake of clarity and simplicity, we’ve chosen not to include volume profile study or levels derived from volume profiling.
Also, don’t forget to check out how our example trade idea in Crude Oil played out —posted earlier this Tuesday.
6B Weekly Time frame:
Key Levels
Weekly Resistance: 1.3400 – 1.3425
Daily Double Top: 1.3425
April 21 Mid: 1.3350
April 2025 Developing Mid: 1.3067
Scenario 1: Break and Continuation
In this scenario, we anticipate further upside in 6B futures and GBPUSD. A break above the double top at 1.3425 could lead to a push toward 1.3550. Look for confirmation across other FX futures and signs of Dollar weakening to support this thesis.
Example Trade Idea 1:
Entry: 1.3425 (wait for an hourly candle to close above the double top, then enter on the pullback)
Stop: 1.3350
Target: 1.3550
Risk: 75 ticks
Reward: 125 ticks
Risk/Reward Ratio: 1.7 R
Scenario 2: Swing Failure on Weekly Timeframe
Zooming out to the weekly timeframe, 1.3425 aligns with a potential swing failure at prior resistance near 1.3423. A pullback from this level could provide a short opportunity. Watch for Dollar strength and pullbacks in 6E and 6J to further support this thesis.
Example Trade Idea 2:
Entry: 1.3350 (wait for sellers to regain control at Monday’s mid)
Stop: 1.3425
Target: 1.3067
Risk: 75 ticks
Reward: 283 ticks
Risk/Reward Ratio: 3.7 R
Important Notes:
These are example trade ideas provided strictly for educational purposes and should not be considered trade recommendations.
Traders are encouraged to perform their own independent analysis and thorough preparation before entering any positions.
Please note: Stop losses are not guaranteed to execute at specified levels. Actual losses may exceed predetermined stop amounts.

GOLD - at CUT N REVERSE region? what's next??#GOLD. market perfect move as per our analysis and now market just reached at his CUT N REVERSE level
that is around 3305-06 to 3312
keep close that area because if market hold that area in that case you can see another bounce from here otherwise not at all.
so Note that below 3312 we will go for cut n reverse on confirmation.
GOOD LUCK
TRADE WISELY

TradeCityPro | Bitcoin Daily Analysis #71👋 Welcome to TradeCity Pro!
Let’s dive into the Bitcoin analysis and key crypto indicators. As usual, I’ll review the futures triggers for the New York session.
🔄 Yesterday’s Recap
In yesterday's analysis, I mentioned that the main triggers had already been activated, and it might be too late to enter a position. However, you could still enter trades using momentum triggers such as RSI and SMA.
⚡️ As we can see, the RSI oscillator, after exiting the Overbought zone, triggered a bearish divergence and has now dropped below level 50. This means the RSI trigger has not yet been activated, and the price didn't pull back to the SMAs either — instead, it broke below them and entered a short-term correction.
⏳ 1-Hour Timeframe
In the 1-hour timeframe, we can see that the price was rejected from the key resistance at 94,283 and dropped to the 92,007 zone.
✔️ The SMA99 is getting closer to the price, and we might see a pullback to this level. If this happens and the price builds a structure after the pullback, it could offer a good long entry during the correction.
📈 The main long trigger remains the breakout above 94,283, which would signal the start of the next bullish leg.
✨ For a healthier trend structure, the price might undergo a deeper correction, increasing the chances of a pullback to the SMA99 scenario playing out.
📊 However, note that during the drop to 92,007, selling volume increased, which is not favorable for the bullish trend. So, if you're planning to enter a long during this correction, make sure selling volume is decreasing and buying volume is rising.
🔽 For short positions, as mentioned in previous analyses, we must wait for a confirmed trend reversal. Currently, there is no trigger indicating a downtrend, and we need to wait for a new structure.
👑 BTC.D Analysis
BTC dominance is still climbing and moving toward the 64.60 resistance level. If it stabilizes above this level, it could initiate the next bullish leg for BTC dominance.
💥 For a bearish BTC.D scenario, either rejection from 64.60 or a breakdown below 64.12 would be appropriate triggers.
📅 Total2 Analysis
Total2 is showing a deeper correction compared to BTC, aligning with the increasing BTC dominance. It has corrected down to the 0.382 Fibonacci level.
🔼 For long positions, a breakout above 1.04 is a good trigger — but be sure to watch BTC.D to decide whether to go long on Bitcoin or altcoins.
⭐ As for shorts, like other charts, we need to wait for a confirmed trend reversal before considering a short position.
📅 USDT.D Analysis
This chart is also correcting, and after finding support at 4.99, it is now retracing upward and sits near 5.13.
💫 For the downtrend in USDT.D to continue, a break below 4.99 is crucial. If it holds below that level, the overall crypto market can continue moving upward.
❌ Disclaimer ❌
Trading futures is highly risky and dangerous. If you're not an expert, these triggers may not be suitable for you. You should first learn risk and capital management. You can also use the educational content from this channel.
Finally, these triggers reflect my personal opinions on price action, and the market may move completely against this analysis. So, do your own research before opening any position.

Symmetrical Triangle Breakout Attempt! 📈 OMXSTO:B3 - Symmetrical Triangle Breakout Attempt! 📐
✅ OMXSTO:B3 has broken out of a symmetrical triangle pattern.
🔴 Next hurdle: Needs to break and close above the red resistance zone for further upside.
🎯 Potential target: Green line level if the red resistance is broken! 🚀

TradeCityPro | ICP: Breakout Watch in Web3 Veteran’s Price Range👋 Welcome to TradeCity Pro!
In this analysis, I’m going to review the ICP coin for you. The Internet Computer project is one of the older projects in the crypto space, focused on Web3 and gaming.
⚡️ The coin currently has a market cap of $2.65 billion, placing it at rank 36 on CoinMarketCap.
⏳ 4-Hour Timeframe
As you can see in the 4-hour timeframe, a range box has formed between the levels of 4.648 and 5.239, and the price has currently reached the top of the range.
✔️ During this upward leg from the bottom of the box, market volume has been increasing, which indicates that the probability of breaking through 5.239 is high.
🔍 If 5.239 is broken, we can enter a long position. The next resistance levels are at 5.558 and 6.313.
✨ There’s also a larger range box between 4.648 and 6.313, and as long as the price stays above 4.648, we can say that this broader range is valid and price is fluctuating within it.
📉 To open a short position, wait for the break of 4.648. The momentum in higher timeframes for this coin is bearish, so if this level breaks, the trend may continue downward with another leg to the downside.
📊 For that to happen, selling volume must increase, so that when 4.648 breaks, there is no volume divergence, ensuring a healthy continuation of the trend.
📝 Final Thoughts
This analysis reflects our opinions and is not financial advice.
Share your thoughts in the comments, and don’t forget to share this analysis with your friends! ❤️

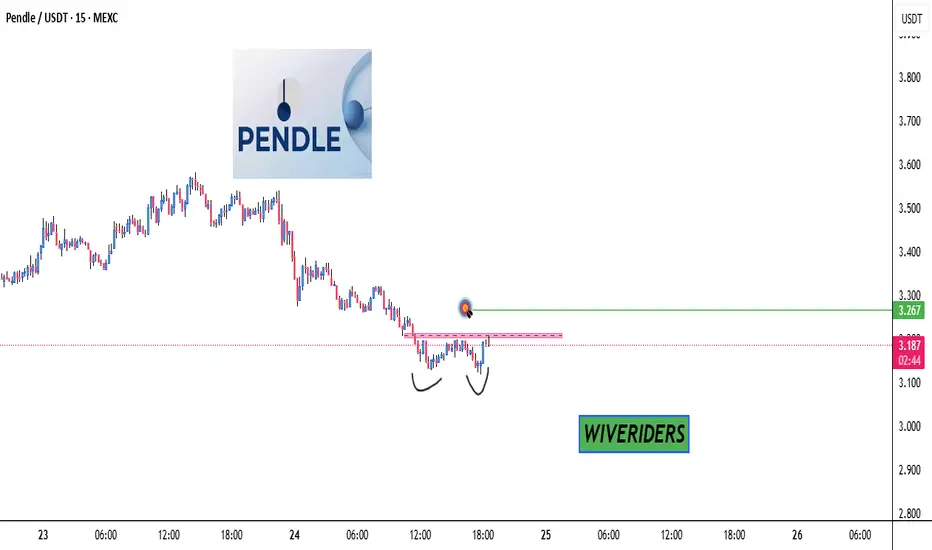
Double Bottom Breakout Watch! 📈 CRYPTOCAP:PENDLE - Double Bottom Breakout Watch! 👀
⏳ On the lower timeframe, CRYPTOCAP:PENDLE has formed a double bottom pattern.
🔴 Confirmation needed: Break and close above the red resistance zone.
🎯 Target: Green line level on a successful breakout! 🚀
Resistance Watch📈 $TRUMP Analysis: Resistance Watch 🔴
$TRUMP has formed a key red resistance zone.
A breakout above this zone could signal potential trend continuation. 🚀
Keep an eye on volume for confirmation!
Remember that this coin is highly volatile.

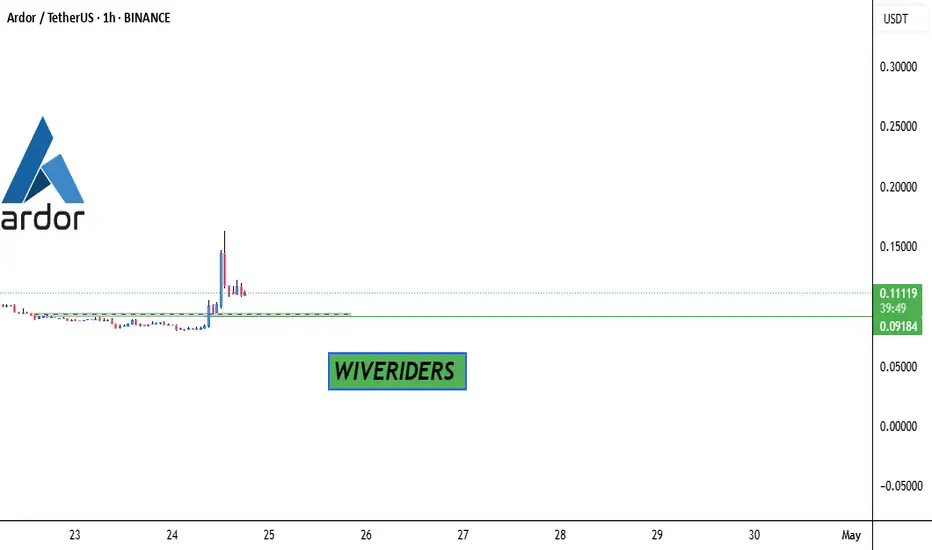
Waiting for Green Light!🚀 SEED_DONKEYDAN_MARKET_CAP:ARDR - Waiting for Green Light! 🚦
📈 Price pumped, now observing for a pullback to the green zone (potential support). 👀 Looking for a solid entry for the next leg up! ⬆️
1000SAT Trade Setup – Neckline Retest📊 1000SAT Trade Setup – Neckline Retest 📈
🔹 Current Action: Pulling back to Green Neckline (Inverted H&S) 🟢
✅ Confirmation: Break & Close Above Red Resistance Zone 🔴
🎯 Target: Green Line Level 🚀
⚠️ Invalidation: Breakdown Below Green Neckline 👇

BTCUSDT- high placed? What's next??#BTCUSDT - well after a fantastic bull run market placed a reasonable high in yesterday,
Keep close that region b cause if market hold it in that case we can expect a drop from here.
Good luck
Trade wisley

TradeCityPro | Bitcoin Daily Analysis #70👋 Welcome to TradeCity Pro!
Let’s dive into Bitcoin and major crypto index analysis. As usual, in this analysis I’ll review the futures triggers for the New York session.
🔄 Yesterday’s Analysis
Yesterday, the price broke through the 88502 level, which was our main trigger for a bullish move. The price then made a very sharp upward move and even broke the next resistance at 92000, now heading toward 95307.
✔️ I also mentioned the RSI, saying if it enters the Overbought zone again, we could see a sharp leg toward 92000—and that’s exactly what happened, with strong upward movement.
🧲 I hope you opened a position, because all the triggers of my strategy were activated yesterday: the fake break of 84363, the breakouts of 85126, 85550, and 88502. These were the key trend-starting triggers, and I made sure to be in a position as those sharp candles formed to profit from the move.
🎲 So today it’s a bit harder to open new positions, which is natural, because 4 main triggers have already been activated. But I’ll try to share any new ones if they appear.
⏳ 1-Hour Timeframe
As you can see, we witnessed a very sharp move, with price consistently in Overbought, and now just exiting that zone.
⚡️ The triggers I can give today aren’t really based on support/resistance breaks. If you’re going to open a position, you should enter with minimum risk and based on momentum. That is, if you see bullish momentum coming in, go long.
☘️ You can use the SMA indicator or RSI oscillator for this. The price has pulled back multiple times to SMA7, and moved again with confirmation candles. You can also use this strategy with pullbacks to SMA25 or SMA99.
💥 The RSI is also a momentum oscillator, and if it re-enters Overbought, we could see more upside just like yesterday.
📊 In both strategies, make sure buying volume is increasing, and there is no volume divergence. Again, note that the main triggers have already been activated, and I believe the market needs to create a new structure before new entries. So today’s trigger is quite risky, and I personally won’t open a new position because I’m already in from lower levels.
🚀 If you, like me, have one or more open positions from lower levels, I recommend taking partial profit. If you have one position, take 40–50% off. If you have more than one, maybe close one entirely but keep at least one open.
👑 BTC.D Analysis
Let’s check Bitcoin dominance. Yesterday, with Bitcoin’s strong price action, dominance dropped slightly and was rejected at the 64.60 ceiling. That’s why some altcoins—especially in the DeFi category—saw strong rallies, and you could’ve opened positions on them.
💫 The next support is around 64.12, and I think BTC.D could drop to that level. A bullish trigger for dominance remains a break above 64.60.
📅 Total2 Analysis
In previous updates, I emphasized the 980 resistance level. I told you to try and have a long position ready if this level broke. As you can see, that’s exactly when the sharp move began. Now, even 1.02 has been broken, and Total2 is moving toward 1.04.
🔼 For long entries, confirmation from Bitcoin’s chart is more reliable since this index is highly correlated with BTC and is better for identifying targets or entries.
📅 USDT.D Analysis
As mentioned before, if 5.39 breaks in USDT.D, you should have a position ready. That level broke cleanly, gave entry triggers on the breakout, pullback, and break of pullback’s low, and then dropped sharply to 4.99.
🧩 Right now, USDT.D has reacted to 4.99 support, and I think the psychological 5% level has a strong impact here. I still believe the market is heavily dependent on Tether dominance, and if this support breaks, we could see another bullish leg in the market.
❌ Disclaimer ❌
Trading futures is highly risky and dangerous. If you're not an expert, these triggers may not be suitable for you. You should first learn risk and capital management. You can also use the educational content from this channel.
Finally, these triggers reflect my personal opinions on price action, and the market may move completely against this analysis. So, do your own research before opening any position.

XAU/USD: New ATH ~ $3500, What's Next? (READ THE CAPTION)Upon reviewing the 15-minute gold chart, we can see that the price once again reached a new high today, rallying up to the key psychological level of $3500. Following this move, gold has experienced a pullback down to $3423 so far. If the price stabilizes below $3442, we will likely see a further correction toward the next target at $3411. (This analysis will be updated)
Please support me with your likes and comments to motivate me to share more analysis with you and share your opinion about the possible trend of this chart with me !
Best Regards , Arman Shaban

TradeCityPro | TON: Eyeing Breakout in Telegram’s Hottest Token👋 Welcome to TradeCity Pro!
In this analysis, I want to review the TON coin for you. This coin is for the Telegram social network, and in 2024, due to airdrops like Notcoin and Hamster that trended, it became very hyped and widely talked about, and the TON blockchain experienced significant growth.
🔍 Currently, the NFT market has also launched on this network, which has prevented this coin from dropping. This coin, with a market cap of $7.78 billion, is ranked 18th on CoinMarketCap.
⏳ 4-Hour Timeframe
In the 4-hour timeframe, as you can see, after the downtrend that the price had, there was a bullish move following the news of Pavel Durov going to Dubai and leaving France, and now the price is in a correction phase again.
⚡️ Currently, a 4-hour range box has formed, with the bottom of this box at the 2.851 zone and the top at 3.216. There's also a mid-line within this box at 3.044, which the price has broken and is moving toward the 3.216 ceiling.
✔️ If the price movement continues toward the top of the box with this momentum and high buying volume, the likelihood of breaking the 3.216 area will increase significantly. So I suggest that with the breakout of this level, you try to have a long position open.
📉 For a short position, if the price gets rejected from the top of the box, you can enter a trade with a trigger on a lower timeframe. Otherwise, the first trigger is the break of 3.044, and the second trigger is the break of 2.851.
🔼 For a long position, the RSI oscillator is near the Overbought area, and if it enters Overbought, we can expect a sharp bullish move.
📊 Market volume is currently in favor of buyers and is increasing. If volume increases and RSI enters Overbought, you can place a stop buy order above the 3.216 level so that if there is a sharp breakout of this level, your position gets triggered as well.
📝 Final Thoughts
This analysis reflects our opinions and is not financial advice.
Share your thoughts in the comments, and don’t forget to share this analysis with your friends! ❤️

GOLD - at his fresh resistance ? What's next??#GOLD... perfect drop below our area as we told youabout CUT N REVERSE.
now market have 3328 to 3332 region as a current resistance region.
And market dropped 200 points around in 2 days (almost 1 day and 1 hour)
So keep close your region because if market holds that then further drop expected.
Good luck
Trade wisely

BTC has just bounced, game a long entry from weekly support..110
“🔍 BTC has just bounced off our weekly support—here’s why I’m eyeing $110k next…”
Analysis bullets:
🛑 Risk: stop-loss around $78–80k (weekly close below red band)
▶️ Entry: current weekly close above the descending trendline
🎯 Target: $110k resistance (green zone)
Call to action:
“What do you think — will we break out or retest lows? Comment below! 👇”

Planning the Trade: Crude Oil Scenarios in a Shifting Macro LandNYMEX:CL1!
In volatile times, both opportunities and risks increase. Traders gain the ability to be more selective, adapting to new market regimes by adjusting risk and trade management strategies. Key tools in this process include indicators such as the Average True Range and Close-to-Close volatility sigma bands. April 20, 2020: A historic day, WTI Crude Oil prices traded negative for the first time, and we have yet another volatile April.
"If you fail to plan, you are planning to fail." Preparation is essential before taking on the market head-on.
Many participants choose to stay on the sidelines when volatility exceeds 1 standard deviation. Others, however, see this as an opportunity—adapting their risk per trade, adjusting targets, and refining trade management. Reducing position size can be an effective way to manage periods of heightened volatility.
This Week's Trade Idea: Crude Oil
We'll be reviewing Crude Oil price action with updated levels, fresh insights, and framing a trade plan with an example idea for reference.
Key Levels:
• April Monthly Open: 70.75
• 2025 mCVPOC: 71.13
• Yearly Open: 69.64
• 2024 Mid: 69.52
• 2025 Developing Mid: 66.52
• 2025 mCVAL: 65.08
• March 2025 Low: 64.37
• 2022 CVAL: 61.60
• 2024 Low: 59.91
The recent announcement of reciprocal tariffs, coupled with OPEC+ production plans (though scheduled earlier), and the rising uncertainty around a possible recession, have collectively weighed on demand expectations—resulting in a significant decline in oil prices. Although the 2024 low was reclaimed and prices have remained above this level, the sustainability of this recovery remains uncertain.
Scenario 1: Push Higher Towards 2025 Mid
In this scenario, we anticipate prices closing above March lows. Price then pushes higher toward the 2025 developing mid-range, re-entering the 2025 micro composite value area (mCVA).
Example Trade Idea:
• Timeframe: Hourly
• Setup: Wait for a candle close above March lows. Look for a pullback reaction off the 2025 Value Area Low (VAL).
• Entry: 64.50
• Stop: 64.00
• Target: 66.50
• Risk: 50 ticks
• Reward: 200 ticks
• Risk/Reward Ratio: 4R
________________________________________
Scenario 2: Range-Bound Price Action
In this scenario, the March low acts as strong resistance, aligning with the 2025 mCVAL. Price reverts lower towards the 2022 CVAL.
Example Trade Idea:
• Setup: Watch for signs of buyer exhaustion near March lows. If sellers regain control, look for a move back down toward 2022 CVAL.
• Timeframe: Hourly
• Entry: 64.00
• Stop: 64.40
• Target: 62.00
• Risk: 40 ticks
• Reward: 200 ticks
• Risk/Reward Ratio: 5R
________________________________________
Important Notes:
These are example trade ideas provided for educational purposes and are not intended as trade recommendations. Traders should perform their own analysis and thorough preparation before entering any positions.
Please be aware that stop losses are not guaranteed to trigger at the specified levels, and actual losses may exceed predetermined stop levels.
________________________________________
Glossary:
• VA: Value Area
• VPOC: Volume Point of Control
• VAL: Value Area Low
• C: Composite (used as a prefix: VA, VAL, VAH, VPOC, etc.)
• mC: micro Composite (used as a prefix: mCVA, mCVAL, etc.)

TradeCityPro | Bitcoin Daily Analysis #69👋 Welcome to TradeCity Pro!
Let’s dive into the Bitcoin analysis and key crypto indices. As usual, I’ll walk you through the futures session triggers for New York.
🔄 Yesterday’s Analysis
In yesterday’s analysis, the 87562 trigger was activated and could have been used to open a long position. Initially, this trigger was faked out with a large candle pulling the price back below the level. However, after a pullback to the SMA25, strong bullish momentum entered the market, and 87562 was broken.
⚡️ The next resistance that the price reacted to was 88502, where several candles stalled just below this level. Now it looks like the price is attempting to stabilize above it.
⏳ 1-Hour Time Frame
As you can see, after the breakout of 87562, a solid bullish momentum entered the market, and volume also increased. The RSI oscillator has been hovering near 70, which has supported a gradual upward move. Currently, the price has broken above 88502.
✔️ At the moment, the price trigger is considered active, and there are no significant resistances immediately ahead. However, since RSI hasn’t yet entered Overbuy, the kind of strong momentum that can push the price toward 92000 hasn't fully kicked in — and that’s why we haven’t seen a big sharp candle yet.
💡 For a long position, keep a close eye on the break of RSI 70. If RSI breaks this level, it could trigger a strong upward move to 92000, and you’ll want to be positioned for that.
🔽 For a short position, as I’ve mentioned before, we still need to wait for a clear trend reversal and the emergence of bearish momentum. Personally, I won’t open any shorts until that happens — no active short triggers at the moment.
👑 BTC.D Analysis
BTC dominance continues its upward move. If it breaks above 64.60, it could extend its bullish leg further.
📈 As a result, today a Bitcoin long looks more logical than long positions on altcoins.
📅 Total2 Analysis
The Total2 index is currently breaking above 980, and alongside this move, you might consider opening a position on one of the altcoins. If the index stabilizes above 980, it could signal an opportunity for a long-term long position.
🧩 As for bearish setups, we’ll need to wait until there’s a momentum shift in the overall market.
📅 USDT.D Analysis
As I mentioned before, the entire market was waiting on the break of 5.39 in USDT.D — and that level was finally broken. Yesterday, the price pulled back to this level and then continued downward, breaking below 5.32 and even 5.24, a significant support level.
📉 Right now, I don’t have a specific trigger to offer, as the market is moving sharply. But keep an eye on altcoins, because many of them still haven’t activated their triggers yet.
❌ Disclaimer ❌
Trading futures is highly risky and dangerous. If you're not an expert, these triggers may not be suitable for you. You should first learn risk and capital management. You can also use the educational content from this channel.
Finally, these triggers reflect my personal opinions on price action, and the market may move completely against this analysis. So, do your own research before opening any position.
