TradeCityPro | Bitcoin Daily Analysis #45👋 Welcome to TradeCity Pro!
Let's dive into the analysis of Bitcoin and key crypto indices. In this analysis, as usual, I want to review the futures session triggers for the New York market.
⌛️ 1-Hour Timeframe
In the 1-hour timeframe, as you can see, the price is still within a ranging box between 86,401 and 88,480.
🔍 The price is making lower highs, and it seems that the bullish momentum has faded. However, valid triggers for both short and long positions can still be found.
✨ For a short position, you can enter if the price breaks below 86,401. In this case, the price could extend its corrective leg down to 84,734.
🔽 For a long position, you can enter if the price breaks above 88,480. This is a very important trigger and could start the next bullish leg up to 91,588.
👑 BTC.D Analysis
Let's move on to Bitcoin dominance. This dominance has formed a bit more structure, and its triggers are also close.
⚡️ If 61.63 breaks, we confirm a bearish trend, and if 61.81 breaks, we confirm a bullish trend.
📅 Total2 Analysis
Let's analyze Total2. This index also has a ranging box between 1.06 and 1.08, which can provide good trading opportunities.
💫 If 1.08 breaks, we confirm a long position for altcoins. For a short position, a break of 1.06 is suitable.
📅 USDT.D Analysis
Now, let’s analyze USDT dominance. As you can see, we are witnessing a downtrend, and now a box has formed between 5.19 and 5.05.
🧩 To confirm a bullish move in dominance, we need a break above 5.19. The bearish triggers for USDT dominance are 5.11 and 5.05.
❌ Disclaimer ❌
Trading futures is highly risky and dangerous. If you're not an expert, these triggers may not be suitable for you. You should first learn risk and capital management. You can also use the educational content from this channel.
Finally, these triggers reflect my personal opinions on price action, and the market may move completely against this analysis. So, do your own research before opening any position.
Tradingview

Skeptic | EUR/USD Breakdown: Key Levels & Trade SetupsWelcome back, guys! I’m Skeptic, and today we’re diving into a multi-timeframe breakdown of EUR/USD. We’ll analyze EURX (Euro Index) and wrap it up with some high-probability trade setups. Let’s get started! 🚀
EURX Analysis
Looking at the EURX chart, after a secondary uptrend, we’ve formed an upward channel. When price enters a channel after a sharp uptrend, it typically signals a loss of momentum, increasing the chances of a continuation of the major downtrend—which is exactly what’s happening now.
Currently, price is testing a key support at 1037.8 . This is a critical level, and if broken, we can expect further downside for EUR pairs.
EUR/USD Technical Breakdown
In the 4-hour timeframe, after the previous uptrend, EUR/USD has entered a consolidation phase. However, bearish momentum is more visible:
✔ SMA 7 is sloping downward and positioned above candles, reinforcing selling pressure.
✔ Given the EUR/USD and EURX analysis, we can afford to be more aggressive with short positions while remaining cautious with longs.
Trade Setups & Key Levels
📉 Short Setup:
Trigger: Break below 1.07124
Confirmation: RSI breaking support at 34.40 & increasing bearish momentum
Target: Next support at 1.07154
📈 Long Setup:
Trigger: Break above 1.09453
Confirmation: Strong bullish momentum & breakout of consolidation range
⚠ Important: These levels mark the highs and lows of the 4H consolidation zone, meaning whichever way price breaks, it’s likely to continue in that direction.
Thanks for sticking around until the end—drop your thoughts in the comments & let me know your setups! See you in the next analysis <3

Skeptic | DXY Showdown: Battle at 104.403Welcome back, guys! 👋I'm Skeptic
Today, we're diving deep into the DXY (U.S. Dollar Index), analyzing key levels and potential triggers.
🔍 Recap & Current Structure:
As highlighted in our previous analysis , the major daily support (0.618 Fib) held strong at 103.303 , with price reacting precisely at this level.
Currently, the DXY is testing a critical 4H resistance at 104.403 , which aligns with:
A 4H consolidation range breakout zone
A potential fakeout trap if price fails to sustain momentum
The RSI (65.92) suggests building bullish momentum, but confirmation requires a clean break above 104.403.
📈 Bullish Scenario (Long Setup):
Trigger: Break & close above 104.403
Confirmation: RSI holding above 65.92
Invalidation: Rejection + close back below 104.000
📉 Bearish Scenario (Short Setup):
Trigger: Rejection at 104.403 + drop below 103.936
Confirmation: RSI reversal below 50 + bearish 4H candle close
⚠️ Key Notes:
Fundamentals: Recent economic data favors dollar weakness—trade longs cautiously.
Risk Management: Avoid overleveraging—wait for confirmed breaks.
Stay sharp, and I’ll see you in the next analysis!

USOIL - at resistance ? What's next ??#USOIL.. market just reached at his resistance area.
Keep close it and if market thold it in that case we can see again drop from here.
Don't be lazy here..
Good luck
Trade wisely

TAO in coming days ...Currently, TAO is forming an ascending triangle, indicating a potential price increase. It is anticipated that the price could rise, aligning with the projected price movement (AB=CD).
However, it is crucial to wait for the triangle to break before taking any action.
Give me some energy !!
✨We spend hours finding potential opportunities and writing useful ideas, we would be happy if you support us.
Best regards CobraVanguard.💚
_ _ _ _ __ _ _ _ _ _ _ _ _ _ _ _ _ _ _ _ _ _ _ _ _ _ _ _ _ _ _ _
✅Thank you, and for more ideas, hit ❤️Like❤️ and 🌟Follow🌟!
⚠️Things can change...
The markets are always changing and even with all these signals, the market changes tend to be strong and fast!!

XLM in coming days ...Currently, XLM is forming an ascending triangle, indicating a potential price increase. It is anticipated that the price could rise, aligning with the projected price movement (AB=CD).
However, it is crucial to wait for the triangle to break before taking any action.
Give me some energy !!
✨We spend hours finding potential opportunities and writing useful ideas, we would be happy if you support us.
Best regards CobraVanguard.💚
_ _ _ _ __ _ _ _ _ _ _ _ _ _ _ _ _ _ _ _ _ _ _ _ _ _ _ _ _ _ _ _
✅Thank you, and for more ideas, hit ❤️Like❤️ and 🌟Follow🌟!
⚠️Things can change...
The markets are always changing and even with all these signals, the market changes tend to be strong and fast!!

TradeCityPro | Bitcoin Daily Analysis #44👋 Welcome to TradeCity Pro!
Let's dive into the analysis of Bitcoin and other important crypto indices. As usual, I want to review the futures triggers for the New York session for you.
⏳ 1-Hour Timeframe
In the 1-hour timeframe, as you can see, yesterday Bitcoin managed to stabilize above 86876 and moved up to 88480.
⚡️ Currently, the area that the price has reacted to is 86401, so I moved the 86401 line from 86876.
💥 As I mentioned yesterday, if the RSI had stayed above 70, the movement could have continued, which it did, but the RSI did not stabilize above 78.58 and we did not witness a pump.
💫 With the break of the 70 area in the RSI, the upward momentum disappeared and the corrective phase of the price began. The market volume is currently in favor of the buyers and has decreased during the correction.
🔽 Today, for a short position, you can enter a risky position with a break of 86401 because the market trend is currently upward and all short positions are considered risky for now.
📈 For a long position, we currently don't have any specific triggers sooner than 88480, and if you want to open a position sooner, you need to wait for more structure to be created and catch triggers in lower timeframes.
👑 BTC.D Analysis
Let's move on to the analysis of Bitcoin dominance, yesterday the dominance made a lower peak than 61.80 and was rejected from 61.76.
✨ Currently, a box has formed between 61.35 to 61.76, and breaking any of these areas could confirm and start the next leg.
📅 Total2 Analysis
As for Total2, as you can see, this index is doing much better than Bitcoin and has made less correction because dominance was rejected from 61.76 yesterday.
🔑 Today, I don't have a short trigger for Total2 because it's very bullish, but for a long, the trigger of 1.09 is very suitable and with a break of this area, we can witness the next bullish leg up to 1.12.
📅 USDT.D Analysis
Let's look at the USDT.D, it seems a range box is forming between 5.15 and 5.05, and breaking either of these areas could be important.
🎲 A break of 5.05 for a short, especially if it coincides with a break of 1.09 in Total2, would be very appropriate.
❌ Disclaimer ❌
Trading futures is highly risky and dangerous. If you're not an expert, these triggers may not be suitable for you. You should first learn risk and capital management. You can also use the educational content from this channel.
Finally, these triggers reflect my personal opinions on price action, and the market may move completely against this analysis. So, do your own research before opening any position.

Bitcoin (BTC/USD) – Rising Wedge Breakdown & Trading Setup 📊 Chart Overview & Market Context
The provided chart represents Bitcoin's (BTC/USD) price movement on the 1-hour (H1) timeframe, highlighting a Rising Wedge pattern. This pattern is generally bearish and signals a potential reversal or breakdown.
Over the past few trading sessions, BTC has been moving inside an ascending wedge formation, making higher highs and higher lows. However, this movement is narrowing, indicating weakening bullish momentum. As BTC approaches a critical resistance level, sellers appear to be gaining control, increasing the likelihood of a sharp decline.
This chart outlines a well-structured bearish trading setup, identifying key areas of resistance, support, stop-loss placement, and potential downside targets.
📌 Technical Analysis & Key Levels
🔹 1. Chart Pattern: Rising Wedge (Bearish Reversal Signal)
A Rising Wedge is a technical pattern characterized by:
✔ Two upward-sloping trendlines, converging over time.
✔ Diminishing bullish momentum, as higher highs become weaker.
✔ Breakdown expectation, where price typically falls below the lower support trendline.
📉 Why is this pattern important?
The rising wedge signals that buyers are losing strength and that a reversal is likely.
When price breaks below the lower boundary, selling pressure increases, leading to a strong downward move.
Traders often anticipate a breakdown from this pattern to enter short positions.
🔹 2. Resistance Level (Key Rejection Zone)
📌 Zone: 88,500 - 89,500 USD
This area has acted as a strong resistance, preventing further upside movement.
Sellers stepped in, causing the price to reject and start declining.
A confirmed rejection from this level adds bearish confluence to the setup.
🔹 3. Rising Wedge Support (Breakdown Level)
📌 Zone: 85,000 - 84,500 USD
This is the lower boundary of the wedge pattern.
If BTC closes below this level with strong volume, it confirms the breakdown.
A retest of this level as resistance after a breakdown would provide an ideal short entry.
🔹 4. Key Support Levels & Bearish Targets
Once BTC breaks down, the next areas of interest are:
📌 First Bearish Target: 80,500 - 79,500 USD
A previous demand zone where buyers previously pushed prices higher.
BTC could pause here before continuing lower.
📌 Final Target (Full Breakdown Projection): 76,802 USD
If the wedge pattern fully plays out, BTC could drop toward this level.
This aligns with a major historical support zone, where significant buying interest could emerge.
🔹 5. Stop-Loss & Risk Management
📌 Stop-Loss: 90,483 USD
If BTC moves above this level, it invalidates the bearish setup.
Keeping a tight stop-loss ensures controlled risk while maximizing potential rewards.
📉 Trading Plan: How to Trade This Setup?
✅ Short Entry Strategy:
Enter a short trade once BTC breaks below 85,000 USD, confirming the wedge breakdown.
If BTC retests the broken support (now resistance), it offers a second entry opportunity.
✅ Stop-Loss Placement:
Place a stop-loss above 90,483 USD, in case of a bullish breakout.
✅ Take-Profit Levels:
First Target: 80,500 - 79,500 USD (Support zone)
Final Target: 76,802 USD (Full wedge breakdown projection)
📌 Key Takeaways & Market Sentiment
🔸 Bearish Structure Formation: BTC is losing momentum inside a rising wedge, signaling a potential downturn.
🔸 Breakdown Confirmation Needed: A close below 85,000 USD with volume confirms the bearish trade setup.
🔸 Risk Management is Key: The stop-loss above 90,483 USD protects against invalidation.
🔸 Watch for Retests: If BTC retests the breakdown level, it can provide an ideal entry point.
🚨 Bitcoin is showing early signs of a bearish reversal! If the rising wedge breaks down, a significant decline toward 76,802 USD could follow. Traders should monitor price action carefully and execute the setup accordingly. 🚀

XAU/USD Analysis: Bearish Pullback Towards $3,000 SupportXAU/USD (Gold Spot vs. U.S. Dollar) Technical Analysis - 1H Chart
1. Price Action & Trend Analysis
The market has been in a strong uptrend, characterized by higher highs and higher lows.
Recently, the price faced resistance near the $3,040 level, leading to a rejection.
A pullback is currently in progress, suggesting a possible retracement to a demand zone.
2. Key Levels
Resistance Zone (Supply Zone): Around $3,040 - $3,045 where price has been rejected multiple times.
Support Zone (Demand Zone): Around $3,000 - $3,005, a previous accumulation area.
Current Price: $3,023.695
3. Market Structure & Expected Move
The price tested the resistance zone, failed to break above, and is now reacting downward.
A bearish projection (as shown in the chart) suggests a potential move toward the $3,000 - $3,005 support zone.
If the price reaches this level and finds buying pressure, we could see a reversal or continuation of the uptrend.
4. Indicators & Confluence Factors
Support-Resistance Flip: The previous support at $3,000 could act as a strong support again.
Bearish Momentum: Short-term price action suggests sellers are gaining control after rejection at resistance.
Liquidity Zones: The highlighted purple zones represent institutional order blocks where significant buy/sell orders exist.
5. Trading Plan & Strategy
Bearish Scenario: If price breaks below $3,000, we could see further downside pressure.
Bullish Scenario: A bounce from $3,000 could provide buying opportunities for another attempt at breaking $3,040.
6. Conclusion
The market is currently retracing from resistance, and a short-term bearish move is expected toward $3,000.
Traders should watch for price reaction at $3,000 to determine if it holds as support or breaks for further downside.

ADA Ready for PUMP or what ?Currently, ADA is forming an ascending triangle, indicating a potential price increase. It is anticipated that the price could rise, aligning with the projected price movement (AB=CD).
However, it is crucial to wait for the triangle to break before taking any action.
Give me some energy !!
✨We spend hours finding potential opportunities and writing useful ideas, we would be happy if you support us.
Best regards CobraVanguard.💚
_ _ _ _ __ _ _ _ _ _ _ _ _ _ _ _ _ _ _ _ _ _ _ _ _ _ _ _ _ _ _ _
✅Thank you, and for more ideas, hit ❤️Like❤️ and 🌟Follow🌟!
⚠️Things can change...
The markets are always changing and even with all these signals, the market changes tend to be strong and fast!!

DOT in coming days ...The pattern has broken, and now I expect the price to rise to $5.3.
Give me some energy !!
✨We spend hours finding potential opportunities and writing useful ideas, we would be happy if you support us.
Best regards CobraVanguard.💚
_ _ _ _ __ _ _ _ _ _ _ _ _ _ _ _ _ _ _ _ _ _ _ _ _ _ _ _ _ _ _ _
✅Thank you, and for more ideas, hit ❤️Like❤️ and 🌟Follow🌟!
⚠️Things can change...
The markets are always changing and even with all these signals, the market changes tend to be strong and fast!!

US100 - at support? Hold or not??#US100 - well guys market just near to his current supporting region.
That is around 19230 to 10330
Keep close that region because if market hold it in that case we can expect a bounce from here.
Good luck
Trade wisely

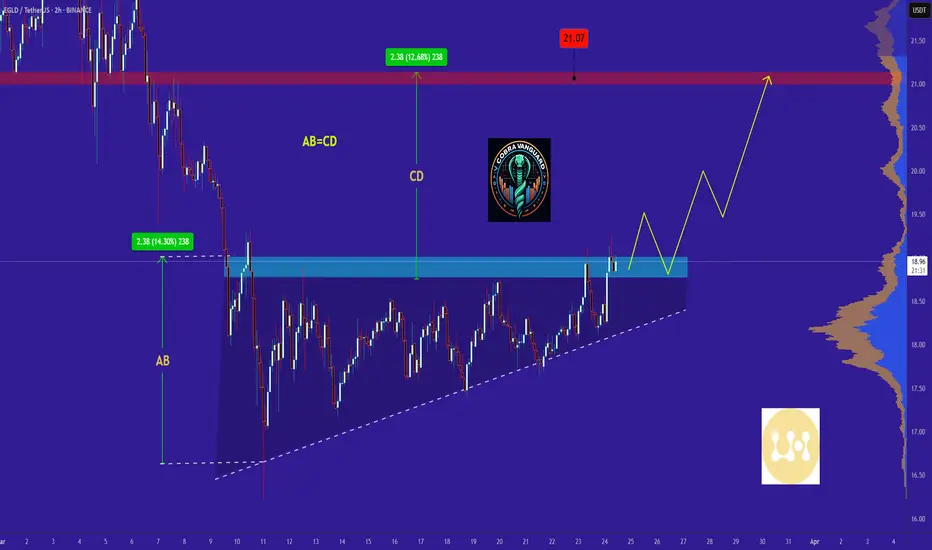
EGLD in coming days ...Currently, EGLD is forming an ascending triangle, indicating a potential price increase. It is anticipated that the price could rise, aligning with the projected price movement (AB=CD).
However, it is crucial to wait for the triangle to break before taking any action.
Give me some energy !!
✨We spend hours finding potential opportunities and writing useful ideas, we would be happy if you support us.
Best regards CobraVanguard.💚
_ _ _ _ __ _ _ _ _ _ _ _ _ _ _ _ _ _ _ _ _ _ _ _ _ _ _ _ _ _ _ _
✅Thank you, and for more ideas, hit ❤️Like❤️ and 🌟Follow🌟!
⚠️Things can change...
The markets are always changing and even with all these signals, the market changes tend to be strong and fast!!
BTCUSDT - it's breakout ? What's next??#BTCUSDT.. market just broke our resistance and going to close above that.
Keep close that because 85100 is now our supporting area and if market holds that then further bounce expected.
Note: keep in mind that below 85100 we will cut n reverse on confirmation .
Good luck
Trade wisely

TradeCityPro | Bitcoin Daily Analysis #43👋 Welcome to TradeCity Pro!
Let's dive into the analysis of Bitcoin and other key crypto indices. As usual, I want to discuss the futures triggers for the New York session.
⏳ 1-Hour Timeframe
In the 1-hour timeframe, as you can see, Bitcoin finally moved, activating our trigger, and it reached its target. Now, let's analyze today's triggers.
🔄 Yesterday, the breakout of the 84734 range box was activated, and the price made an upward move.
✔️ Currently, the price has reached 86876 and has been rejected from this area but is still above it. If it can stabilize above this area, the next price leg could start.
💥 The RSI oscillator has significant resistance at 78.58, and breaking this area could introduce a lot of momentum into the market, potentially starting a robust upward leg.
⚡️ Additionally, this oscillator has important support at 70, and if it can maintain above this area, the likelihood of breaking 86876 increases.
🔽 For short positions, we need to wait for the price momentum to turn bearish before entering in line with the trend direction.
🧩 If the price does not stabilize above 86876 and moves downward, with confirmation from Dow Theory or the activation of a fake breakout trigger, you can enter a short position.
👑 BTC.D Analysis
Let's move on to the analysis of Bitcoin dominance. Yesterday, dominance was supported at 61.35 and moved up to 61.80, which helped Bitcoin rise more than altcoins.
🧲 Currently, dominance has been rejected from 61.80 and is moving downwards. I believe a range has formed between 61.35 and 61.80, and breaking this box in either direction could determine the next leg of dominance.
📅 Total2 Analysis
Moving on to Total2, yesterday the price broke the 1.05 area and moved upwards, even surpassing 1.07. Currently, I have moved the 1.05 area to 1.06 because it is more accurate, and the price has moved away from it.
⭐ The next resistance for the price is at 1.09, and it seems that Total2 could move up to this area.
📅 USDT.D Analysis
Finally, let's look at the Tether dominance analysis. Yesterday, the 5.25 trigger in dominance was activated, and we observed a clean pullback in dominance that brought it down to 5.13.
✨ The next support for dominance is at 5.08, and we need to see if it can stabilize below this area or not.
❌ Disclaimer ❌
Trading futures is highly risky and dangerous. If you're not an expert, these triggers may not be suitable for you. You should first learn risk and capital management. You can also use the educational content from this channel.
Finally, these triggers reflect my personal opinions on price action, and the market may move completely against this analysis. So, do your own research before opening any position.

Bitcoin (BTCUSD) Falling Wedge Breakout – Bullish Setup! 📌 Overview of the Chart Setup
This daily Bitcoin (BTC/USD) chart presents a technical breakout from a falling wedge pattern, a well-known bullish reversal signal. The price has been forming lower highs and lower lows over the past months, consolidating within a tightening structure. However, the current price action suggests an early breakout attempt, which could lead to significant upside movement in the coming weeks.
Let’s break down the key levels, technical insights, and trading opportunities visible in this chart.
📉 Chart Pattern: Falling Wedge (Bullish Reversal)
🔹 What is a Falling Wedge?
A falling wedge is a bullish continuation or reversal pattern characterized by converging downward-sloping trendlines. It typically signals a loss of bearish momentum, leading to a breakout to the upside.
🔹 Key Observations in the Chart
The price has been moving inside the falling wedge structure, with clear lower highs and lower lows.
The support level around $75,000-$80,000 has been repeatedly tested, forming a strong demand zone.
A trendline breakout has occurred, suggesting that bulls are regaining control over the price action.
Volume is expected to increase upon a confirmed breakout, reinforcing the bullish momentum.
📊 Important Technical Levels
1️⃣ Support & Resistance Zones
📌 Support Level: The $75,000-$80,000 zone has acted as a strong base, preventing further downside. Buyers have stepped in multiple times here.
📌 Resistance Level: The $95,000-$100,000 range represents a historical resistance where price has struggled to break through.
2️⃣ Trendline Breakout
The chart clearly shows a breakout above the falling wedge’s upper boundary, indicating a potential trend reversal from bearish to bullish.
If this breakout holds, Bitcoin could see strong buying pressure pushing it toward its next major resistance level.
📈 Trading Strategy & Setup
🔹 Entry Confirmation
To enter a long position, traders should wait for:
✅ A daily close above the wedge resistance (confirmed breakout).
✅ A successful retest of the breakout zone, which strengthens the bullish case.
A breakout retest is ideal because it provides a lower-risk entry point, ensuring the breakout is legitimate rather than a false move.
🔹 Target Price Projection
Using the height of the falling wedge as a projection, the potential price target is set at $118,000.
This level aligns with a 35%+ upside from the breakout zone.
Bitcoin must clear the $95,000-$100,000 resistance before reaching the final target.
🔹 Stop Loss Placement
A stop loss is positioned at $59,896, slightly below the previous major support zone.
This ensures that if the breakout fails, losses are minimized while still allowing price fluctuations within expected volatility.
🔹 Risk-to-Reward Ratio
Entry around breakout level (~$87,000)
Target: $118,000 (35% upside)
Stop Loss: $59,896 (~30% downside)
Risk-to-reward ratio: ~1:3, making this an attractive trade setup.
📢 Market Psychology & Sentiment
Why This Pattern Matters?
A falling wedge represents seller exhaustion. Over time, the bearish pressure weakens, leading to a bullish breakout.
If Bitcoin can maintain this breakout, momentum traders and institutional investors may step in, accelerating the rally.
Breaking above the resistance at $95K-$100K would confirm bullish dominance, potentially leading to new all-time highs.
Potential Risks
❌ Fake Breakout: If Bitcoin fails to hold above the wedge resistance, we may see a pullback to support before another breakout attempt.
❌ Macro Factors: External factors like regulatory news, interest rate decisions, and market-wide sentiment could impact price action.
❌ Bitcoin Dominance: If altcoins start rallying, some capital may rotate out of Bitcoin, slowing the upside move.
🚀 Final Thoughts: A High-Probability Bullish Setup
✅ The falling wedge breakout suggests a strong bullish shift, with a 35%+ potential upside.
✅ A confirmed breakout above $95K-$100K will act as a final confirmation before the next leg up.
✅ Risk is managed with a stop loss at $59,896, ensuring downside protection.
🔹 Best trading approach? Wait for confirmation, manage risk, and let the trend develop.
Would you like additional insights on entry techniques, volume confirmation, or potential invalidation points? 😊

FireHoseReel | $ENA AnalysisWelcome to FireHoseReel!
Weekly Timeframe
BINANCE:ENAUSDT coin is currently at its strong demand zone on the weekly time frame, and it could potentially experience a pump from this area.
Let's check the lower time frames as well to find the best entry point!
Daily Timeframe
On the daily time frame, we have refined the weekly zone.
The price is currently at this zone, and there is significant liquidity to place targets, including liquidity voids and highs.
We also expect the start of the price's substructure phase on the daily time frame and the start of the minor phase on the weekly time frame.
4H Timeframe
On the 4-hour time frame, we are looking for our entry.
We have a demand zone where the price has reversed and turned bullish(CH).This zone also has a lot of liquidity above it, which serves as confirmation for our zone.
This zone will be a good entry point for a long trade.
Our target will be 0.5$ then 0.75$.

FireHoseReel " XVSUSDTWelcome to FireHoseReel ! ❤️
Today we're gonna dive into the XVS coin and break down what the project is all about. Stick with us
This coin has shot up 40% after breaking its upward channel, and then it had a solid climb but pulled back 50% because of profit-taking and heavy selling. It created a key demand zone, and a lot of market makers, retail traders, and exchanges have been buying in the $4.70 to $5.30 range. The next targets for this coin could be $11.50 and $12, and we could see a price increase of up to 90% !
XVSUSDT is the trading pair for the Venus token (XVS) against Tether (USDT). Venus is a decentralized finance (DeFi) protocol built on the Binance Smart Chain (BSC) that allows users to borrow and lend cryptocurrencies.
With Venus, users can supply assets to the platform to earn interest or take out loans using their crypto as collateral. The XVS token serves as the governance token for the Venus protocol, allowing holders to participate in decision-making processes related to the platform’s development and operations.
Hope you guys found these analyses useful! Wishing you all the best 🔥 Don't forget about money management and risk management. Love you all, friends ❤️

TradeCityPro | Bitcoin Daily Analysis #42👋 Welcome to TradeCity Pro!
Let's delve into the analysis of Bitcoin and other key crypto indices. As usual, I will review the futures triggers for the New York session for you.
⏳ 1-Hour Timeframe
In the 1-hour timeframe, as you can see, the price still maintains a range box between 83808 and 84734, and the market volume has decreased even more from yesterday.
📊 The less the volume, the closer we are to a price movement, so again, keep an eye on the market to ensure you don't miss any active triggers.
⚡️ For a short position, you can enter with a break of 83808, and for a long position, with a break of 84734.
👑 BTC.D Analysis
Let's move to the analysis of Bitcoin dominance. Yesterday, the support at 61.43 was broken, and it's moving towards 61.08.
✔️ Currently, I don’t have any specific triggers for confirmation in dominance, but as long as the dominance stays below 61.43, I see it continuing its downward trend.
📅 Total2 Analysis
On to the analysis of Total2, the trigger at 1.05 is about to be activated, and the price could move towards 1.07 with a break of this area.
🔽 The short trigger remains at 1.04 for now.
📅 USDT.D Analysis
Finally, looking at the Tether dominance, this index is still ranging between 5.25 and 5.34.
💫 A break of either of these areas could determine the next leg of the price movement.
❌ Disclaimer ❌
Trading futures is highly risky and dangerous. If you're not an expert, these triggers may not be suitable for you. You should first learn risk and capital management. You can also use the educational content from this channel.
Finally, these triggers reflect my personal opinions on price action, and the market may move completely against this analysis. So, do your own research before opening any position.

TradeCityPro | Bitcoin Daily Analysis #41👋 Welcome to TradeCity Pro!
Let's delve into the analysis of Bitcoin and important crypto indices. Today, as usual, I aim to review the New York session futures triggers for you.
⏳ 1-Hour Timeframe
In the 1-hour timeframe, as you can see, Bitcoin is still in a range box between 83808 and 84734, and the market volume is continuously decreasing.
📊 The market volume has reached its lowest possible level, indicating that a move is imminent, so be alert today as the likelihood of our triggers activating is very high.
🔼 For a long position, entering at a break of 84734 could be beneficial, as breaking this area could start a bullish leg up to 86876.
📉 For short positions, a break of 83808 remains suitable. Yesterday, the price briefly breached this area but seemed to rebound, making it still appropriate for positioning.
👑 BTC.D Analysis
Moving on to Bitcoin dominance analysis, as you can see, dominance was rejected from the high of 61.63 yesterday, then set a lower high compared to this area, and now the floor of 61.43 has been broken.
💫 Currently, with the break of 61.43, dominance could move down to 61.08. However, if the break of 61.43 proves to be a fake-out, the likelihood of breaking 61.63 increases.
📅 Total2 Analysis
Let’s talk about Total2; this index doesn't have a very reliable trigger right now, and you can still enter a position with a break of 1.07, but if the price reacts to 1.05, on a second contact, entering on a break of this area might be viable.
🔽 For short positions, a break of 1.04 is suitable, and you can enter a position with the break of this area.
📅 USDT.D Analysis
Lastly, analyzing Tether dominance, it is still ranging and has formed a box between 5.25 and 5.34.
✔️ For a downward trend in dominance, you can confirm with a break of 5.25, and for an upward trend, a break of 5.34 will serve as your confirmation.
❌ Disclaimer ❌
Trading futures is highly risky and dangerous. If you're not an expert, these triggers may not be suitable for you. You should first learn risk and capital management. You can also use the educational content from this channel.
Finally, these triggers reflect my personal opinions on price action, and the market may move completely against this analysis. So, do your own research before opening any position.

Did you Know ?!!!Did you really think that profiting from the current bull run (a comprehensive upward market) would be easy? Don't be naive. Do you think they will let you buy, hold, and sell at low levels without any struggle? If it were that simple, everyone would be rich. But the truth is: 90% of you will lose. Why? Because the crypto market is not designed for everyone to win. They will shake you. They will make you doubt everything. They will panic you and sell at the worst possible moment. Do you know what happens next? The best players in this game buy when there is fear, not sell; because your panic gives them cheap assets. This is how the game goes: strong hands feed off weak hands. They exaggerate every dip, every correction, every sale. They make it look like the end of the world so that you abandon everything, and when the market starts up again, you'll sit there saying, "What the heck just happened?" This is not an accident. It's a system. The market rewards patience and punishes weak emotions. The big players already know your thoughts. They know exactly when and how to stir fear to make you give up. Because when you panic, they profit. They don't play the market. They play you. That's why most people never succeed. Because they fall into the same traps over and over again. People don't realize that dips, FUD (fear, uncertainty, doubt), and panic are all part of the plan. But the winners? They digest the noise. They know that fear is temporary, but smart decisions last forever. We've seen this hundreds of times. They pump the market after you sell. They take your assets, hold them, and sell them to you at the top, leaving you with nothing, wondering how it happened. Don't play their game. Play your own.
REMEMBER

TradeCityPro | Bitcoin Daily Analysis #40👋 Welcome to TradeCity Pro!
Let's delve into the analysis of Bitcoin and important crypto indices. Today, as usual, I aim to review the New York session futures triggers for you.
⏳ 1-Hour Timeframe
In the 1-hour timeframe, as you can see, the price has pulled back to below the 84734 area again today.
🔽 The short trigger we have for today is the break of 83808. With the break of this area, the price could move downwards.
✅ The important supports are at 82459 and 80105, which we can use as targets.
📈 For a long position, entering at a break of 84734 could be beneficial, with a target at 86876.
👑 BTC.D Analysis
Moving on to the Bitcoin dominance analysis, a support was established yesterday at 61.43, creating a price box between 61.43 and 61.63.
💫 To confirm an upward trend in dominance, watch for a break of 61.63, and for a downward trend, a break of 61.43 will serve as a confirmation.
📅 Total2 Analysis
Let’s talk about Total2; this index has broken its support at 1.04, and if Bitcoin also loses its support, it could move down to 1.01 again.
🎲 If you don't have positions open, you might consider looking for altcoins that have not yet lost their support, or wait for Bitcoin.
🔼 For long positions, the trigger for Total2 remains at 1.07.
📅 USDT.D Analysis
Lastly, analyzing Tether dominance, it has come back above 5.26, pulled back to this area, and is poised to potentially initiate an upward leg to 5.46.
✔️ The upward dominance trigger for Tether is a break of 5.31. With the break of this area, we can expect dominance to potentially rise again to 5.46.
📉 For downward dominance, a break of 5.26 is a suitable trigger.
❌ Disclaimer ❌
Trading futures is highly risky and dangerous. If you're not an expert, these triggers may not be suitable for you. You should first learn risk and capital management. You can also use the educational content from this channel.
Finally, these triggers reflect my personal opinions on price action, and the market may move completely against this analysis. So, do your own research before opening any position.

Bitcoin in coming days ...frankly, Bitcoin will reach $89000 in the coming days.
Give me some energy !!
✨We spend hours finding potential opportunities and writing useful ideas, we would be happy if you support us.
Best regards CobraVanguard.💚
_ _ _ _ __ _ _ _ _ _ _ _ _ _ _ _ _ _ _ _ _ _ _ _ _ _ _ _ _ _ _ _
✅Thank you, and for more ideas, hit ❤️Like❤️ and 🌟Follow🌟!
⚠️Things can change...
The markets are always changing and even with all these signals, the market changes tend to be strong and fast!!
