BTCUSDT - single supporting area, short below .#BTCUSDT.... now we have single and immediate supporting area, that is around 110700-800
keep close and only it can stay above for further buying scenarios otherwise not.
so stay sharp and only short below that.
good luck
trade wisely
Tradingview
TradeCityPro | ADA Eyes Breakout from Bearish Channel Top👋 Welcome to TradeCity Pro!
In this analysis, I want to review the ADA coin for you. The Cardano project is one of the oldest and most popular projects in crypto.
🔍 The coin of this project has a market cap of 22.21 billion dollars and is ranked 10 on CoinMarketCap.
📅 Daily Timeframe
On the daily timeframe, ADA is moving downward within a descending channel and is currently trying to break out of the channel from the top after reaching a support zone.
⭐ One positive sign for buyers is that they didn’t let the price reach the bottom of the channel. Instead, they used the overlap between the midline of the channel and the key 0.5579 zone (marked as a support area) to stop the price from falling.
✨ However, as long as the coin is fluctuating inside this channel, the trend remains bearish. Holding the midline is not a sign of trend reversal yet, but it does indicate weakening of the current trend and may act as one of the bases for a future reversal.
✅ Looking at the RSI oscillator, we can see that each time the price tried to break the channel’s top, RSI reached the 70 area and got rejected, causing the price to drop.
⚡️ Currently, the price is very close to the top of the channel, but RSI has just broken above the 50 line and is moving upward. This is a bullish sign for buyers, as it shows there is still room for upward momentum, which increases the chance of a breakout.
🎲 The nearest trigger for confirming the breakout from the channel is the 0.7212 zone, which is a bit far, and the price will likely form a higher low and high before reaching it, confirming the breakout earlier.
💥 But based on the current data, the breakout trigger remains at 0.7212, and for spot buying, this is the first valid entry level.
👀 Personally, I’m not adding any altcoins to my portfolio right now, as Bitcoin Dominance is still in an uptrend. As long as this trend continues, large capital flows into altcoins are unlikely.
🛒 More reasonable triggers for spot entries would be a breakout above the 0.8414 supply zone. If I were to buy, I’d enter at this level. The final trigger is 1.1325, which is quite far from the current price, and if BTC Dominance continues upward, it could take several months to reach this zone.
🔽 If you already hold this coin in spot, your stop-loss can be set at a break below the 0.5579 level. A breakdown here would also provide a good short setup in futures, as the price could move toward the bottom of the box or the static level at 0.4322.
📝 Final Thoughts
This analysis reflects our opinions and is not financial advice.
Share your thoughts in the comments, and don’t forget to share this analysis with your friends! ❤️

DOGEUSDT - near support? Holds or not??#DOGEUSDT... market just reached near his supporting area even ultimate area. That is around 0.10 and current market price is around 0.15
If market holds current supporting area then we can expect a bounce from here.
Below 0.10 we will never see again bounce ... Note that.
Good luck
Trade wisely

TRBUSDT - at CUT n REVERSE Area? What's next??#TRBUSDT - market just reached at his ultimate supporting region and below that we can expect a further straight drop.
So we will cut n reverse below our mentioned region that is around 35 (region neck line)
Good luck
trade wisely

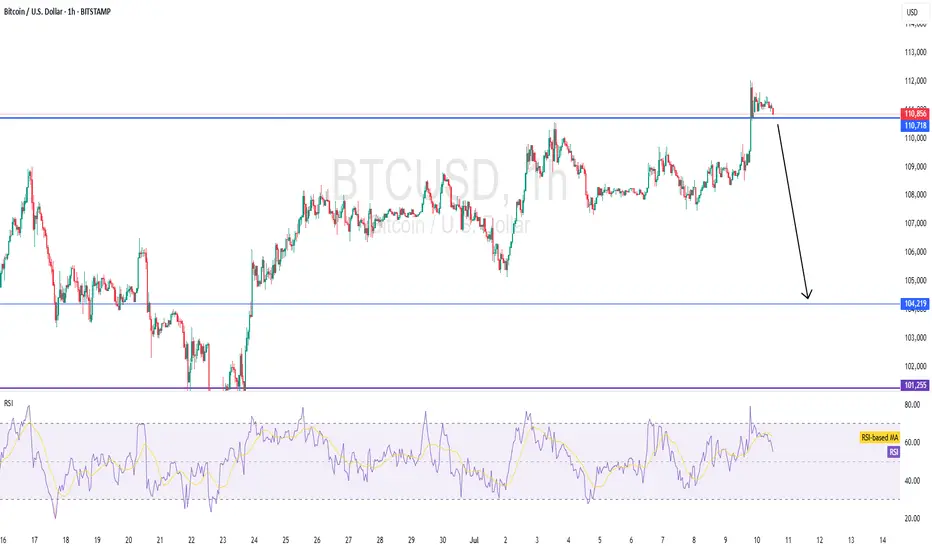
GOLD - at resistance ? Holds or not??#GOLD.. .market perfect dropped below our area that was around 3320
Now market bounced back and just near to his resistance area 3295 96
That will be market final area and only holdings of that region means another drop expected.
Note: we will plan for cut n reverse above that region.
Good luck
Trade wisely
TradeCityPro | Bitcoin Daily Analysis #123👋 Welcome to TradeCity Pro!
Let’s dive into the analysis of Bitcoin and key crypto indices. As usual, in this analysis I’ll go over the trigger levels for the New York futures session.
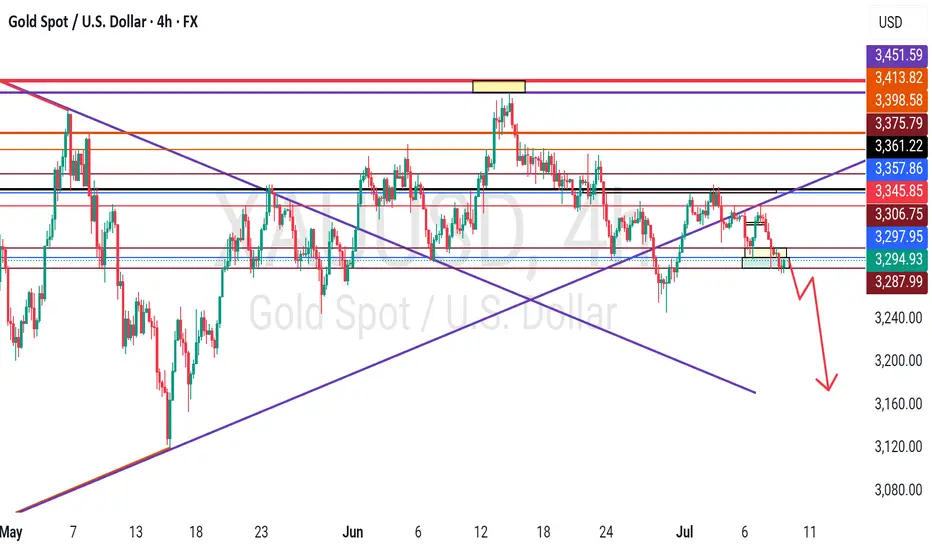
⏳ 1-Hour Timeframe
On the 1-hour chart, as you can see, Bitcoin is currently below a resistance zone at 109135 and is approaching this level with strong bullish momentum.
⭐ If the price breaks and stabilizes above this level, we can open a long position. Both the volume and market momentum are confirming this setup well, but the main long trigger remains the breakout of 109135.
📈 If this bullish move turns out to be fake and the price starts heading downward, the first trigger we have for a short position is the 107853 level. A break below this level would give us an entry for a short.
👀 Overall, I think the market has been pretty straightforward lately, and we don’t need complex tools to analyze it. Just these support and resistance levels and simple triggers are sufficient.
👑 BTC.D Analysis
Moving on to Bitcoin Dominance, the 65.04 floor has finally broken, and dominance is now trending downward.
💫 The next support ahead is at 64.81, which the price is approaching. We’ll have to see how the market reacts to this level. For now, the trend of dominance in the 1-hour timeframe appears bearish.
📅 Total2 Analysis
Let’s look at Total2. With Bitcoin Dominance dropping and Bitcoin itself moving upward, Total2 has started a strong bullish leg and is heading toward the 1.18 level.
🔑 Many of the altcoins I’ve analyzed have triggered their entries, and as long as Total2 remains bullish, these moves can continue.
📅 USDT.D Analysis
Now to Tether Dominance. After breaking below the 4.76 level, it has now reached the 4.72 floor.
💥 A break below this floor could confirm continuation of the downtrend, but in my opinion, the price may pause here for some correction and consolidation.
❌ Disclaimer ❌
Trading futures is highly risky and dangerous. If you're not an expert, these triggers may not be suitable for you. You should first learn risk and capital management. You can also use the educational content from this channel.
Finally, these triggers reflect my personal opinions on price action, and the market may move completely against this analysis. So, do your own research before opening any position.

TradeCityPro | NEAR Faces Resistance in Lower Range Zone👋 Welcome to TradeCity Pro!
In this analysis, I’m going to review NEAR, one of the AI and Layer1 crypto projects, currently ranked 35 on CoinMarketCap with a market cap of 2.77 billion dollars.
📅 Daily Timeframe
On the daily chart, NEAR has formed a large ranging box between the 1.884 and 3.548 levels and is currently positioned in the lower half of that range.
✔️ After hitting the lower boundary, the price has formed a trigger around the 2.279 level and is now fluctuating below it.
✨ A breakout above this level could give us a long entry. However, the downside is that volume is decreasing and diverging from price. If this volume drop continues, the likelihood of the range breaking to the downside increases.
📊 If volume starts to rise, considering that the RSI is stabilizing above the 50 zone, the probability of a bullish scenario becomes much stronger.
💥 The main resistance above the current price is at 3.548, which I’ve marked as a zone. In my opinion, breaking this level would be the main trigger for a spot buy, and I personally plan to wait for this level to break before buying spot.
🔔 If the price gets rejected from the 2.279 level and bearish momentum enters the market, a break below 1.884 would be a strong short trigger and could signal the start of a new bearish leg and continuation of the previous downtrend.
📝 Final Thoughts
This analysis reflects our opinions and is not financial advice.
Share your thoughts in the comments, and don’t forget to share this analysis with your friends! ❤️

GH 3D: breakout forming inside ascending channelThe price of GH continues consolidating within the top of an ascending channel, confirming bullish structure. The rectangular accumulation has lasted for over three months, with price staying above all major EMAs and MAs - a strong trend confirmation. On the last impulse, volume increased, and now the price is compressing again. A breakout with a retest would serve as a valid entry. First target lies near 61.38, second at 73.66, and third at 87.37 - aligned with the upper range of the medium-term Fibonacci extension. Fundamentally, GH remains a promising biotech pick amid sector rotation and potential Fed easing. EMAs and MAs sit below price, and D/A supports the breakout scenario. Waiting for confirmation before entering.

Negative Risk/Reward: Hidden Edge or Hidden Danger?It’s a topic that sparks plenty of debate.
👉 Can a negative risk/reward ratio actually be part of a winning strategy?
Here’s our take, split between intraday trading and swing trading:
📉 Intraday Trading
☑️ Pros:
• Can work in high‑probability setups (mean‑reversion, range scalps)
• Quick targets often get hit before stops
• Stops can sit beyond liquidity grabs to protect the trade
⚠️ Cons:
• Needs a consistently high win rate
• Prone to slippage and fast spikes
• Can lead to over‑trading if discipline slips
If used, risk must always be pre‑defined — not adjusted mid‑trade.
⏳ Swing Trading
☑️ Pros:
• Occasionally helps avoid being stopped on deeper pullbacks
• Gives breathing room in trending markets
⚠️ Cons:
• Smaller targets vs bigger stops rarely pay off over time
• Lower win rate on higher timeframes makes it hard to sustain
• Exposed to news gaps & weekend risk
Overall, swing trading works best with positive R/R setups (e.g., 2:1 or higher).
☑️ Summary:
Negative R/R can work — but only if:
• The setup is statistically proven & high probability
• You keep risk strictly pre‑defined
• It fits the pair, timeframe & volatility
Most traders are better off sticking to positive R/R — but for experienced scalpers, negative R/R can be a tool rather than a trap.
💭 Do you use negative risk/reward in your strategy?
Only intraday, or do you apply it to swing trades too?
Drop your thoughts below —we're curious to hear how others approach it! 👇
Thanks again for the likes, boosts, and follows — really appreciate the support!
Trade safe and all the best for the week ahead!
BluetonaFX

BIDU 1D: triangle breakoutBIDU 1D: triangle breakout + real-world AI deployment boosts bulls
Baidu (BIDU) breaks out of a triangle within a falling channel on the daily chart, with solid volume, reclaim of the 50MA, and approach to the 200MA. $90.09 flips into support. Targets stretch to $105.47 / $113.68 / $124.06 (Fibo levels).
Fundamentally, Car Inc just launched a robo-car rental service powered by Baidu’s Apollo unit. Fully autonomous, bookable for 4 hours to 7 days — this is not future tech, it’s live now. With a $32.6B market cap and low P/E (~12), BIDU looks positioned for revaluation if sentiment shifts.
Tactical setup: entry by market or retest of $90, stop below $82.
When the robot drives customers - you just drive the trade.

TradeCityPro | Bitcoin Daily Analysis #122👋 Welcome to TradeCity Pro!
Let’s dive into the latest analysis of Bitcoin and major crypto indicators. As usual, this update will focus on potential triggers for the New York futures session.
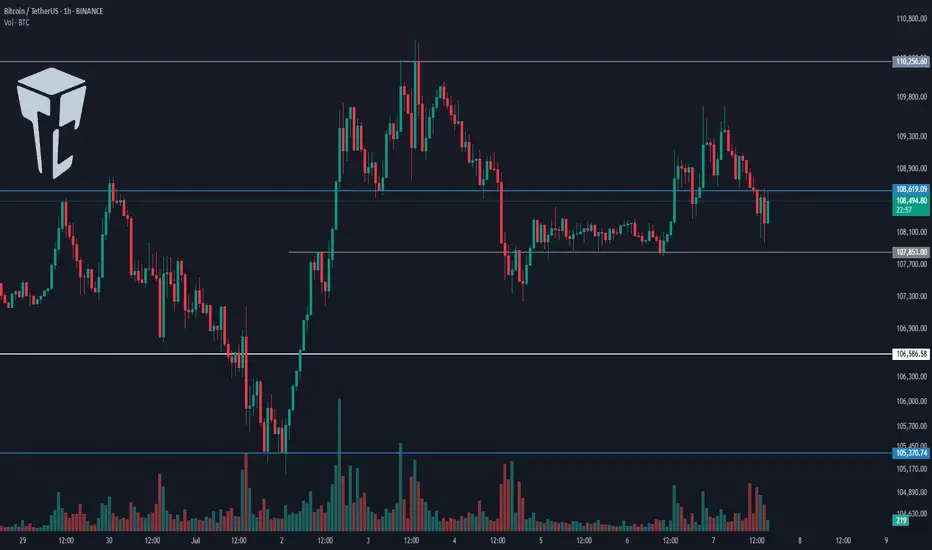
⌛️ 1-Hour Timeframe
On the 1-hour chart, Bitcoin is once again ranging between the 107,853 and 108,619 levels.
✔️ Last night, Bitcoin briefly faked out below the bottom of this range, so we now need to wait and see how the price reacts upon revisiting this area.
💫 I believe it’s best to hold off on entering a short position until we identify the precise location of the support line. As price retests this area, we can pinpoint the true support level.
✨ Once that level is confirmed, and if it breaks, a short position could be considered. The next support zones would be at 106,586 and 105,370.
📊 Make sure to watch the volume closely for this trade, and I strongly recommend waiting for a volume confirmation before entering.
📈 As for a long position, if 108,619 breaks to the upside, we could consider going long. The buying volume in the current upward leg is increasing, and if this trend continues, a breakout above 108,619 would make a long position reasonable.
👑 BTC.D Analysis
Moving on to Bitcoin dominance — it has once again reached its trendline and is currently being rejected from it. If this rejection continues, BTC.D could decline toward 65.04.
🔍 However, if the trendline breaks, the 65.31 level will be the bullish confirmation trigger.
📅 Total2 Analysis
Now on to the Total2 index (altcoin market cap excluding BTC), it has bounced from the 1.14 support and is moving toward 1.16.
🔑 A breakout above 1.16 would serve as a bullish confirmation for long positions, with 1.17 acting as the main breakout trigger.
📅 USDT.D Analysis
USDT dominance is also moving downward and has reached the 4.78 support zone.
💥 A breakdown below this level would confirm a bearish continuation toward the 4.72 level..
❌ Disclaimer ❌
Trading futures is highly risky and dangerous. If you're not an expert, these triggers may not be suitable for you. You should first learn risk and capital management. You can also use the educational content from this channel.
Finally, these triggers reflect my personal opinions on price action, and the market may move completely against this analysis. So, do your own research before opening any position.

TradeCityPro | UNI Builds Pressure Below Key Resistance Zone👋 Welcome to TradeCity Pro!
In this analysis, I’ll be reviewing the UNI coin — one of the notable DeFi tokens, currently ranked 27th on CoinMarketCap with a market cap of $254 million.
⌛️ 4-Hour Timeframe
On the 4-hour chart, as you can see, UNI has formed a bottom around the 6.043 level, which is considered its key support zone. After reaching this level, the price began an upward move, though the trend appears very weak.
✔️ Currently, there’s a resistance zone just above the price that has previously caused multiple rejections. Once again, the price is moving toward this zone.
📊 The volume during this latest upward leg is very low, which is not a good sign for initiating a bullish trend. If the price reaches this resistance level with such low volume, there's a high likelihood of another rejection.
🔽 If that happens, we could consider opening a short position based on this rejection. However, my main trigger level for a short is the break below 6.896 — I personally would wait for this level to be breached before entering a short position.
✨ The next key support, in case 6.896 is broken, is the 6.043 zone. This is a major support level and could serve as the target for the short trade. If this level is broken as well, it could mark the beginning of a strong downward trend.
🔍 On the other hand, if volume starts to pick up and the resistance zone is broken, we could open a long position. The target for this could be around 8.678 — or even a setup in anticipation of a breakout above 8.678.
🔔 Which scenario you choose depends largely on your market perspective. If you're looking for a short-term trade, the first scenario is more appropriate. But if you're aiming for a long-term position with a wider stop loss, the second scenario would be the better choice.
💥 In either of the long scenarios, I strongly recommend confirming the move with volume. For further confirmation, you can also check if RSI enters the overbought zone.
📝 Final Thoughts
This analysis reflects our opinions and is not financial advice.
Share your thoughts in the comments, and don’t forget to share this analysis with your friends! ❤️

A Buying Opportunity or Sign of a Bigger Correction?Gold Breaks Below 3300 – A Buying Opportunity or Sign of a Bigger Correction?
🧭 Market Update: Is the Sell-off Truly Dangerous?
Gold saw a surprising reversal at the close of the US session yesterday after a sharp decline targeting the 329x liquidity zone, followed by a strong buying momentum that pushed the price back above this level.
After testing the liquidity zone below 3300, significant buying volumes emerged at this price point, pushing the price back up. However, the market is still undecided about whether the bulls or bears will dominate at this stage. We are currently in an accumulation phase, with liquidity sweeps occurring at both the highs and lows, meaning traders should exercise caution and look for scalping points for appropriate entry and exit.
Short-Term Outlook: Buy Bias Dominates Today
In the short term, the buy bias appears stronger compared to yesterday. Focus on buying early at continuation patterns to capture the market's movement. The D1 candle from yesterday formed a wick rejection, showing that selling pressure has been absorbed and the buying momentum has returned in the short term. Therefore, be proactive and look for early buy opportunities.
In the M30 timeframe, there is a solid continuation pattern forming in the 16-14 zone, which could serve as a good entry point today. If the price continues to drop, we’ll wait for a retest of the previous bottom at 03-00, and monitor for any strong downward momentum to confirm if the bearish trend will continue. On the other hand, if you’re considering sell positions, proceed with caution. As mentioned with the D1 wick rejection, the SELL pressure may have been absorbed, and BUY momentum could take over in the coming days. Avoid rushing into sell positions.
Key Support & Resistance Levels:
Key Resistance: 3342 – 3353 – 3362 – 3381
Key Support: 3330 – 3314 – 3303 – 3295
Scalping Opportunities and Buy Zones:
BUY SCALP:
3316 – 3314
Stop Loss: 3310
Take Profit: 3320 → 3325 → 3330 → 3335 → 3340 → 3350
BUY ZONE:
3303 – 3301
Stop Loss: 3297
Take Profit: 3306 → 3310 → 3315 → 3320 → 3330 → 3340 → ????
Sell Opportunities and Caution on Bears:
SELL SCALP:
3362 – 3364
Stop Loss: 3368
Take Profit: 3358 → 3354 → 3350 → 3345 → 3340 → 3330
SELL ZONE:
3380 – 3382
Stop Loss: 3386
Take Profit: 3376 → 3372 → 3368 → 3364 → 3360 → 3350
Key Takeaway:
We are at a critical stage where both bulls and bears are vying for control. Will gold bounce from the support and continue its bullish trend, or will the sellers regain control and drag prices lower? Be patient and wait for clear price action signals before entering any trades.
The market is currently in an accumulation phase, so avoid rushing into decisions. Focus on buying when clear confirmations appear at support zones and stay alert for sell rejections at key resistance levels.
Good luck with your trades!
💬 What’s Your View on Gold Today?
Do you believe gold is set to break 3390 and continue its bullish momentum?
Or are we looking at a deeper correction towards 3270 in the coming days?
👇 Share your analysis and thoughts in the comments below! We’d love to hear your take on where gold is headed next!

Skeptic | BNB Surge: Rocket Triggers for Spot & FuturesHey everyone, it’s Skeptic! 😎 Is BNB ready to rocket? I’m diving into a pro-level breakdown of Binance Coin (BNB), a top 5 crypto with a $92.9B market cap, now trending on CoinMarketCap with surging momentum. This analysis unpacks recent upgrades, ecosystem strength, and technical triggers for spot and futures trading, grounded in cycle-based strategies. Trade with no FOMO, no hype, just reason.
Recent Performance & Key Events
Binance Coin ( BNB ), trading at $ 660 with a $92.9 billion market cap, ranks among the top 5 cryptocurrencies globally. The Maxwell hard fork in recent weeks slashed block times to 0.75 seconds, boosting network speed and efficiency, adding $8 billion to the Binance Chain’s market cap. BNB powers the Binance ecosystem, supporting staking, NFTs, and DeFi projects. Despite regulatory scrutiny, ongoing platform expansion and token burn mechanisms sustain BNB’s utility and investor interest. Let’s dive into the technical setup for actionable trades. 📊
Technical Analysis: Cycle-Based Breakdown
The Weekly timeframe is range-bound, so lower timeframes drive price action. Let’s break it down:
Daily Timeframe
On the Daily, we had a primary uptrend within an upward channel, which broke downward. I cloned the channel and placed it below, and price has reacted well to the midline, still holding there. A midline break could drive price to the channel floor at $536.47. However, a V-pattern stands out as one of the strongest patterns. Why? It shows sellers broke support and consolidated below, but buyers overwhelmed them, pushing price back above support instantly. This signals immense buying pressure, liquidating shorts despite heavy selling—big respect to buyers! lol
💬 For spot trading , wait for BTC.D to turn bearish, as rising BTC.D means liquidity flows to Bitcoin, making altcoin buys less attractive. BNB/BTC turning uptrend is another confirmation—currently, BNB/BTC is bearish, so focus on Bitcoin for now. Check pair/BTC ratios to spot coins outperforming Bitcoin.
Key Insight: Volume and BTC.D/BNB/BTC confirmation are critical for spot buys to avoid low-liquidity traps.
4-Hour Timeframe (Futures Triggers)
On the 4-hour, for longs:
Trigger: Break of resistance at $ 664.69 , confirming the V-pattern. Validate with a volume surge on breakout and RSI entering overbought.
Short Trigger: If support at $ 637.46 breaks again, go short, as buyers may lack strength after exhausting their effort in the prior defense. Volume confirmation is essential.
Pro Tip: ALWAYS use volume to confirm positions. Without a volume spike, fakeout risk is high. Stick to 1%–2% risk per trade to protect capital.
Final Vibe Check
This BNB breakdown delivers precise triggers: long at $664.69 (futures with V-pattern confirmation), short at $637.46 (futures). With a range-bound Weekly and Daily V-pattern, volume and BTC.D/BNB/BTC signals are your edge. BNB’s Maxwell fork and ecosystem strength fuel its potential, but regulatory risks demand tight stops. Want more cycle setups or another pair? Drop it in the comments! If this analysis sharpened your game, hit that boost—it fuels my mission! 😊 Stay disciplined, fam! ✌️
💬 Let’s Talk!
Which BNB trigger are you eyeing? Share your thoughts in the comments, and let’s crush it together!

TESLA PRICE ACTION 7 JULY 2025I have clearly explained the price action for Tesla. I have tried my best to explain why you should not be aggressive here.
I have also discussed the stops
NOTE:DO NOT BUY CALLS

TradeCityPro | Bitcoin Daily Analysis #121👋 Welcome to TradeCity Pro!
Let’s dive into the Bitcoin analysis and key crypto indicators. As usual, I’ll walk you through the triggers for the New York futures session.
⏳ 1-Hour Timeframe
As you can see on the 1-hour timeframe, the upward move Bitcoin made yesterday turned out to be a fakeout, and the price is now heading downward.
⚡️ I’m not moving the 108619 line for now. I’ll wait to see if the price reacts to it again in the future, then decide whether to adjust it.
✅ Currently, if the 107853 level breaks, we can enter a short position. We already have volume confirmation, and if this increase in volume continues, we could see a sharp downward move.
📈 Next support levels for Bitcoin in this timeframe are 106586 and 105370, which can be used as targets.
✨ If Bitcoin starts moving upward again, the long trigger remains the 110256 level. A breakout here would mark the beginning of a true uptrend.
👑 BTC.D Analysis
Bitcoin dominance continued its downward move today, dropping close to the 65.04 level.
🔼 We’re currently seeing a reaction at this level, suggesting some support. A break below 65.04 could trigger a strong downtrend.
📅 Total2 Analysis
This index is still in an uptrend but showing significant weakness. It’s currently sitting on key support at 1.15.
⚡️ A break below this level could give us a short position. Additional support levels are 1.14 and 1.13. For a long position, the only trigger we have right now is 1.17.
📅 USDT.D Analysis
Looking at Tether dominance, it’s still hovering around the 4.78 level. After a brief fakeout below, it has returned above that zone.
📊 If this level breaks again, Tether dominance could move down toward 4.72.
❌ Disclaimer ❌
Trading futures is highly risky and dangerous. If you're not an expert, these triggers may not be suitable for you. You should first learn risk and capital management. You can also use the educational content from this channel.
Finally, these triggers reflect my personal opinions on price action, and the market may move completely against this analysis. So, do your own research before opening any position.
Bitcoin - The ultimate breakdown for 2025/2026Welcome to my channel and this analysis. In this analysis I will dive deep in the current Bitcoin’s bullmarket. I will examine charts from the monthly, weekly, daily and 4H charts, and also on chain data. This will be a complete insight in Bitcoin’s price.
------------------------
Monthly timeframe
Logarithmic BTC chart
This chart presents a long-term logarithmic analysis of Bitcoin using monthly candles, covering the period from around 2013 to mid-2025. The structure is defined by two major curved lines representing a logarithmic resistance and support channel, which frames Bitcoin's price movement over more than a decade. These lines form a dynamic, upward-sloping price corridor, capturing Bitcoin's historically exponential price behavior and cyclical nature. The vertical axis uses a logarithmic scale to better reflect percentage-based changes, which is critical when analyzing an asset like Bitcoin that has grown from under $100 to over $100,000 in just a few years.
The chart displays clear multi-year cycles. The first notable cycle begins in 2013, followed by a significant correction in 2014–2015. A new bullish phase emerges between 2016 and 2018, peaking near $20,000. This is followed by a crash into 2018. A longer accumulation period precedes the 2020–2021 rally, which reaches a high around $69,000 before another sharp decline. From the bottom in late 2022 or early 2023, Bitcoin begins another uptrend, forming a steep rise along a newly established bullmarket support trendline. This trendline represents a more aggressive, linear support structure within the broader logarithmic curve, showing the strong momentum driving the current bull phase.
By July 2025, Bitcoin is trading around $108,000, advancing steadily toward the upper boundary of the long-term logarithmic resistance. A key element of this chart is the target level marked at approximately $150,000, which aligns closely with the point where the current trajectory intersects the upper logarithmic resistance. This zone has been highlighted as a likely area of interest, possibly signaling a market top or at least significant resistance, based on Bitcoin's past behavior. Historically, Bitcoin has tended to reverse sharply or consolidate after reaching this upper boundary, making the target zone an area of potential distribution or heightened volatility.
The bullmarket support trendline serves as a short- to medium-term structure within the larger logarithmic channel. As long as price holds above this line, the current bullish structure remains intact. A breakdown below this trendline could indicate a loss of momentum and trigger a broader correction.
The use of logarithmic trendlines underscores Bitcoin’s tendency to move in exponential growth cycles, shaped by macroeconomic trends, halving events, and adoption waves. The resistance and support boundaries function as dynamic guides for long-term expectations rather than rigid barriers.
The stoch RSI crosses
This chart provides a technical overview of Bitcoin on a monthly timeframe using candlestick analysis and the Stochastic RSI (Stoch RSI) oscillator to distinguish between bull and bear market phases. The Stochastic RSI, shown at the bottom of the chart, is a momentum oscillator derived from the RSI rather than price directly, making it particularly useful for identifying overbought and oversold conditions in trending markets. The key thresholds are the 80 level at the top and the 20 level at the bottom, which respectively indicate overbought and oversold zones.
The chart spans from 2017 to mid-2025, clearly separating bull and bear markets using vertical red lines and labeled annotations. Each major cycle aligns with movements in the Stoch RSI indicator. Notably, crosses above the 80 line (into overbought territory) are often associated with late-stage bull market tops or strong bullish continuations. Crosses below the 20 line (into oversold territory) typically align with bear market bottoms or the start of new accumulation phases.
Starting with the December 2017 peak, the Stoch RSI crossed above the 80 level, reaching extreme overbought territory. This cross occurred at the height of that bull cycle, signaling a likely exhaustion of momentum. Not long after this peak, the market entered a bear phase, confirmed by the downward cross of the Stoch RSI below the 80 level, and eventually below 20, leading into the 2018–2019 bear market.
By August 2019, the Stoch RSI crossed below the 20 level, signaling oversold conditions. Although this did not immediately launch a new bull market, it did suggest the market was bottoming out. This was followed by a gradual recovery and another decisive upward cross above 80 around April 2021, right in the midst of the strong 2020–2021 bull run. That cross confirmed the continuation of upward momentum and coincided with Bitcoin reaching new all-time highs.
As the price peaked in late 2021 and early 2022, the Stoch RSI again turned downward and dropped below the 20 threshold, marking another prolonged bear market. This downtrend was confirmed as the oscillator remained suppressed in the oversold zone for most of 2022.
The Stoch RSI is now moving again towards the overbought territory. This means that bulls have the control in the market and likely to push higher.
RSI with the consolidation and resistance trendline
This chart presents a broader monthly view of Bitcoin's price action alongside the Relative Strength Index (RSI), revealing a compelling structural alignment between price momentum and long-term resistance dynamics.
At the top of the chart, the candlestick pattern shows a clear upward trend spanning across multiple market cycles. A long-term resistance trendline has been drawn that connects the major highs from the two previous bull markets, specifically the peaks in late 2017 and late 2021. This resistance line acts as an upper boundary to the macro trend and, so far, the current price action in 2025 has not yet tested this long-term resistance. In fact, while Bitcoin has recently reached above $100,000, it remains below the ascending resistance trendline, suggesting that there could still be room for price to move higher before encountering the next major overhead challenge. The structure implies a potential upward continuation if momentum sustains, and the price may attempt to test this historical trendline in the near future.
Below the price chart, the RSI indicator offers additional insight into the underlying strength of this move. A descending RSI trendline connects the previous overbought peaks from 2017 and 2021, forming a macro resistance trendline in momentum that mirrors the structure seen in price. This declining RSI resistance has not yet been reached in the current cycle, implying that momentum still has space to grow before hitting a potential exhaustion point. The RSI is currently capped within a relatively tight consolidation box, with values fluctuating between the mid-60s and low-70s.
200W SMA crosses above the previous ATH
This chart illustrates the long-term price action of Bitcoin, focusing on the relationship between the 200-week simple moving average (SMA) and previous all-time highs (ATHs). Historically, when the 200-week SMA crosses above the previous cycle’s ATH, it has coincided with periods near the cycle tops. For example, in December 2017 and January 2022, the 200-week SMA moved above the prior ATH, which closely aligned with significant market peaks.
In the current cycle, however, the 200-week SMA has not yet crossed above the previous ATH from 2021, which is around $68,889.04. This is notable because, in past cycles, this crossover has typically marked the later stages of a bull run. The fact that this crossover has not yet occurred suggests that Bitcoin may still have room to move higher before reaching a new cycle top. However, it is important to recognize that this does not guarantee further upward movement. Even if Bitcoin’s price consolidates or moves sideways for an extended period, the 200-week SMA will gradually rise due to its lagging nature and could eventually cross above the previous ATH without a significant price rally.
Lets now move to the weekly charts and analyse where we are.
------------------------
Weekly timeframe
Support and resistance trendlines
This chart shows Bitcoin’s price action on a weekly timeframe, highlighting three key trendlines. Two resistance trendlines are drawn from the peaks of the last two major cycles, forming an upper boundary for price action. These lines act as potential resistance zones, indicating areas where previous rallies have topped out and where the current price could face selling pressure if it approaches these levels again.
Additionally, there is a clearly defined rising trendline that serves as bull market support. This trendline has been respected throughout the current cycle, connecting the higher lows since the market bottomed out in late 2022. As long as Bitcoin’s price continues to hold above this bull market support trendline, the overall bullish structure remains intact. This suggests that the uptrend is still healthy and that corrections or pullbacks, as long as they stay above this line, are part of a normal, sustainable bull market. If the price were to break below this support, it could signal a shift in market sentiment and potentially a deeper correction. For now, maintaining support on this trendline is a positive sign for the ongoing bull market.
Bearish divergence
The chart shows that Bitcoin has formed three consecutive price peaks, with each new high surpassing the previous one. This indicates that, from a price perspective, the market has maintained its upward momentum over this period. However, when looking at the Relative Strength Index (RSI) below the price chart, a different pattern emerges. Each time the price has made a new high, the RSI has registered a lower high, resulting in a clear bearish divergence. This is visually reinforced by the downsloping trendline that can be drawn across the RSI highs, in contrast to the uptrend in price.
Bearish divergence between price and RSI, as seen here, often signals underlying weakness in the buying momentum, even as price continues to rise. It suggests that each successive rally is being driven by less enthusiasm or participation from buyers. Given this setup, it is possible that the RSI could revisit the downsloping trendline in the near future. If this occurs, the price might make a marginally higher high, potentially forming a third peak slightly above the current level. This would maintain the divergence and could act as a warning sign for traders to be cautious about the sustainability of the current uptrend.
Stoch RSI
This chart presents the weekly price action of Bitcoin alongside the Stochastic RSI indicator. What stands out is the clear cyclical pattern in the Stoch RSI, where it tends to reach oversold levels roughly once every half year. These oversold readings have historically aligned with significant local bottoms in the price, signaling favorable buying opportunities for traders and investors. After reaching these low points, the Stoch RSI typically trends upward, eventually entering the overbought zone.
When the Stoch RSI enters overbought territory, as it does several times on this chart, it often coincides with local price peaks. These moments serve as warnings that the market may be overheated in the short term, and traders should be cautious about opening new long positions. The overbought readings suggest that a pullback or period of consolidation could be imminent, as the market works off excess bullish momentum.
Currently, the Stoch RSI is once again in the overbought zone. This suggests that Bitcoin may be vulnerable to a further pullback or at least a pause in its upward movement. While this does not guarantee an immediate reversal, it does mean that risk is elevated.
Failed breakout/liquidity grab
This weekly Bitcoin chart illustrates a strong and consistent uptrend that has been developing since late 2023. Each major move begins with a clear breakout above previous consolidation zones, followed by a retest of the broken resistance, which then acts as support, confirming the trend's strength. These retests tend to hold well, setting up for new bullish impulses.
In the earlier stages, we see BTC breaking out of a range around the $48,851 support level. After a successful retest of that zone, the price surged and entered a new consolidation phase just below $73,643. A second breakout occurred from this level, again followed by a retest that confirmed it as a new support level. This pattern reflects textbook bullish market structure: breakout, retest, and continuation.
However, the current price action shows something different. BTC has returned to its previous high around the $109,301 resistance level. Unlike the previous times, where strong bullish candles closed above resistance, this attempt has only pierced above the level with a wick, indicating potential exhaustion or hesitation. The highlighted label "Failed breakouts / Liquidity grab" suggests that these wick movements may have been attempts to trigger stop orders and gather liquidity before a possible retracement.
Now we will dive deep into the daily timeframe.
------------------------
Daily timeframe
Resistance, bullflag and Stoch RSI
This daily chart of Bitcoin reveals a period of consolidation just below a key resistance zone, which aligns with the previous all-time high area. BTC has been ranging within this red-marked resistance block, showing clear hesitation from buyers to push beyond it with conviction.
During this consolidation, a well-formed bull flag structure appeared, a bullish continuation pattern, signaling potential for further upside. The breakout from this bull flag occurred earlier this week, providing initial bullish confirmation as price pushed briefly above the upper boundary of the flag. However, the breakout lacked follow-through. Instead of sustaining momentum and closing decisively above resistance, BTC appears to have experienced a fake-out, with price now retracing back inside the prior range.
This failed breakout is particularly notable given the context of the Stochastic RSI indicator, which is currently in the overbought zone.
------------------------
4H timeframe
4H FVG and liquidity grab
This 4-hour chart of Bitcoin shows a clear structure where price has recently formed an equal high around the $110,612 level. Equal highs are often seen as zones where liquidity builds up, since many stop-loss orders from short positions typically rest just above them. This makes the area particularly attractive for a potential liquidity grab.
At the moment, BTC appears to be in a short-term retracement phase after rejecting from this equal high region. During this move, price left behind a bullish Fair Value Gap (FVG), which is a zone of inefficiency where price moved too quickly to fill orders. This FVG is now acting as a potential support zone. The chart suggests that BTC may revisit this FVG to rebalance before making another attempt to break through the equal highs.
If BTC can hold the FVG and generate upward momentum, a move above the equal highs becomes more likely. In that case, the resting liquidity just above those highs could be targeted, leading to a quick wick or breakout move before price potentially reverses again.
------------------------
Liquidation heatmap
1 month
This Binance BTC/USDT liquidation heatmap clearly shows that the majority of the liquidity is stacked to the upside. The bright yellow and green bands, which represent areas of high liquidation potential and leverage exposure, are heavily concentrated just above the current price levels, especially around the $111,000 to $114,000 zone. This indicates that many traders have short positions with stop-losses placed above these highs, making them prime targets for potential liquidation events.
As price moves closer to these high-liquidity zones, the probability increases that market participants, particularly larger players or algorithms, may push BTC upwards to trigger those stops and liquidate those positions.
1 week
The current price is hovering around the $108,000 range, with clear liquidity clusters forming both below and above this level. What stands out is the dense liquidation zone just below the current price, this suggests that many traders have placed long positions with stop-losses slightly under this support range. These positions create an opportunity for a liquidity sweep, where price briefly dips down to trigger liquidations, fill larger buy orders, and shake out weaker hands.
After such a sweep, the heatmap shows an even larger cluster of liquidation liquidity sitting just above the highs, especially around the $110,000 to $114,000 region. This is likely composed of stop-losses from short positions and breakout traders who entered too early. The concentration of liquidity here creates a strong incentive for price to target this zone after clearing the downside liquidity.
------------------------
Fear and greed index
Today
The Fear and greed today is at 66, meaning greed. This level suggests that market sentiment is optimistic, but not yet euphoric or irrational. In practice, it often means buyers are confident, and there’s still room for price continuation before we enter extreme greed territory
1 year chart
This chart displays the Crypto Fear & Greed Index over time, offering a visual representation of sentiment cycles in the Bitcoin market.
When examining the past year, you can see how sentiment has recovered significantly from the fear zone (below 30), especially from late 2024 into early 2025. This shift in sentiment aligned with BTC's price climbing back toward previous highs, indicating that sentiment is responding directly to price structure and bullish momentum.
------------------------
BTC exchange reserve
This chart, sourced from CryptoQuant, provides a clear visualization of the relationship between Bitcoin’s exchange reserves (blue line) and BTC price (white line), over a multi-year period. The key insight is the rapid and consistent decline in Bitcoin held on exchanges, especially noticeable from mid-2023 onward.
From around 2022, the amount of BTC on exchanges remained relatively stable. However, beginning in late 2022 and accelerating through 2023 into 2025, we see a shart and uninterrupted drop in exchange reserves.
This ongoing withdrawal trend typically signals accumulation behavior by investors. When BTC is withdrawn from exchanges and moved into cold storage or long-term wallets, it often reflects growing conviction among holders that price will rise and they don’t intend to sell in the short term.
------------------------
Final thoughts
This is a complete Bitcoin analysis for the community with a top-down analysis!
I have worked out a complete insight in the Bitcoin price with different analysis and on-chain data.
I would be excited if you boost, comment and share the analysis with your friends for the work that I have put in this analysis for everyone.

Weekly Market Outlook: E-mini Nasdaq 100 Futures NQCME_MINI:NQ1!
It’s a quiet week for US economic news. However, the RBA and RBNZ are scheduled to announce interest rate decisions.
As has been the theme this year, markets remain highly sensitive to headline news and associated risks.
US President Trump signed the One Big Beautiful Bill Act into law at the White House.
Treasury Secretary Bessent is currently giving an interview on CNBC as we write this outlook. Explanation of the near-term impact of Trump’s BBB Act, tariffs, and trade deals will be key to monitor, as this may be fuel for further movement. The US is set to announce more trade deals in the next 48 hours, while trading partners who did not reach a deal will revert to April 2nd tariff levels, with the tariffs to take effect on August 1st.
As many as 100 smaller countries will get a set tariff rate.
How does this all translate into price action and expectations for the market?
NQ and ES are currently trading near all-time highs. RTY has potential upside as it plays catch-up. With the BBB Act signed into law, many of the investment banks anticipate a near-term positive impact on GDP.
In NQ, we are looking at the following scenarios:
Key LIS zone: 22860.50 – 22825.50
Support Zone: 22600 – 22582.25
Key Support Zone: 22000 – 22050
Scenario 1: Hold above key LIS
In this scenario, we expect new ATHs and continuing price discovery higher.
Scenario 2: Hold below key LIS
In this scenario, we expect the price to re-test the support zone at 22600 – 22582.25 and consolidate to build value higher. A break below support may lead to further short opportunities to retest the 22000 level.

GOLD - at immediate resistance? Holds or not??#GOLD.. market perfectly deop below our area that was 3343-44 as we discussed in morning analysis.
Now we have 3312-13 as immediate resistance area so keep close and don't buy until market holds
Good luck
trade wisley

TradeCityPro | WLD Builds Pressure Inside Long-Term Range👋 Welcome to TradeCity Pro!
In this analysis, I want to review the WLD coin for you. It’s one of the Privacy and Identity coins with a market cap of $1.5 billion, ranked 55 on CoinMarketCap.
⏳ 4-Hour Timeframe
In the 4-hour timeframe, a ranging box has formed for this coin between the 0.855 and 0.969 zones, and it’s been fluctuating within this range for several weeks.
📊 Volume is gradually decreasing within this box, which could indicate that a move is approaching.
⚡️ For now, we can say the volume slightly favors buyers, as the green candles have more volume than the red ones. Additionally, the size and strength of the green candles are greater, which increases the likelihood of the box breaking upward.
📈 If the price moves up toward the 0.969 zone with increased volume, we can enter a long position upon breaking 0.969.
✔️ Alternatively, if the price is supported at the 0.855 bottom, we could also open a long position—but it’s riskier, and in my opinion, not worth it. It’s better to wait for the main trigger to activate.
🔽 For a short position, if the price forms a lower high below 0.969 and then moves toward 0.855, we can open a short if 0.855 breaks. The next support zone would be 0.795.
📝 Final Thoughts
This analysis reflects our opinions and is not financial advice.
Share your thoughts in the comments, and don’t forget to share this analysis with your friends! ❤️

BTC's Situation, A Comprehensive Analysis !!!Bitcoin is now at a point where it cannot be ignored! In my view, the bullish wave has started after the corrective wave ended. This wave could continue until it breaks the ascending triangle, then with a slight correction, push the price upward again. The current period and the coming days could be crucial in determining the market's trend.
Best regards CobraVanguard.💚

TradeCityPro | Bitcoin Daily Analysis #120👋 Welcome to TradeCity Pro!
Let’s dive into the Bitcoin analysis and key crypto indices. As usual, in this analysis I want to review the futures triggers for the New York session.
⏳ 1-Hour Timeframe
In the 1-hour timeframe, as you can see, Bitcoin has finally broken out of the range it formed yesterday and is now moving upward.
✔️ If this upward move continues, we can open a long position in these zones by getting confirmation in the lower timeframes. The main long trigger is still activated after breaking 110256.
💥 The RSI oscillator entered the Overbuy zone in the previous candle. We need to see how the price reacts to this move and what impact this oscillator will have on the price.
⚡️ In my opinion, this RSI move won't have much impact. Although the price is moving upward, the main trend has not yet formed, so there's no real momentum in the market, and RSI is basically useless for now.
✨ If this upward move turns out to be fake, we can enter a short position with the 107853 trigger.
👑 BTC.D Analysis
Let’s look at Bitcoin Dominance. Yesterday, dominance had an upward move and broke its ascending trendline but failed to stabilize above 65.52, resulting in a fake breakout and a move downward.
☘️ The fake breakout trigger for the trendline was the 65.38 zone, which was activated, and now the price is heading downward. If this move continues, the next target will be 65.04.
📅 Total2 Analysis
Alongside Bitcoin’s upward move, this index also activated the 1.14 trigger and is moving up, now reaching 1.15.
💫 If the move continues, the next entry trigger is at 1.17, which is still quite far from the current price.
📅 USDT.D Analysis
Looking at Tether Dominance, the 4.82 trigger was activated, and dominance is now moving down, having reached 4.78.
📈 If it stabilizes below 4.78, we can confirm the continuation of the downtrend in dominance, which could push it down to 4.72.
❌ Disclaimer ❌
Trading futures is highly risky and dangerous. If you're not an expert, these triggers may not be suitable for you. You should first learn risk and capital management. You can also use the educational content from this channel.
Finally, these triggers reflect my personal opinions on price action, and the market may move completely against this analysis. So, do your own research before opening any position.

TradeCityPro | 1INCH Tests Supply Zone After Strong Bounce👋 Welcome to TradeCity Pro!
In this analysis, I want to review the 1INCH coin for you. It’s one of the DeFi coins, with a market cap of $256 million, ranked 162 on CoinMarketCap.
⏳ 4-Hour Timeframe
As you can see in the 4-hour timeframe, this coin is sitting on a support floor at the 0.1668 zone and has formed a range box at this bottom.
🔔 There’s a key supply zone at the top of this range box, which I’ve marked as a range for you, and currently, the price is inside this zone.
📊 Given the significant buying volume that has entered this coin, the price has penetrated into this range and is testing it for the several-th time.
✨ If this range is broken, we can confirm the bullish reversal of this coin and open a long position. Volume has already given us confirmation, and if RSI enters the Overbuy area, that will be our momentum confirmation.
🔼 The next resistance levels for this coin—which we can consider as targets—are 0.2031 and 0.2207.
✔️ If the price gets rejected from this zone, it may move back down toward the 0.1668 floor. For a short position, we can enter if 0.1668 is broken.
📉 However, if we get confirmation of rejection from the zone, we can look for an early entry trigger in the lower timeframes.
📝 Final Thoughts
This analysis reflects our opinions and is not financial advice.
Share your thoughts in the comments, and don’t forget to share this analysis with your friends! ❤️
