TradeCityPro | SUIUSDT Is the best time to buy ?👋 Welcome to TradeCityPro Channel!
Let's analyze and review one of the most popular coins in the market, sui, and update our previous analysis and find new triggers
🌐 Bitcoin Overview
Before starting today's altcoin analysis, let's look at Bitcoin on the 1-hour timeframe. Since yesterday, Bitcoin experienced a correction, which was necessary for the market, and it pulled back to the 102135 range. The next trigger for a long position will be a breakout above 104714.
Yesterday's correction, coupled with an increase in Bitcoin dominance, caused noticeable declines in some altcoins. This highlights the importance of monitoring BTC pairs in your checklist these days.
📊 Weekly Timeframe
In the weekly time frame, it is one of the coins that is in good condition, it is really in the market and is still fluctuating on the high support levels.
After hitting 5.24, we made a new ceiling or ATH, and after that, due to recent market news, we experienced some drops, and this has also caused the price correction of this coin.
For re-buying, if we make a good support candle at this level 2.4, it will be a good trigger and the main trend will start again after we break 5.24. Also, after breaking 1.77, we can temporarily exit this coin and cash out!
📈 Daily Timeframe
In the daily time frame, it has been in relatively good conditions compared to other coins in the market and has experienced fewer declines and still has a lot of support to lose!
After breaking the 1.0333 level, which was our trigger spot, we made our purchase and experienced a move after its failure with the entry of momentum and recorded a new ceiling with this event!
Along with this trend, we can draw our Fibonacci levels, which are currently involved in the important level of 0.382, and after it rises and breaks the ceiling of 5.24, we can experience a powerful move!
If this level is broken, we can also hit the support levels of 1.7702 and 1.3859 and we need to form a structure to buy now, but after breaking the trend line and the 3.65 trigger, it can be a good point! For selling, I will continue to hold for now!
📝 Final Thoughts
Stay calm, trade wisely, and let's capture the market's best opportunities!
This analysis reflects our opinions and is not financial advice.
Share your thoughts in the comments, and don’t forget to share this analysis with your friends! ❤️
Tradingview

USOIL - at breakout level? what's next??#USOIL.. market perfect breakout in yesterday and now again market just near to his today breakout level or resistance area that is around 67.85-90
keep close that level and if that is clear breakout then we can expect a further drop...
dont be lazy.
good luck
trade wisely

GOLD - at resistance? what's next??#GOLD - market at his resistance area that is around 2919 -20
keep close that area because if market hold it in that case we can see a drop again.
stay sharp.
good luck
trade wisely

TradeCityPro | Bitcoin Daily Analysis #23👋 Welcome to TradeCity Pro!
Let's dive into the analysis of Bitcoin and other important crypto indices. In this analysis, I want to review the important futures triggers in today's New York session. Yesterday, the market was rejected from a significant area and experienced a bearish leg.
📰 Before starting the analysis, it's worth noting that today Trump has a very important speech about tariffs, and if he discusses cryptocurrencies, the market may experience significant fluctuations. Therefore, be cautious about opening high-risk positions today.
⏳ 1-Hour Timeframe
In the 1-hour timeframe, as observed yesterday, after the price rose from the 91422 area, I mentioned that if the 94355 resistance were broken, we could enter a long position, and if the 91422 area were broken, we could enter a short position.
🔍 That exact scenario occurred, and after the price created a lower high compared to 94355, we witnessed a significant bearish momentum, resulting in a large bearish candle that engulfed several previous candles, broke the 91422 support, and reached the 89318 area.
⚡️ After this event and several resting and pullback candles that hit the 0.382 Fibonacci area, the price proceeded with its next bearish leg, breaking the 89318 area near the 0.618 Fibonacci zone. With this PRZ break, we can say that all bullish market momentum was wiped out, and the price fully corrected relative to the bullish leg it had previously made, reaching the 85204 area.
✅ This morning, this area was also breached, and the price executed a Downside Extension to the 1.272 Fibonacci Retracement, meaning the market has fully engulfed the bullish leg and even dropped an additional 27% from that leg to date.
📉 Currently, there is support at the 83151 area, which coincides with the 1.272 Fibonacci. If this area is breached, we can expect the Downside Extension to continue, with the next support at the Fibonacci 1.618, a crucial Fibonacci zone. If this area is also breached, there is a static support at 78940.
💥 In the RSI, note the significant bearish momentum in the market. If the RSI can re-enter and stay in the Oversell zone, the likelihood of breaking 83151 or even 78940 will increase.
📊 Regarding volume, as you can see, it mostly shows a ranging structure with a few high-volume candles within this range that can be considered Selloff candles. After these candles, the price had several resting and corrective candles.
✨ Overall, the volume is ranging, and we will see whether buying or selling volume enters the market based on Trump's statements.
🔼 For a risky long position today, you can open a long position with the breakout of 85204. I suggest this trigger because Trump has a speech today, and if this news is favorable for crypto, Bitcoin could move upward again under the news influence, and I think the risk is worth taking if this area breaks.
❌ However, open this position with the minimal risk your strategy allows, and ensure that no more than 0.5% or 0.25% of your capital is at risk if this position hits a stop-loss.
💫 No more to discuss about Bitcoin; let's move on to the analysis of dominances to see what triggers we can find for altcoins.
👑 BTC.D Analysis
Let's look at the Bitcoin dominance analysis. As you can see, yesterday I defined a resistance area at 61.48 for you and mentioned that the price might get rejected from this area and the dominance might turn bearish again, which did happen, albeit slightly off at 61.61.
⭐️ Therefore, I have moved this line and adjusted it to this area. Currently, we are witnessing several bearish candles in a row from Bitcoin's dominance, and it seems likely that the dominance could move back down to the 60.40 floor with the bearish momentum it has, and as I've said in the past few days, I still see Bitcoin's dominance trend as ranging.
🎯 The dominance is not very analyzable at the moment, and we need to wait and see which side the box will break. If the box breaks from the 62.19 area, we can say that a lot of money is likely to enter Bitcoin, and Bitcoin could move more than altcoins. If the dominance breaks from the 60.40 area downwards, we can say that more money will enter altcoins.
📅 Total2 Analysis
Moving on to the Total2 analysis, yesterday I told you that if the 1.14 level is broken, you could enter a short position if Bitcoin's dominance was rising, which indeed occurred, and the dominance of Bitcoin was rising while this break happened, and the dominance had not yet been rejected from the ceiling, which is why the short position you opened on altcoins could have been much more profitable.
🎲 However, as you can see, I have moved this trigger and transferred it to the 1.13 area because I think this area is cleaner, and as you can see, the price has reacted to it once and is likely to react to this area more in the future than to the 1.14 area.
🔑 Overall, the gray areas you see drawn on the chart are not very important supports and resistances, so I easily move them if the price does not show the reaction I want, and it is not very important to me if their position changes.
☘️ However, as you can see, after the price broke the 1.13 area, it executed its main bearish leg downwards, even breaking the 1.07 area and hitting a shadow to the 1.01 area as you can see, and is currently in a corrective phase.
🔽 The 1.07 area could be very important today, and if this area is broken, we can say that the price could make a deeper correction. But if this does not happen and the price is rejected from this area, we can say that altcoins are ready to execute their next bearish leg at least down to the 1.01 area.
✅ Depending on Bitcoin's dominance, you can decide to open a position on Bitcoin itself today or on altcoins. As you can see, the dominance candles being set suggest a bearish dominance, so if the market gives a short position, Bitcoin will be better than altcoins, but while you are reading this analysis, if you want to open a position, it might be that the dominance turns bullish, in which case a short position on altcoins would be better than on Bitcoin.
📅 USDT.D Analysis
Let's look at the Tether dominance analysis. As I told you yesterday, if the 4.82 level was broken, the dominance could start a bullish leg, which did happen, and the market activated its short trigger in Total2 and altcoins, and the dominance moved upwards, even breaking the 5.08 area and with a pullback to this area, reached 5.30.
🧲 This area was previously around 5.21, but as I told you, I easily move lines that are gray if the price does not respect them, and for this reason, I moved this area to 5.30, as you can see, the price has reacted to it and now seems to be correcting.
📊 Unfortunately, I don't have a specific trigger for a bearish turn in Tether dominance, but this 5.30 trigger is a very suitable one for it to turn more bullish, and in my opinion, if the dominance wants to turn more bullish and break this area, it could move again up to the 5.50 area.
🔼 But in case of a correction in dominance, the first very important support exists at 5.08, and the dominance could correct to this area.
📌 Final Words Overall, I think the market today is not very analyzable and can have a lot of sharp and emotional movements, and everything depends on Trump's speech.
❗️ I suggest that if you think the market will go up with Trump's speech, hold a long position, and if you think it will go down, hold a short position if triggers are activated.
🎲 But open this position with the minimum risk you can and are allowed to take because Trump's speech can create a lot of sharp movements in the market, and if you do not risk manage and set a stop-loss, your position can easily be liquidated, so be careful to risk the minimum amount that your strategy allows you to open these positions.
❌ Disclaimer ❌
Trading futures is highly risky and dangerous. If you're not an expert, these triggers may not be suitable for you. You should first learn risk and capital management. You can also use the educational content from this channel.
Finally, these triggers reflect my personal opinions on price action, and the market may move completely against this analysis. So, do your own research before opening any position.

GOLD - placed a reasonable low? What's next??#GOLD.. market just placed a very reasonable day low.
And if market hold that low then again rise expected.
Say sharp guys.. don't be lazy here.
Good luck
Trade wisely

TradeCityPro | XLM: Key Levels and Market Analysis👋 Welcome to TradeCity Pro!
In this analysis, I want to review XLM for you. This coin is one of the U.S.-based crypto projects, and given the recent surge in news regarding crypto and the U.S., it could experience significant volatility, making it suitable for trading.
📅 Daily Timeframe
On the daily timeframe, we can see a strong bullish leg that extended up to $0.5781 before entering a correction phase, forming a descending wedge.
🔍 At the moment, there is a very important support level close to the price. If $0.2827 is broken, we can expect a further correction toward the 0.5 or 0.618 Fibonacci retracement levels. Another key support level is at $0.1566.
⚡️ The $0.2827 zone is highly significant, as it overlaps with the 0.382 Fibonacci retracement, making it a crucial level. If the price finds support at this zone, we could see the next bullish leg begin. However, if this support is lost, the price could experience sharp downward movements.
🔼 For spot buying, the $0.3522 resistance has turned into a solid level, where the price has tested and rejected multiple times. If the wedge pattern and resistance break, you can enter a long position or consider spot buying.
🚀 The next resistance levels are $0.4896 and $0.5781. The ATH at $0.7791 is a major supply zone.
📊 In the next few days, pay close attention to volume. A rise in volume before a breakout could indicate an imminent move.
⏳ 4-Hour Timeframe
On the 4-hour timeframe, we can observe price action in more detail. There is strong resistance at $0.3522, where the price was rejected, leading to significant bearish momentum.
✅ Currently, the price is reacting to the $0.2817 zone, and after seven consecutive red candles, a green candle has formed. Previously, the price faked a breakout at this level, and now it has retested this zone again.
🔽 If $0.2817 is broken, a short position can be opened, with the next support at $0.2368. For long positions, wait until the price forms a structure and the $0.3102 trigger level is confirmed. The main long trigger will be a breakout above $0.3522.
📝 Final Thoughts
This analysis reflects our opinions and is not financial advice.
Share your thoughts in the comments, and don’t forget to share this analysis with your friends! ❤️

TradeCityPro | BIGTIMEUSDT Final Downtrend?👋 Welcome to TradeCityPro Channel!
Let's analyze and review the new gaming coin BIGTIME and see what the market is going to be like. I feel like we're going to see the final downtrend.
🌐 Bitcoin Overview
Before starting today's altcoin analysis, let's look at Bitcoin on the 1-hour timeframe. Since yesterday, Bitcoin experienced a correction, which was necessary for the market, and it pulled back to the 102135 range. The next trigger for a long position will be a breakout above 104714.
Yesterday's correction, coupled with an increase in Bitcoin dominance, caused noticeable declines in some altcoins. This highlights the importance of monitoring BTC pairs in your checklist these days.
📊 Weekly Timeframe
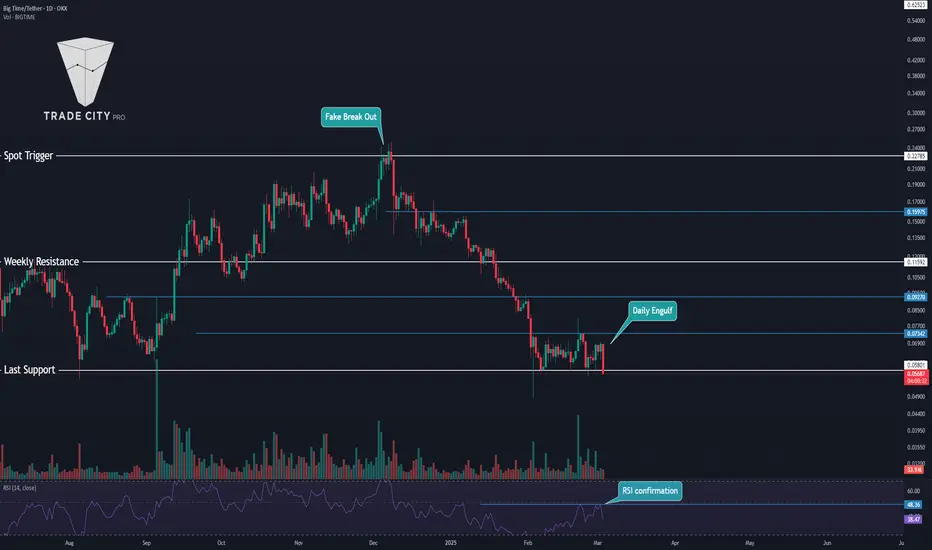
This coin is not in an interesting situation on the weekly time frame and after being rejected from the resistance of 0.22109, it is continuing its downward trend and is recording a lower high and low
If the weekly candle closes like this and we lose the support of 0.06479, the declines will continue and if you are holding this coin, I suggest you exit temporarily and if it enters again, you will simply enter with a smaller number of this coin and your number of Tethers will be preserved
They are not really in good conditions for buying right now, but if the support is faked, we can get a trigger from them, but normally the best trigger is after the failure of 0.22109, but I repeat, the fake of this support can form a new trend!
📈 Daily Timeframe
The situation is the same on the weekly time frame and the probability of a fall is higher than ever, and after the rejection of this important resistance at 0.22785, we have experienced a 75% drop so far!
After this drop, we went into the range box between 0.05801 and 0.07342, and it is natural to suffer a little until our RSI rejected the middle line of 50, which again increased the probability of a fall.
Also, today's daily candle is very important, and if it closes like this, we are engulfing a few of our previous candles and the probability of a support floor breakdown is higher than ever, so you can open a short position and exit the spot, and your second entry for the spot breakdown will be 0.09270!
📝 Final Thoughts
Stay calm, trade wisely, and let's capture the market's best opportunities!
This analysis reflects our opinions and is not financial advice.
Share your thoughts in the comments, and don’t forget to share this analysis with your friends!
USD/CAD – High Probability Long SetupHey guys, welcome back! I'm Skeptic, and today I want to share an interesting long setup on USD/CAD that could present a solid trading opportunity. Let's break it down!
📌 1D Timeframe Analysis
After the previous uptrend, USD/CAD entered a long consolidation phase within a daily range.
Recently, we saw a fake breakout of the range low, followed by strong bullish momentum, indicating a potential attempt to break the key resistance at 1.45172.
If this breakout is successful, we could see higher targets being tested.
📌 4H Timeframe & Entry Plan
🔹 Trigger: Entry after the breakout of 1.44545 resistance.
🔹 Execution: You can either place a stop-buy order or wait for a breakout confirmation on lower timeframes.
🔹 Stop-Loss: Below 1.43677 (safe level).
🔹 Target: Holding towards the daily resistance at 1.45172 and beyond.
📌 Why take this trade?
We are anticipating the daily breakout before it happens, rather than chasing it after the fact.
If you wait for confirmation above 1.45172, you may need a wider stop-loss, making the entry less favorable due to increased volatility.
📉 Risk management remains key! Make sure to size your position accordingly and avoid overleveraging.
💬 What’s your take on this USD/CAD setup? Drop your thoughts below!
🚀 See you in the next analysis!

DXY Analysis: Rejection from Resistance – More Downside AheadWelcome back, guys! I'm Skeptic, and let's start the week with a DXY analysis.
This is a crucial period for the dollar index, with many significant events unfolding—one of the most important being Trump’s tariff war. Now, let’s break down the technical outlook on DXY.
1D Timeframe
Looking at the daily chart, we can see that DXY has been rejected from a key resistance zone. Additionally, since it has formed a lower high, I still maintain my previous analysis that DXY is currently undergoing a correction within its previous uptrend. This means we could see further declines. The key support level to watch here is the 35% Fibonacci retracement zone at 105.720.
4H Timeframe – Finding a Trigger
On the 4H chart, we had a daily resistance zone that was briefly broken but turned out to be a fake breakout. This suggests that liquidity has been swept above the resistance, liquidating long positions, and now the market has more momentum to push downward.
The main short trigger is at 106.188, but depending on momentum, we could potentially enter even earlier on lower timeframes.
Key Risk Factor: While we are currently in a correction phase, the major trend is still an uptrend. That means risk should be managed carefully, and trades should be closed sooner than usual.
Final Thoughts
Thanks for sticking around until the end of the analysis. From now on, I’ve decided to publish separate analyses for indices, forex pairs, and BTC instead of grouping them into one post. Let me know what you think about this new format— do you prefer everything in one post, or is this better?
See you in the next analysis! 🚀

TradeCityPro | Bitcoin Daily Analysis #22👋 Welcome to TradeCity Pro!
Let's dive into the analysis of Bitcoin and key crypto indices. In this analysis, as usual on Mondays, I want to review Bitcoin in longer timeframes and explore potential scenarios for Bitcoin in the long term.
📅 Weekly Timeframe
In the weekly timeframe, as you can see, the price has formed a very large candle with a big shadow, finally breaking out of the 90,000 to 104,000 range box, dipping below, and re-entering this box.
🔍 The reason for this Bitcoin fluctuation was initially the news of America's 25% tariffs, which caused all stocks and Bitcoin to drop. Even the Nasdaq saw a significant fall, but after Trump tweeted last night about planning to have a Crypto reserve at the US Treasury,
📰 This news caused the price to engulf all the previous downward movement, resulting in the candle you see, which has pulled back to the Fibonacci range between 0.382 and 0.5 and has also pulled back to the SMA 25. If you're looking to buy Bitcoin, you can place a stop buy above last week's candle to make your purchase in the spot market.
👀 However, be aware that Bitcoin is in a high price area, and make sure to manage your risk. If the 104,000 area is broken, higher targets will be accessible. If this happens, I will update the analysis and inform you of higher targets.
🔽 If the price drops, the Fibonacci areas are clearly defined, and the main support is at 72,000. I have nothing more to say about Bitcoin in this timeframe; let's move to the daily timeframe to see what triggers we can find there.
📅 Daily Timeframe
In the daily timeframe, as you can see, we can observe the movement influenced by the news in more detail. As I mentioned in the analysis, with the break of the 92,433 area, we could have opened a short position for Bitcoin to make a deeper correction to the Fibonacci confluence area between 0.5 and 0.618.
🔑 As you can see, after several candles hit this range last night, with the news announced by Trump, the price returned above the 92,433 area, and it seems that a V pattern is forming on the chart, and the trigger for this V pattern is at 98,482.
✨ If the price can stabilize above this area, I personally expect it to move at least to the 106,243 area, which is the resistance at ATH.
💥 In the RSI, as you see, it is engaged with the 50 resistance. If the RSI goes above this area and can break it, we will have confirmed the bullish momentum. In this case, if the 98,482 area breaks, I personally will try to have a long position because it can continue and move towards a new ATH with the break of 106,282.
📉 But on the other hand, if all this upward movement that has occurred is a pullback, and the price starts to move downward again, I will definitely inform you in future analyses and announce appropriate short triggers.
💫 In the daily timeframe, the important corrective areas are the same range between 0.5 and 0.618 Fibonacci. If this area is lost, the main support will be 72,753.
⏳ 4-Hour Timeframe
Let's go to the four-hour timeframe to slowly review the futures triggers and trades that we can open today and in the coming week.
🔄 As I told you yesterday, with the break of 87,070, we could have entered a long position, but I told you that since it is a holiday, I myself am not opening this position, and I also suggested that you not open this position, which is completely natural, and just because the price has gone up doesn't mean I should say you definitely had to open this position.
📚 We must not trade outside our strategy and always be within the framework of the strategy. In my strategy, on Saturdays and Sundays when the market is closed, I do not open positions for triggers that are not very important, and this trigger was also among those triggers, and I did not open a position.
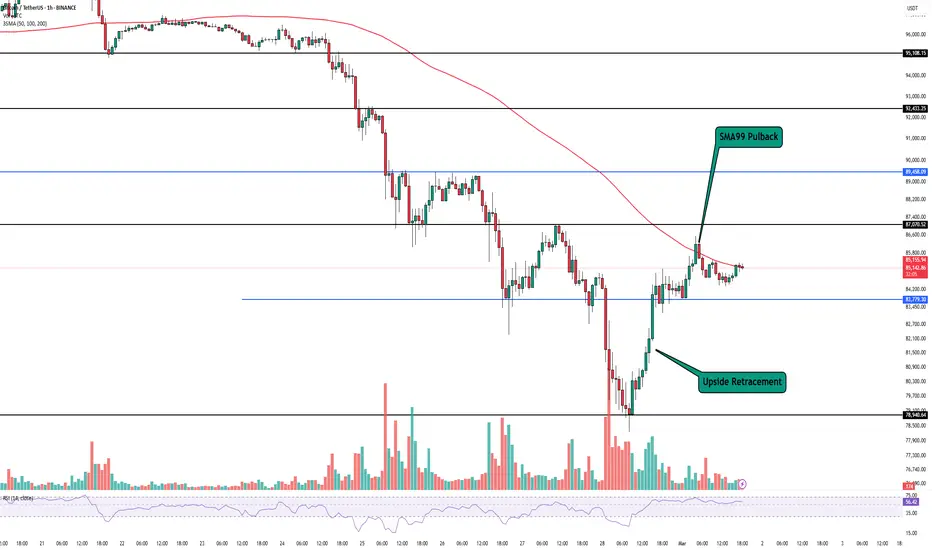
✅ If you opened it, congratulations, and I hope you have profited and always be profitable. But today, our job is easier for opening long positions because the price has come up one leg, and bullish momentum has entered the market, even the RSI has entered Overbuy once and has reset now, so if the 95,108 area breaks, which I will tell you the exact number in the one-hour timeframe, we can enter a very good long position.
📈 In my opinion, this position will be very logical because, as I said, the price has come up a leg, and now after resting, it is ready to go up the next leg.
🔽 But on the other hand, we can consider all this movement a pullback and a Dead cat bounce. In this case, if the 92,226 area breaks, the price can drop again and move downward. It is better to go to the one-hour timeframe to talk more about this issue and today's positions there.
⏳ 1-Hour Timeframe
In the one-hour timeframe, as you can see, yesterday the 87,070 trigger was activated, which I referred to in the four-hour timeframe, and told you that I personally did not open this position, and yesterday I did not open any specific position.
🧲 But today, as you can see, Bitcoin, after being rejected from the 94,355 area, has made a slight correction downward to the 91,422 area. This area overlapped with the SMA 25, and it seems that the price is being supported from this area and can move upward.
🔍 Keep in mind that if the SMA 25 cannot prepare the necessary and sufficient momentum for the next bullish leg, the price can wait until the SMA 99 reaches it. As we saw in the previous bearish leg, the SMA 25 reached the price several times and caused the bearish momentum to be maintained, but with the breaking of the SMA 25 and reaching the SMA 99, the price could not continue the bearish momentum and with the breaking of the SMA 99 and the cross of this SMA with the SMA 25, it caused the market trend to change, and with the news that came, we had an upward leg upwards.
🔼 So, if with a pullback the price to SMA 25 starts the next bullish leg, in case of breaking 94,355, I will open a long position, and if the SMA 25 cannot enter momentum into the market, with breaking 91,422, you can enter a short position.
🎲 I have nothing else to say about Bitcoin, let's move on to the analysis of dominances to see what the market conditions for altcoins will be like.
👑 BTC.D Analysis
Let's move on to the analysis of Bitcoin dominance, as you can see in the one-hour timeframe, I've made the chart a bit clearer and marked a box between 60.40 and 61.48 for you, where the price yesterday, after the news came, first had a fake from below and performed a fake break in the area of 60.40, and after the effects of the news wore off, the dominance moved upwards again.
💧 Currently, dominance has reached the area of 60.48, and the scenario I mentioned a few days ago, i.e., re-testing the top of the main box, seems very likely, and with the stabilization of Bitcoin dominance above the area of 61.48, we can expect this dominance to move up to the area of 62.19 and even 62.66, which if this movement coincides with the breaking of Bitcoin resistance, opening a Bitcoin position will be very logical, and if the short trigger is always activated, altcoins can have a very sharp and severe drop.
⭐️ On the other hand, if dominance is rejected from this resistance of 61.48 or performs a fake break, dominance can move down again towards the area of 60.40, in which case we can also open long positions on altcoins and short positions on Bitcoin itself.
📅 Total2 Analysis
Let's move on to the analysis of Total2, as you can see, after the area of 1.09 was broken yesterday, Total2 made a more upward move than Bitcoin and moved more upwards than Bitcoin and managed to move up to the area of 1.23, and the reason was that Bitcoin dominance was in an upward falling movement and caused more money to enter altcoins.
☘️ But as you can see, simultaneous with the rise of Bitcoin dominance and the correction of the altcoin market, altcoins made much more corrections than Bitcoin today and have fallen more than Bitcoin today and are supported at 1.14.
🎯 For long positions, you can enter with the break of 1.23, but if the price shows a reaction to the area of 1.18 again, you can enter a long position with the break of this area. I'm keeping this area today and want to see if the price will show a reaction to it in the future or not. If the price does not show a reaction to this area, I will remove it from the chart, and if I see that it shows a reaction and respects this area, I will keep it on the chart.
📉 For short positions, you can also look for altcoins that are on good support floors in case of breaking 1.14, and if Bitcoin dominance rises, and these altcoins can open a short position.
📅 USDT.D Analysis
Let's move on to the analysis of Tether dominance, as you can see, yesterday the 5.08 trigger in dominance was activated, causing the dominance to fall and with the fall of dominance, the market moved upwards.
✅ Currently, dominance is on a very important support that I had previously specified for you, which is 4.60. This area was previously in the range of 4.62, and the price showed a slight reaction to this area, and I moved this area.
✨ In the pullback of Tether dominance, this pullback has hit the area of 4.82, which I had previously specified for you, and it currently seems ready to perform its next downward leg.
⚡️ As you can see, a V pattern had also formed in Tether dominance, which was activated with the break of 5.08, and the first downward leg was performed up to the area of 4.60. Currently, the trigger for confirming the downward dominance of Bitcoin is this area of 4.60, and if the dominance is stabilized below this area, we can confirm the downward dominance, but on the other hand, if the dominance is stabilized above the area of 4.82, we can expect an upward leg to be performed on dominance.
❌ Disclaimer ❌
Trading futures is highly risky and dangerous. If you're not an expert, these triggers may not be suitable for you. You should first learn risk and capital management. You can also use the educational content from this channel.
Finally, these triggers reflect my personal opinions on price action, and the market may move completely against this analysis. So, do your own research before opening any position.

TradeCityPro | XRP: Key Levels After Major Market News👋 Welcome to TradeCity Pro!
In this analysis, I want to review XRP, one of the most significant coins in the market. Yesterday, a major news update was released about XRP, and with a market cap of $156 billion, it currently ranks 3rd on CoinMarketCap.
📰 Important News Update
Before starting the analysis, let’s go over the major news regarding this project. Yesterday, former U.S. President Donald Trump tweeted that he plans to add a crypto reserve to the U.S. Treasury, stating that major cryptocurrencies like BTC, ETH, SOL, ADA, and XRP would be purchased by the U.S. Treasury.
✅ This is extremely bullish news for the market. As we saw yesterday, Bitcoin made a strong, sharp move, and the altcoins listed in the announcement also experienced massive price surges. For example, XRP surged by 30% following the news.
💥 I will discuss Bitcoin and other coins in future analyses, so make sure to check out today’s Bitcoin analysis, where I’ll also cover long-term scenarios.
📅 Weekly Timeframe
On the weekly timeframe, as seen on the chart, after bouncing along the ascending trendline, XRP confirmed its breakout above $0.73056, which initiated the main bullish leg, pushing the price up to $3.06717.
🧩 $3.06717 is the all-time high (ATH) and a major supply zone.If XRP can hold above this level, the next bullish leg could begin.
✨ In the event of a correction, the only key support visible on the weekly timeframe is $1.67220. For further support levels, we need to analyze lower timeframes.
🔍 The RSI oscillator has exited the overbought zone and returned to normal levels.If RSI re-enters overbought conditions, the bullish scenario becomes more likely.
📅 Daily Timeframe
On the daily timeframe, the first key observation is a strong bearish divergence on the RSI, which formed as price moved sideways inside the range between $2.02967 and $3.30467.
⚡️ The trigger for this divergence is a break below $2.02967, which has not yet happened.
Looking at market volume, after the $0.72448 breakout, volume significantly increased. However, volume has been gradually decreasing since the formation of the range.
📊 A drop in volume before a breakout often signals that a breakout is approaching.If volume continues to decline, be prepared for a potential breakout and enter positions accordingly once triggers are confirmed.
📉 If the range breaks downward, and the PRZ at $2.02967 is lost, XRP could enter a deeper correction toward key Fibonacci levels such as 0.382, 0.5, and 0.618.
💫 These three Fibonacci levels are strong support zones, which could prevent a further sell-off.
📈 On the bullish side, if the range breaks to the upside, a new bullish leg will begin, pushing XRP toward higher targets.If this bullish breakout happens, I will update the analysis with potential new targets.
⏳ 4-Hour Timeframe
Let’s now analyze the 4-hour timeframe and identify futures trading triggers.
🔍 After the drop from the $3.36021 peak, the price reached the bottom of the range, and market volume significantly decreased.This signaled that a major move was approaching.
🔑 As seen on the chart, the release of the U.S. Treasury Crypto Reserve news triggered an explosive move, pushing XRP up to $2.95244.
🔽 For futures trading, the closest short trigger is a break below $2.30010.For earlier short entries, we need to wait for a new structure to form.
🛒 For long positions, if $2.95244 is broken, a long entry can be considered.The main resistance for spot buying and the key long position trigger is at $3.36021.
📝 Final Thoughts
This analysis reflects our opinions and is not financial advice.
Share your thoughts in the com

testing the red resistance zoneAnalysis 🚨
$SNEK is testing the red resistance zone 🔴. If the breakout is successful, the first target will be the green line level 🟩!
🎯 Target:
✅ Green line level

Bitcoin Breakdown: Bearish Retest or Further Crash to $60K?Bitcoin (BTC/USD) Daily Chart Analysis 🧐📉
Key Observations:
Major Breakdown Below Support 🚨
BTC has broken below a key support zone around $85,000 (which also aligns with the 200 EMA at $85,602).
This signals further downside potential if price fails to reclaim this level.
Bearish Retest Expected 🔄
The price may attempt to retest the broken support (~$85,000–$90,000) before continuing downward.
If rejected, BTC could drop to lower demand zones.
Next Major Support: $70,000 & $60,000 Zones 📉
The chart suggests a downside move toward $70,000, with a final target around $59,932.
These levels have historical significance as support zones.
RSI Shows Oversold Conditions 📊
The RSI is at 24.86, which is deep into oversold territory.
This could mean a temporary relief bounce, but overall momentum remains bearish.
Possible Scenario 📍
If BTC fails to reclaim $85,000, expect a move down to $70,000–$60,000.
A reclaim of $90,000+ would invalidate the bearish structure, leading to another attempt at $100,000+.
Conclusion: Bears in Control! 🐻⚠️
The trend remains bearish unless BTC reclaims key resistance zones.
Short-term bounce possible, but lower targets remain valid unless $85,000–$90,000 is reclaimed.
🔥 Trade Smart! Use Risk Management! 🔥 Let me know if you need specific trade setups! 🚀

UniversOfSignals | Bitcoin Daily Analysis #21Today, we're going to dive into the analysis of Bitcoin and the crucial crypto indices. I will review the significant futures triggers for today's New York session. The market conditions haven't changed much from yesterday and continue to range between 83,779 and 87,070.
⏳ 1-Hour Timeframe
In the 1-hour timeframe, as you can see, I've outlined the Fibonacci levels because it seems that the previous bearish leg has ended, and the market is ranging, preparing for either a trend reversal or the next bearish leg.
🔄 Yesterday, I mentioned that it appeared the price was pulling back to the SMA 99 and that if the trigger at 83,779 was breached, we could confirm a pullback to the SMA 99 from the market. As you see, this did not happen, and the trigger at 83,779 was not activated.
🔍 As observed, there is a cross between the SMA 99 and the SMA 25, which has led the market to start ranging. Currently, there's a very important PRZ (Potential Reversal Zone) above the price, overlapping with the 0.5 Fibonacci zone and the resistance at 87,070. This makes it a critical area, and I suggest you stay behind the chart to see how the price reacts to this area.
🔽 If the price gets rejected from this area, we can take an early trigger for a short position, and if this area is breached, you can proceed to take a long position. However, be mindful that today is Sunday, and as you can see, the market volume has significantly decreased. This happens because the bearish leg has ended and the market is correcting, but also because it's Sunday and during weekends, market volume typically decreases. I recommend keeping an eye on risky positions such as the one at 87,070 during holidays or when the market volume is low.
⚡️ However, there are areas that are still good for opening positions even on holidays like Sunday when the market volume is low, such as the area at 83,779. In my opinion, this could cause the price to move towards its next bearish leg if this area is breached, so even if the market volume is low and it's a holiday, I think if this area is breached, significant selling volume will enter the market and for this reason, I try to keep a short position open if this area is broken.
💥 The RSI oscillator, as you see, has moved above the 50 area, and breaking this area could be a good momentum confirmation for opening a short position. If the RSI enters the oversell area, we can have momentum confirmation for the start of the next bearish leg.
👑 BTC.D Analysis
As you can see, I had marked a trigger at 61.21 yesterday, which the price didn't manage to break convincingly, showing little respect for this area, so I have removed this line. Currently, it seems that Bitcoin dominance is ranging between 61.91 and 61.49, and I believe that sooner or later, the large box ranging from 60.48 to 62.19 will be broken.
✨ If this break is from above, Bitcoin dominance could even experience more bullish legs, increasing Bitcoin's dominance in the market. However, if dominance breaks from below and the market turns bullish, altcoins could perform very well.
🔼 The trigger for today's dominance is that if 60.91 is broken, we can confirm a bearish turn in dominance, and conversely, if 61.49 is broken, we can confirm a bullish turn.
📅 Total2 Analysis
As you see, Total2 was supported from 1.01 and has moved upwards to 1.09, where it is currently being rejected. The SMA 99 in Total2 has also reached the price, and the price has reacted to it.
📉 We have a very risky trigger for a short position on Total2, which is the break of 1.06; this position is very risky and can be opened as a scalp in lower timeframes.The primary target I can consider for this position will be the area of 1.01.
📅 USDT.D Analysis
As you observe, Tether's dominance was rejected from 5.21 and could not stabilize above this area, creating a very small ranging box between 5.08 and 5.21. Currently, it's near the area of 5.08, and if this area is broken, dominance could drop to 4.92.
🎲 This drop would likely boost the market upwards, and if this area is broken, depending on Bitcoin's dominance, you can decide to open positions on altcoins or Bitcoin.
💫 Conversely, if dominance is supported from this area and moves towards 5.22, and if this area is broken, you can open short positions on altcoins or Bitcoin.
❌ Disclaimer ❌
Trading futures is highly risky and dangerous. If you're not an expert, these triggers may not be suitable for you. You should first learn risk and capital management. You can also use the educational content from this channel.
Finally, these triggers reflect my personal opinions on price action, and the market may move completely against this analysis. So, do your own research before opening any position.

TradeCityPro | Deep Search: In-Depth Of Solana👋 Welcome to TradeCity Pro! In this analysis, I will thoroughly review the SOL project, one of the largest crypto projects with a market cap of $73 billion, ranking it 6th among cryptocurrencies.
🔍What is Solana?
🔹Solana is a high-performance, permissionless blockchain platform launched in 2020 by Solana Labs (founded in 2018 by Anatoly Yakovenko and Raj Gokal).
Solana is a high-performance Layer-1 blockchain designed for speed, scalability, and low costs. Launched in 2020 by Solana Labs, it processes up to 65,000 transactions per second (TPS) with sub-second finality and low fees (~$0.0002 per transaction). Unlike Ethereum, which relies on Layer-2 solutions, Solana achieves scalability on Layer-1 using novel technologies like Proof of History (PoH). It is optimized for DeFi, NFTs, gaming, and payments, positioning itself as a fast, cost-efficient alternative to Ethereum.
—
🔹History & Background
olana’s development began in 2018, when Anatoly Yakovenko (a former Qualcomm engineer) published a whitepaper introducing Proof of History (PoH) as a new approach to timekeeping in distributed systems. The project attracted venture funding; in 2019 Solana raised $20 million in a Series A led by Multicoin Capital.
After several testnet iterations (nicknamed Tour de Sol, etc.), Solana’s mainnet beta officially went live in March 2020. The Solana Foundation, a Swiss non-profit, was also established in 2019 to steward ecosystem development.
Solana nodes take full advantage of multicore CPUs, GPUs, and high-bandwidth networks, processing transactions in parallel and pipeline fashion. The network’s 400–600 millisecond block times and capacity for multithreaded execution are a stark contrast to the single-threaded EVM model
—
🔹How Does Solana Work?
Solana’s speed and efficiency come from eight core innovations:
1) Proof of History (PoH): A cryptographic clock that timestamps transactions before consensus, reducing latency.
2) Tower BFT Consensus: A Proof-of-Stake (PoS) mechanism that leverages PoH to speed up block finalization.
3) Turbine: A block propagation system that breaks data into smaller packets for faster distribution.
4) Gulf Stream: A mempool-less forwarding system that pre-assigns transactions to upcoming validators.
5) Sealevel: A parallel smart contract execution engine, unlike Ethereum’s single-threaded execution.
6) Pipelining & Cloudbreak: A transaction processing unit and scalable storage for high throughput.
7) Archivers: A distributed storage system for historical blockchain data.
Together, these technologies enable high throughput and low fees while maintaining decentralization.
—
🔹 Solana’s Consensus Mechanism
Solana combines Proof-of-History (PoH) and Proof-of-Stake (PoS), with Tower BFT handling validator voting.
- PoH timestamps transactions, eliminating the need for validators to agree on time.
-PoS selects validators based on staked SOL, securing the network.
-Tower BFT speeds up consensus by locking validator votes, reducing fork probabilities.
-Finality is achieved within seconds, making Solana one of the fastest blockchains.
—
🔹SOL Tokenomics & Vesting
Initial supply: 500M SOL at launch (2020).
Distribution: 39% community, 25% private investors, 13% team and 10% foundation.
Inflationary model: Started at 8% annual inflation, decreasing 15% yearly until reaching 1.5% final inflation.
Token burn: 50% of transaction fees are burned, reducing supply growth.
Vesting: Early investor and team tokens had a 4-year vesting period, most fully unlocked by 2023.
—
🔹Some of wallets Supporting Solana
- Phantom
-Solflare
-Trust Wallet
- Atomic Wallet
- Exodus:
-Ledger Nano S/X
-Backpack
-Glow, Torus
—
🔹Platforms for Staking SOL
BlazeStake
marinade.finance
Jito
Lido
—
🔹Liquidity Pool Platforms
Raydium
Orca
Jupiter
Meteora
Saber
Pancakeswap
Lifinity
Saros Finance
Drift Protocol
Aldrin
Crema Finance
🔹Solana’s 2025 Roadmap and DeFi Opportunities
A key focus in 2025 is Firedancer: a new Solana validator client being developed by Jump Crypto. Firedancer aims to drastically boost Solana’s throughput and stability – it has demonstrated a theoretical capacity of over 1 million transactions per second in tests. As of early 2025, the Solana team is actively testing Frankendancer (an early Firedancer version) on testnets, pushing for a supermajority of validators to trial it. This upgrade, once fully deployed, is expected to give Solana a significant edge in scalability and help avoid the network congestion issues seen in the past.
New Token Standard (Token-22): Solana’s roadmap also introduces Token-22, an enhanced token standard designed for more functionality in payments and digital assets. Token-22 will support built-in features like automatic royalties and richer ownership controls, which is especially useful for NFTs and gaming assets on Solana. This upgrade will enable developers to create more versatile dApps – for example, NFTs with enforced royalty payments or tokens with conditional transfer rules – improving the user experience within Solana’s ecosystem
Scaling Techniques (Sharding and Parallelization): Even though Solana already handles about 50k TPS, the core team is exploring sharding and other parallelization techniques to stay ahead of future demand
Security and Stability Enhancements: After a few high-profile outages in earlier years, Solana’s developers have made network robustness a top priority. The 2025 plan includes more rigorous third-party audits and battle-testing of the network under heavy load. y diversifying its validator client software (e.g. introducing Firedancer) and adding safeguards, Solana aims to prevent single points of failure. New cryptographic techniques and quality-of-service improvements are being rolled out to harden the network against both bugs and malicious attacks
—
🔹Popular Projects on Solana
DeFi: At its peak, SEED_TVCODER77_ETHBTCDATA:10B + TVL, now recovering post-FTX collapse.
NFTs: Second-largest NFT ecosystem after Ethereum, driven by low fees.
Gaming: Web3 gaming hub with Star Atlas, Genopets, and move-to-earn projects.
DePIN (Decentralized Physical Infrastructure): Helium’s migration brought millions of new transactions to Solana.
—
🔹CertiK Skynet Score: 91.67
🔹Fundraising: $359.55 M
🔹Some of Solana Investors:
Polychain Capital
CMS Holding
a16z
Distributed Global Crypto Fund
RockawayX
Multicoin Capital
—
🔹Seed and Private Sales:
Before its public launch, Solana raised capital through several funding rounds. In 2018, a seed round sold SOL tokens at about $0.04 per token, raising approximately $3.17 million.
This was followed by private investment rounds in 2019 where tokens were priced higher roughly $0.20 to $0.25 per SOL, bringing in additional funding (over $12 million in the first private round and $5–6 million in a second round)
Solana’s public token sale occurred in March 2020 on the CoinList platform, just prior to the network’s launch. 8 million SOL (about 1.6% of the initial 500M supply) were sold in this auction-style sale at a price of $0.22 per SOL.
🔹Solana's TVL and revenue:
First, let's examine its Total Value Locked (TVL). Overall, since early November 2023, we have witnessed an upward trend with strong momentum, reflecting growing attention and trust in this ecosystem. Specifically, the amount of locked Solana has increased from 9 million SOL on November 11 to nearly 50 million SOL (March 2, 2025). However, despite the rise in TVL, the network's revenue has been on a downward trend since January 2025, dropping from 70.5 thousand SOL to 2 thousand SOL, a decrease of approximately 97.16%.
🔹Solana On-Chain Analytics Overview
Whale Activity & Large Transactions:The number of whale addresses (holding ≥10,000 SOL) peaked in January 2025 but has since slightly declined, suggesting that some large holders may have reduced their positions. On February 24, a significant whale transaction involving 846,613 SOL ($127M) sparked speculation of a potential sell-off. Meanwhile, other whales appear to be accumulating SOL, with Binance withdrawals totaling 95,600 SOL on February 28, a portion of which was moved to staking, indicating confidence in the network's long-term value.
Active and New Addresswork Expansion:Despite robust growth in total addresses, daily active usage on Solana has recently tapered off. By late February 2025, daily active addresses dropped to approximately 3.5 million, marking a three-month low for the network. However, Solana continues to see strong adoption, adding over 5 million new addresses per day, even amidst market volatility. While the total address count grows, the decline in daily active addresses to 3.5 million reflects reduced user engagement. Transaction volume has also fallen to $1.5 billion, a four-month low, and stablecoin transfer volume has plummeted from $394 billion to $7.1 billion, signaling a significant slowdown in network activity.
👀 Now that we've reviewed the project, let's move on to the chart to also technically analyze this coin
🗓 Weekly Time Frame
As you can see in the weekly timeframe, after breaking the $27.55 level, SOL initiated a strong uptrend and managed to reach its previous ATH at $255.98. Currently, a price box has formed ranging from $126.40 to $255.98, where it has been oscillating for about a year.
⭐ The floor of the box aligns with the 0.236 Fibonacci level, creating a PRZ (Potential Reversal Zone). If the box is breached downward, SOL could begin its corrective wave targeting the significant Fibonacci levels of 0.382, 0.5, and 0.618. A pullback to the SMA99 could also be a plausible scenario.
⚡️ A divergence trigger in the RSI has activated with the break below 50, indicating a potential trend change to bearish, increasing the likelihood of breaking below $126.40.
🔼 If the price finds support at $126.40, there's a high possibility it could retest the upper boundary at $255.98, especially if Bitcoin stabilizes and forms a base.
🗓 Daily Time Frame
In the daily timeframe, we can observe more detailed price movements. After being rejected at the $260.88 area, SOL started its downward trajectory, breaking below $180.63, pulling back to this level, and continuing its decline.
🔍 The critical support now stands at $126.01, where the price has touched and initially reacted to this level. A break below this support could lead to further declines in the chart. Important areas in the daily timeframe are $99.81 and $82.39.
✅ The RSI is near a crucial area, close to entering the Oversell zone. Entry into this zone could heighten the probability of a bearish scenario and the breach of $126.01.
🧩 If the price rebounds from this support, as mentioned in the weekly analysis, we could witness a move up to the box ceiling. However, for now, any buying or long positions should be held off until the price forms a new structure and we can identify clear long and short triggers.
📝 Final Thoughts
This analysis reflects our opinions and is not financial advice.
Share your thoughts in the com

TradeCityPro | Bitcoin Daily Analysis #21👋 Welcome to TradeCity Pro!
Today, we're going to dive into the analysis of Bitcoin and the crucial crypto indices. I will review the significant futures triggers for today's New York session. The market conditions haven't changed much from yesterday and continue to range between 83,779 and 87,070.
⏳ 1-Hour Timeframe
In the 1-hour timeframe, as you can see, I've outlined the Fibonacci levels because it seems that the previous bearish leg has ended, and the market is ranging, preparing for either a trend reversal or the next bearish leg.
🔄 Yesterday, I mentioned that it appeared the price was pulling back to the SMA 99 and that if the trigger at 83,779 was breached, we could confirm a pullback to the SMA 99 from the market. As you see, this did not happen, and the trigger at 83,779 was not activated.
🔍 As observed, there is a cross between the SMA 99 and the SMA 25, which has led the market to start ranging. Currently, there's a very important PRZ (Potential Reversal Zone) above the price, overlapping with the 0.5 Fibonacci zone and the resistance at 87,070. This makes it a critical area, and I suggest you stay behind the chart to see how the price reacts to this area.
🔽 If the price gets rejected from this area, we can take an early trigger for a short position, and if this area is breached, you can proceed to take a long position. However, be mindful that today is Sunday, and as you can see, the market volume has significantly decreased. This happens because the bearish leg has ended and the market is correcting, but also because it's Sunday and during weekends, market volume typically decreases. I recommend keeping an eye on risky positions such as the one at 87,070 during holidays or when the market volume is low.
⚡️ However, there are areas that are still good for opening positions even on holidays like Sunday when the market volume is low, such as the area at 83,779. In my opinion, this could cause the price to move towards its next bearish leg if this area is breached, so even if the market volume is low and it's a holiday, I think if this area is breached, significant selling volume will enter the market and for this reason, I try to keep a short position open if this area is broken.
💥 The RSI oscillator, as you see, has moved above the 50 area, and breaking this area could be a good momentum confirmation for opening a short position. If the RSI enters the oversell area, we can have momentum confirmation for the start of the next bearish leg.
👑 BTC.D Analysis
As you can see, I had marked a trigger at 61.21 yesterday, which the price didn't manage to break convincingly, showing little respect for this area, so I have removed this line. Currently, it seems that Bitcoin dominance is ranging between 61.91 and 61.49, and I believe that sooner or later, the large box ranging from 60.48 to 62.19 will be broken.
✨ If this break is from above, Bitcoin dominance could even experience more bullish legs, increasing Bitcoin's dominance in the market. However, if dominance breaks from below and the market turns bullish, altcoins could perform very well.
🔼 The trigger for today's dominance is that if 60.91 is broken, we can confirm a bearish turn in dominance, and conversely, if 61.49 is broken, we can confirm a bullish turn.
📅 Total2 Analysis
As you see, Total2 was supported from 1.01 and has moved upwards to 1.09, where it is currently being rejected. The SMA 99 in Total2 has also reached the price, and the price has reacted to it.
📉 We have a very risky trigger for a short position on Total2, which is the break of 1.06; this position is very risky and can be opened as a scalp in lower timeframes.The primary target I can consider for this position will be the area of 1.01.
📅 USDT.D Analysis
As you observe, Tether's dominance was rejected from 5.21 and could not stabilize above this area, creating a very small ranging box between 5.08 and 5.21. Currently, it's near the area of 5.08, and if this area is broken, dominance could drop to 4.92.
🎲 This drop would likely boost the market upwards, and if this area is broken, depending on Bitcoin's dominance, you can decide to open positions on altcoins or Bitcoin.
💫 Conversely, if dominance is supported from this area and moves towards 5.22, and if this area is broken, you can open short positions on altcoins or Bitcoin.
❌ Disclaimer ❌
Trading futures is highly risky and dangerous. If you're not an expert, these triggers may not be suitable for you. You should first learn risk and capital management. You can also use the educational content from this channel.
Finally, these triggers reflect my personal opinions on price action, and the market may move completely against this analysis. So, do your own research before opening any position.

UniversOfSignals | MKRUSDT 70% Move?Let's analyze and review one of the best coins in the DAo area together and find another entry point together and update our previous triggers
🌐 Overview Bitcoin
Before starting today's altcoin analysis, let's look at Bitcoin on the 1-hour timeframe. Since yesterday, Bitcoin experienced a correction, which was necessary for the market, and it pulled back to the 102135 range. The next trigger for a long position will be a breakout above 104714.
Yesterday's correction, coupled with an increase in Bitcoin dominance, caused noticeable declines in some altcoins. This highlights the importance of monitoring BTC pairs in your checklist these days.
MakerDAO’s sharp increase in fees and growth in Total Value Locked (TVL) has fueled demand. On February 20, $156.77 million of MKR was burned, reducing supply. Growth in active addresses and trading volume has driven the price higher. Strong resistance at $1,800 may limit further growth. MakerDAO’s emergency offering has raised concerns about $3.1 billion USDC exposure.
📊 Weekly Timeframe
In the weekly timeframe, the token has seen a 95% gain on the coin, which is a good sign in these market conditions!
Also, in this timeframe, we are in an opening triangle, which is characterized by high volatility, and we are constantly moving towards the bottom and top of this triangle, regardless of the ceiling and floor or support and resistance, and the exit from this triangle will also be sharp.
In this timeframe, we did not have a trigger in advance to say that we could buy or anything else, and it moved very sharply. If you lose, it is normal and do not blame yourself and your strategy.
After exiting this triangle and breaking 2.182, we can have a good trigger to buy, and for now, if you bought and held during this fluctuation and are in profit above 50%, it is logical to save profit, but if you did FOMO and bought, it is better not to continue trading and be busy watching the tutorial for now.
📝 Final Thoughts
Stay calm, trade wisely, and let's capture the market's best opportunities!
This analysis reflects our opinions and is not financial advice.
Share your thoughts in the comments, and don’t forget to share this analysis with your friends!

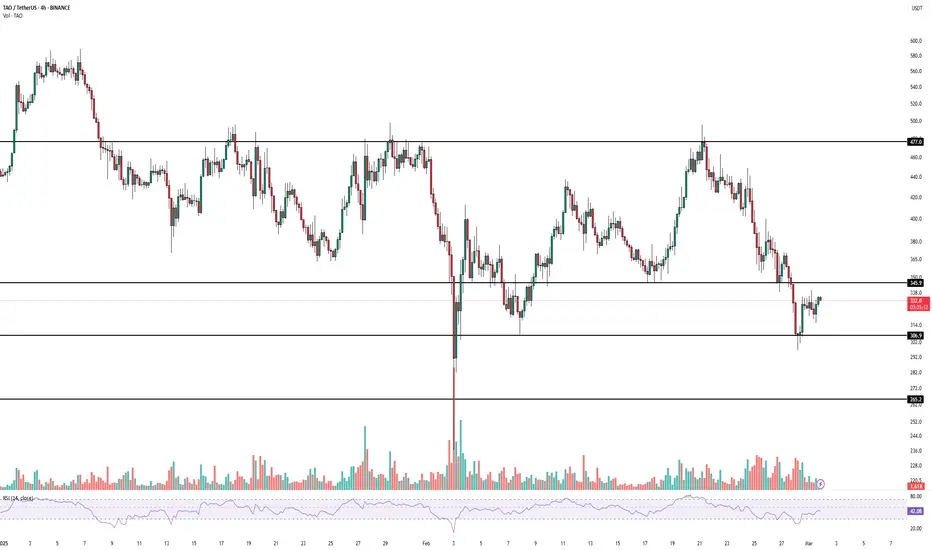
UniversOfSignals | TAO, an AI-focused cryptocurrency currentlyLet's take a quick look at TAO, an AI-focused cryptocurrency currently with a market cap of $138 million, ranked 36th in the coin market cap.
🥸 In the 4-hour timeframe, we are observing a descending range pattern with significant resistance at the area around 477. Every time the price attempts to rise, it gets rejected from this level. Recently, the support at 345.9 was broken, and the price has dropped to a lower level, reaching the support at 306.9.
⭐ The RSI oscillator has exited the oversell zone after completing a bearish leg and has returned to the normal range. The market volume appears to be decreasing, which is common on weekends.
🕯 If the support at 306.9 breaks and the RSI enters the oversell zone again, we could witness the next bearish leg down to the support at 265.2. If the price ranges today and tomorrow while the market volume is low and then breaks this support at the start of the new week, this breakdown would be more credible.
📈 As for long positions or buying, we need to wait until this bearish momentum exits the market and the price establishes a new structure. Therefore, I cannot provide a specific trigger for long positions at the moment.
TradeCityPro | MKRUSDT 70% Move?👋 Welcome to TradeCityPro Channel!
Let's analyze and review one of the best coins in the DAo area together and find another entry point together and update our previous triggers
🌐 Overview Bitcoin
Before starting today's altcoin analysis, let's look at Bitcoin on the 1-hour timeframe. Since yesterday, Bitcoin experienced a correction, which was necessary for the market, and it pulled back to the 102135 range. The next trigger for a long position will be a breakout above 104714.
Yesterday's correction, coupled with an increase in Bitcoin dominance, caused noticeable declines in some altcoins. This highlights the importance of monitoring BTC pairs in your checklist these days.
MakerDAO’s sharp increase in fees and growth in Total Value Locked (TVL) has fueled demand. On February 20, $156.77 million of MKR was burned, reducing supply. Growth in active addresses and trading volume has driven the price higher. Strong resistance at $1,800 may limit further growth. MakerDAO’s emergency offering has raised concerns about $3.1 billion USDC exposure.
📊 Weekly Timeframe
In the weekly timeframe, the token has seen a 95% gain on the coin, which is a good sign in these market conditions!
Also, in this timeframe, we are in an opening triangle, which is characterized by high volatility, and we are constantly moving towards the bottom and top of this triangle, regardless of the ceiling and floor or support and resistance, and the exit from this triangle will also be sharp.
In this timeframe, we did not have a trigger in advance to say that we could buy or anything else, and it moved very sharply. If you lose, it is normal and do not blame yourself and your strategy.
After exiting this triangle and breaking 2.182, we can have a good trigger to buy, and for now, if you bought and held during this fluctuation and are in profit above 50%, it is logical to save profit, but if you did FOMO and bought, it is better not to continue trading and be busy watching the tutorial for now.
📝 Final Thoughts
Stay calm, trade wisely, and let's capture the market's best opportunities!
This analysis reflects our opinions and is not financial advice.
Share your thoughts in the comments, and don’t forget to share this analysis with your friends!

UniversOfSignals | Bitcoin Daily Analysis #20Let's dive into the Bitcoin analysis and key crypto indices, where I will, as usual, review the futures triggers for today's New York session. The market had an upward and corrective movement yesterday, rising from the support at 78,940. Today, I aim to examine the market conditions for you.
⏳ 1-Hour Timeframe
In the 1-hour timeframe, as you can see, the price has risen from the support at 78,940 and managed to exceed the area of 83,779. A V pattern has formed and has been activated, moving the price upward. It appears that the break of 83,779 so far was a fake break.
🔼 If 83,779 is broken again, you can enter a short position targeting 78,940, but keep in mind that since the price has already faked a break, there might be an upward momentum entering the market. If 82,770 breaks, you could consider taking the risk of opening a long position.
⚡️ Personally, I prefer to open a long position with the minimum risk allowed by my strategy, but if 83,779 breaks, I will open a short position with usual risk. As you can see, the price has also hit the SMA 99 and seems to be getting rejected from it.
📉 This could be another suitable confirmation for a short position, and if the price cannot stabilize above this SMA and gets rejected from this area, breaking 83,779, we could even expect the next bearish leg towards lower lows, although the first target for us would be 78,940.
✅ The RSI oscillator has also moved out of the oversell zone and above the 50 area. A break of the 50 zone could reintroduce bearish momentum into the market.
📊 Keep in mind that today is Saturday, considered a holiday, and the market volume is very low. I generally prefer the market to range on such days and then start moving afterward.
👑 BTC.D Analysis
Let's move on to analyzing Bitcoin dominance to see how Bitcoin's dominance over the market has changed compared to yesterday. As you can see, after being supported at 60.48 and breaking the 60.91 area, it's moving upwards again.
💫 As I mentioned, a range box has formed between 60.48 and 62.19, and I told you yesterday that if the dominance stabilizes above 60.91, it could start moving towards the box's ceiling.
🎲 As you can see, this movement has started, and so far, the dominance has reached 61.21. We need to see how the dominance reacts to this area. If this area breaks, the next resistance levels for dominance will be 61.49 and 62.19.
🧲 I have nothing more to say about Bitcoin dominance. It seems to be forming an upward structure, and if this upward structure coincides with the next bearish leg of Bitcoin, altcoins could provide very good short positions and experience sharp declines.
📅 Total2 Analysis
Let's move on to analyze Total2 to see what the triggers for altcoins will be. As you can see, Total2 was supported from 1.01 and has moved upward to 1.09, where it is currently being rejected.
🔍 As you observe, the SMA 99 in Total2 has reached the price and the price has reacted to it. We have a very risky trigger for a short position on Total2, which is the break of 1.06; this position is very risky and can be opened as a scalp in lower timeframes.
🚀 The highest target I can consider for this position will be the area of 1.01.
📅 USDT.D Analysis
Let's move on to the analysis of Tether dominance. As you see, Tether's dominance was rejected from 5.50 and has moved downward, reaching back to 5.21. This index, like Bitcoin and Total2, has reached the SMA 99 and been supported from this area, and could perform its next bullish leg after breaking 5.21.
💥 In this case, you could confirm the bullish turn of Tether's dominance and validate this dominance for the next bearish leg of the price.
❌ Disclaimer ❌
Trading futures is highly risky and dangerous. If you're not an expert, these triggers may not be suitable for you. You should first learn risk and capital management. You can also use the educational content from this channel.
Finally, these triggers reflect my personal opinions on price action, and the market may move completely against this analysis. So, do your own research before opening any position.
TradeCityPro | Bitcoin Daily Analysis #20👋 Welcome to TradeCity Pro!
Let's dive into the Bitcoin analysis and key crypto indices, where I will, as usual, review the futures triggers for today's New York session. The market had an upward and corrective movement yesterday, rising from the support at 78,940. Today, I aim to examine the market conditions for you.
⏳ 1-Hour Timeframe
In the 1-hour timeframe, as you can see, the price has risen from the support at 78,940 and managed to exceed the area of 83,779. A V pattern has formed and has been activated, moving the price upward. It appears that the break of 83,779 so far was a fake break.
🔼 If 83,779 is broken again, you can enter a short position targeting 78,940, but keep in mind that since the price has already faked a break, there might be an upward momentum entering the market. If 82,770 breaks, you could consider taking the risk of opening a long position.
⚡️ Personally, I prefer to open a long position with the minimum risk allowed by my strategy, but if 83,779 breaks, I will open a short position with usual risk. As you can see, the price has also hit the SMA 99 and seems to be getting rejected from it.
📉 This could be another suitable confirmation for a short position, and if the price cannot stabilize above this SMA and gets rejected from this area, breaking 83,779, we could even expect the next bearish leg towards lower lows, although the first target for us would be 78,940.
✅ The RSI oscillator has also moved out of the oversell zone and above the 50 area. A break of the 50 zone could reintroduce bearish momentum into the market.
📊 Keep in mind that today is Saturday, considered a holiday, and the market volume is very low. I generally prefer the market to range on such days and then start moving afterward.
👑 BTC.D Analysis
Let's move on to analyzing Bitcoin dominance to see how Bitcoin's dominance over the market has changed compared to yesterday. As you can see, after being supported at 60.48 and breaking the 60.91 area, it's moving upwards again.
💫 As I mentioned, a range box has formed between 60.48 and 62.19, and I told you yesterday that if the dominance stabilizes above 60.91, it could start moving towards the box's ceiling.
🎲 As you can see, this movement has started, and so far, the dominance has reached 61.21. We need to see how the dominance reacts to this area. If this area breaks, the next resistance levels for dominance will be 61.49 and 62.19.
🧲 I have nothing more to say about Bitcoin dominance. It seems to be forming an upward structure, and if this upward structure coincides with the next bearish leg of Bitcoin, altcoins could provide very good short positions and experience sharp declines.
📅 Total2 Analysis
Let's move on to analyze Total2 to see what the triggers for altcoins will be. As you can see, Total2 was supported from 1.01 and has moved upward to 1.09, where it is currently being rejected.
🔍 As you observe, the SMA 99 in Total2 has reached the price and the price has reacted to it. We have a very risky trigger for a short position on Total2, which is the break of 1.06; this position is very risky and can be opened as a scalp in lower timeframes.
🚀 The highest target I can consider for this position will be the area of 1.01.
📅 USDT.D Analysis
Let's move on to the analysis of Tether dominance. As you see, Tether's dominance was rejected from 5.50 and has moved downward, reaching back to 5.21. This index, like Bitcoin and Total2, has reached the SMA 99 and been supported from this area, and could perform its next bullish leg after breaking 5.21.
💥 In this case, you could confirm the bullish turn of Tether's dominance and validate this dominance for the next bearish leg of the price.
❌ Disclaimer ❌
Trading futures is highly risky and dangerous. If you're not an expert, these triggers may not be suitable for you. You should first learn risk and capital management. You can also use the educational content from this channel.
Finally, these triggers reflect my personal opinions on price action, and the market may move completely against this analysis. So, do your own research before opening any position.

TradeCityPro | ONE: Key Levels and Market Analysis👋 Welcome to TradeCity Pro!
In this analysis, I want to review ONE, the token of the Harmony project. Harmony is one of the layer-1 blockchain networks and is considered one of the older crypto projects.
✨ The token currently holds a market cap of $205 million, ranking 198th on CoinMarketCap.
📅 Daily Timeframe
On the daily timeframe, as you can see, there is a large consolidation box between $0.01033 and $0.032724. In the last bullish leg, the price started from the $0.01033 low and moved up to the main resistance at $0.032724.
✅ It even broke above this level, reaching $0.04532, but was rejected and fell back into the range, turning this bullish move into a fake breakout.
⚡️ After returning to the range, the price first corrected to $0.02286. Once this level was broken, the next bearish leg pushed the price down to $0.01346. Currently, we are seeing a smaller consolidation box between $0.01346 and $0.01681.
🧩 Looking at the RSI oscillator, there is also a range between 37.05 and 50. A breakout in either direction could confirm the momentum for that direction. Naturally, a break below 37.05 would be a stronger confirmation for downside movement, as the market momentum is already bearish.
📊 If $0.01346 is broken, the price could move toward the bottom of the large range at $0.01033.If $0.01033 is broken, a new all-time low (ATL) is likely to be registered.
🔼 On the bullish side, if the $0.01346 support holds and the $0.01681 resistance is broken, we can expect the price to rally toward $0.02286 and possibly even $0.03274.
🛒 For spot buying, I prefer to wait until this coin shows strength against Bitcoin and Bitcoin dominance starts declining. My spot trigger is currently at $0.04532, and I will not enter a position before this level is broken.
⏳ 4-Hour Timeframe
On the 4-hour timeframe, the price remains within the same range as identified in the daily timeframe.
🔽 For a short position, if $0.01327 is broken, you can enter a short trade targeting the bottom of the range.
📈 For a high-risk long position, if $0.014825 is broken, you can target the top of the range, but this trade is very risky.The main long position will be confirmed if the price breaks above $0.01681.
🔑 Regarding indicators and oscillators, I don’t have much to say in this ranging market. Volume is also low, making it difficult to rely on momentum indicators in this sideways phase.
📝 Final Thoughts
This analysis reflects our opinions and is not financial advice.
Share your thoughts in the comments, and don’t forget to share this analysis with your friends! ❤️

AnalysisAnalysis 🚨
NASDAQ:AVL is testing the red resistance zone 🔴. If the breakout is successful, the first target will be the green line level 🟩.
🎯 Target:
🔵 1️⃣ First Target: Green line level
