GOLD - single support , short below .#GOLD... now we have single supporting area that is 3310
Keep close keep in mind that below that market will drop towards triangle trend line again ..
Good luck
Trade wisely
Tradingview

BTCUSD VIP Analysis – Clean Breakout Toward 109K + Target🧠 Full Technical Breakdown for TradingView & Minds
🗓 Date: June 9, 2025 | Asset: Bitcoin (BTC/USD) | Chart: 2H Timeframe
Bitcoin is currently staging a strong breakout rally after consolidating within a bullish structure. This move appears to be fueled by smart money accumulation and could lead us directly into a high-probability reversal zone just below 109K.
Let’s dive into the full structure and what traders should look out for next.
🔍 1. Previous Market Behavior (Left Side of Chart):
Before the breakout, BTC had been trading inside a bearish channel, experiencing sharp rejections and forming lower highs. This downtrend climaxed at the Previous Reversal Zone, where strong buyer interest kicked in — this is a textbook example of a liquidity grab followed by buyer absorption.
📈 2. The Reversal & Blue Ray:
From the Previous Reversal Zone, BTC formed a solid impulsive move upward — this is where the Blue Ray trendline was drawn. This level acted as the initial support for the new bullish structure.
The move from this point formed a new trend, indicating that buyers had successfully reclaimed short-term control of the market.
🟩 3. Central Zone – Bullish Reaccumulation Area:
As BTC progressed, it entered a green bullish channel, which we’ve labeled the Central Zone. This zone shows consolidation within a rising wedge, typically a continuation pattern if volume remains steady.
Notice how price respected both boundaries of the channel multiple times before exploding upwards. This is a sign of smart money reaccumulation, where institutions are quietly preparing for the next leg.
🚀 4. Breakout to the Upside:
BTC has now broken out cleanly from the Central Zone with an aggressive bullish candle, pushing price above 106,000. This breakout suggests a mid-move continuation, and current price action is heading straight for the Next Reversal Zone between 108,800–109,200.
Also note the clean cross above the 50% Fibonacci zone, which further supports the bullish thesis.
🔹 5. Next Reversal Zone (Target Area):
This is the most critical zone on the chart. Price may:
Reject sharply from this area (short opportunity),
Consolidate before continuation,
Or sweep liquidity above it and reverse hard.
This zone could act as a smart money sell zone, where large players unload positions, especially if retail traders jump in late.
🧮 6. Possible Scenarios Ahead:
Scenario A – Bullish Continuation:
Price breaks 109K cleanly with volume.
Next target: 111K–112K (extension level).
Scenario B – Rejection from Reversal Zone:
Price stalls near 109K.
Bearish engulfing candle forms.
Short opportunity back toward 106K–104K.
Scenario C – Fakeout Above 109K:
Price sweeps highs (liquidity trap).
Fast reversal back into Central Zone.
🎯 Trade Setups:
🚨 Breakout Buy (Already Triggered):
Entry: 105,500–106,000
Target 1: 107,500
Target 2: 108,800
SL: 104,800
🛑 Reversal Short (Pending):
Entry: 108,900–109,100 (with confirmation)
Target: 106,000
SL: 109,600
⚠️ Fundamental Awareness:
Multiple U.S. economic events this week (see calendar icons below the chart).
Increased volatility expected — use smaller positions or wider stops near data release times.
📌 Final Thoughts:
This is a classic example of smart money behavior — liquidity grab, controlled reaccumulation, then a breakout toward a magnet zone (reversal supply). If you're already in the move, manage your positions. If not, wait for price action confirmation near the key zone.

TradeCityPro | ADA: Holding Key Support Inside Descending Channe 👋 Welcome to TradeCity Pro!
In this analysis, I want to review the ADA coin for you, one of the most popular cryptocurrencies, currently ranked 10th on CoinMarketCap with a market cap of 23 billion dollars.
📅 Daily Timeframe
As you can see in the daily timeframe, the price is fluctuating between two key support and resistance zones. Additionally, there's a descending channel in play, and the price has recently been rejected from the top of this channel and moved down to the support zone.
✨ The 0.61 zone is a very strong area, and the price has reacted to it multiple times. It was broken once, but as the price reached the bottom of the channel, it was supported again and moved back above the level — indicating a possible fakeout.
✔️ If this zone is broken again, the likelihood of another drop toward the 0.5579 level or the bottom of the box increases. So I think it’s worth considering a short position on lower timeframes if this zone breaks.
💥 RSI entering the oversold area would be a strong momentum confirmation trigger for this trade.
📊 Currently, ADA's volume is quite low, and with this low volume, it’s not suitable for either long or short positions. I suggest waiting until significant volume enters ADA before taking a position.
🛒 For spot buying or long-term long positions, the first trigger is the price's reaction to this support zone. If a confirmation candle forms here, we can consider entering. However, in my view, this trigger is risky, and I personally prefer to wait for more reliable confirmations.
📈 A more reliable trigger would be a breakout of the descending channel. If either the channel itself or the 0.8414 trigger is broken, we can enter a position. And if you want the strongest confirmation and wish to enter with the main trend, you should wait for the 1.1325 level to be broken.
❌ Disclaimer ❌
Trading futures is highly risky and dangerous. If you're not an expert, these triggers may not be suitable for you. You should first learn risk and capital management. You can also use the educational content from this channel.
Finally, these triggers reflect my personal opinions on price action, and the market may move completely against this analysis. So, do your own research before opening any position.

NZDCAD - TECH.Hello dear Traders,
Hello TradingView!
Today, in this chart, we will have some technical views about NZDCAD.
ABCD pattern triangle for this time looks like it has lost its weight, and soon the price will start coming down...
The price is still testing the bottom level of the ABCD triangle pattern.
My recommendation on this pair is to wait for a good sell opportunity...
TP1: 0.81669
TP2: 0.81360
Wishing you good luck and a profitable day!

NOKJPY – Detailed Macro Analysis & Trade IdeaMacro Bias: LONG NOK / SHORT JPY
Why NOKJPY?
1. Fundamental Macro (ENDO):
Norway (NOK):
Strong inflationary pressure, positive PMI, robust M2 growth.
Massive fiscal surplus driven by energy exports – best debt/GDP ratio in the G10.
Norges Bank still maintaining relatively high interest rates.
Positive Terms of Trade, central bank balance sheet (CBBS) is shrinking (long-term bullish for NOK).
Japan (JPY):
Economic stagnation and deflationary risks, weak PMI and consumer spending.
Negative real yields, central bank remains ultra-accommodative, extreme debt/GDP ratio.
Persistent deflationary sentiment – classic “funding currency” for global carry trades.
2. COT Positioning (Commitments of Traders):
JPY is the most crowded short in the entire G10: hedge funds and leveraged funds are aggressively short JPY.
NOK positioning is neutral to slightly long – no overcrowding risk on the long side.
3. EXO & Sentiment Signals:
Terms-of-trade and projected GDP/CPI all favor NOK.
Sentiment, macro “score,” and risk/reward models consistently generate a long NOKJPY signal.
Exogenous indicators (futures, commodity impulse, sentiment, parity) all support NOK strength.
4. Technicals & Carry Edge:
NOKJPY remains in a strong multi-month uptrend.
Major carry advantage: NOK rates are much higher than JPY, yielding significant positive swap.
Every recent pullback has been bought, and momentum remains bullish.
Key Reasons for the Trade:
Multi-model consensus: No contradiction between macro, COT, exo, and technicals.
NOK is “king of G10” by every fundamental measure; JPY is the weakest currency this cycle.
Textbook carry trade for 2025.
Risks:
Only a sudden global “risk-off” or a central bank policy shock could temporarily disrupt the trend.
Currently, there is no crowding risk on NOK longs.
SUMMARY:
LONG NOKJPY is the cleanest, highest-conviction swing trade for this cycle – every model (macro, COT, exo, sentiment, carry) is in agreement.
Every meaningful pullback is a buying opportunity.

TRBUSDT - Bottom out here? What's next??#TRBUSDT ... market just near to his bottom and looking bottom out here
Keep close and if market holds his current mentioned area than we can expect a bounce from here.
Good luck
Trade wisely

BTC, where we can setup our sell positions.Hello, dear traders! It's Nika again.
I want to share this beautiful pattern and tell you some about its meaning...
---
So, as we see here, we have this "triangular-shaped uprising pattern".
We got this pattern with its own few supporting and formatting levels.
Almost all of them are marked on our chart!
---
The "usage" of this may be something like this...
First, we may see the price testing an important price level of pattern 96,000,00 very soon...
---
After, if the price continues checking support levels below, we may also see the 91 & 89 K price levels.
You will profit from this price movement only if the price goes this way. :)
---
Wishing you a happy trading day and much more success in your trades!
---
If you have any questions, please comment or send a message.
Thank you!

Skeptic | This Week's Most Profitable Setups: Gold, Forex & SPX!hey, traders, it’s Skeptic ! 😎 Our last watchlist was straight fire, racking up some sweet profits with tons of setups. This week’s looking just as juicy, so stick with me to catch these killer opportunities! 🚖 Welcome to my Weekly Watchlist, where I lay out the markets I’m trading with active triggers—forex pairs, commodities, and CFD indices. No FOMO, no hype, just pure reasoning to keep your trades sharp. Let’s jump in! 📊
DXY (Dollar Index)
Let’s kick off with DXY, ‘cause getting this right makes analyzing other indices and pairs a breeze. After multiple failed attempts to break support at 98.8 , it’s still ranging. This is a monthly support, so confirmation of a break needs to come on a monthly or at least weekly chart. Personally, I’m betting it’ll bounce from here. A break above 99.36 gives early confirmation of a rise, but the real deal is breaking resistance at 100 —then you can short USD pairs like EUR/USD . If 98.8 gives way, look for longs, but this monthly zone is tough, so expect some chop! 😬
EURX
EURX seems to be in a weak upward channel. A break above 1063 could push us to 1071 . On the flip side, breaking the channel’s midline at 1058 might drag us to the floor or even support at 1049 . So, our EURX game plan is clear.
Watchlist Breakdown
Let’s hit the watchlist, starting with XAU/USD (Gold ).
Triggers here are tricky, but I cloned last week’s downward channel and placed it above—this trick often gives us solid setups. If we bounce off the channel’s floor, a break above resistance at 3340 opens a long. For shorts, I don’t have a trigger yet since the market’s already dumped. If we form a 1-hour range, a break below its floor could trigger a short targeting 3249 or the previous channel’s midline.
Now, XAG/USD (Silver)
—no triggers this week. Our long trigger from last week’s analysis at 33.68 smashed it, spiking 8%! 🎉 That’s a lock even Bitcoin traders would drool over, but in Skeptic Lab :)
Next, EUR/USD.
The long trigger is set at a break above resistance at 1.14555 , which lines up with the DXY support break I mentioned. Heads-up: this trade won’t be easy. Reduce risk ‘cause we’re in for a big fight at this level—wild swings and tight stop losses get hunted fast. Stay sharp! 😤
GBP/USD Update
My GBP/USD long got stopped out, so let’s break it down. I went long after a resistance break, with crazy uptrend momentum and RSI hitting overbought (which I see as a long confirmation). Everything looked dope except my stop loss placement. The prior move was so sharp that my stop had to be wide, tanking my R/R. It hit the box ceiling target but then dumped, nailing my stop. Lesson? Either jump in before the main momentum or let the move play out and skip it. Mid-move entries with big stops? Recipe for pain...
SPX 500
Our SPX 500 long trigger from breaking the box ceiling already fired and seems to have pulled back. My target’s 6128.55 , and my open position has a stop loss below 5952.51. If you missed last week’s trade, a new trigger could be a 1-hour resistance break at 6014.20 . If you’re already long, no need to double up.
Final Note
my max risk per trade is 1%, and I suggest you stick to that or lower. I’m cooking up a Money management guide soon, diving deep into why it’s the key to outpacing 90% of traders and boosting your odds of consistent profits. Stay tuned! 🚨 No FOMO, and have an awesome week!
💬 Let’s Talk!
If this watchlist lit a spark, hit that boost—it means a ton! 😊 Got a pair or setup you want me to tackle? Drop it in the comments. Thanks for rolling with me—keep trading smart! ✌️

TradeCityPro | Bitcoin Daily Analysis #111👋 Welcome to TradeCity Pro!
Let’s take a look at Bitcoin and key crypto indicators. As usual in this analysis, I’ll review the futures triggers for the New York session.
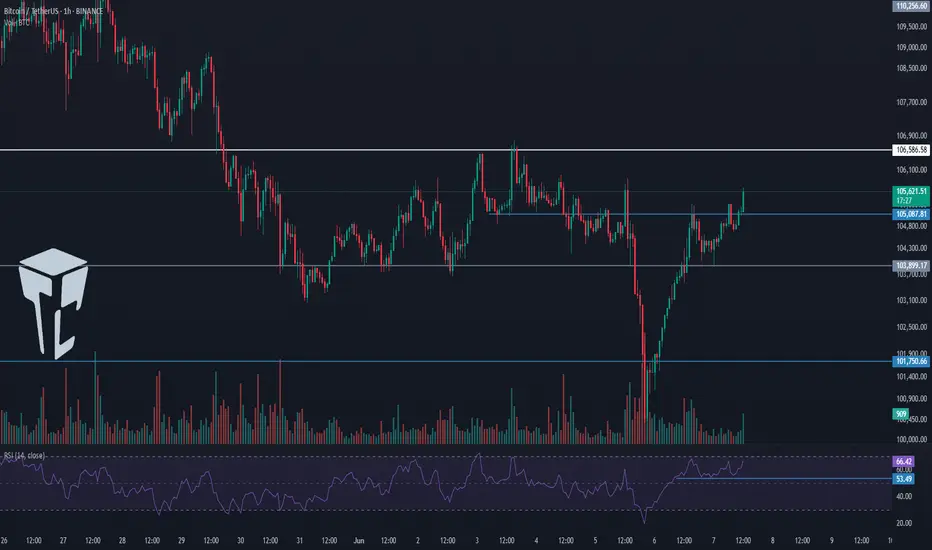
⏳ 1-Hour Timeframe
As you can see in the 1-hour timeframe, none of our triggers were activated yesterday and Bitcoin has been ranging.
⭐ There was an important RSI level at 53.49, which was tested multiple times. I mentioned that breaking this level could trigger a slight correction — and that’s exactly what happened. The price pulled back slightly to 105087, retested this zone, and now RSI has returned above 53.49. Price is also moving with strong bullish momentum toward the 105851 resistance.
📊 The buying volume entering the market is quite strong, and if this increase continues, the price could begin an upward move. So in terms of both momentum and volume, we have bullish confirmation and can enter a position if the triggers activate.
📈 For a long position, the trigger we’re watching is 105851. While the main resistance is at 106586, I prefer to take the risk and open the position earlier, because I think the 106586 break won’t provide a clean entry and would be harder to act on.
✨ So my chosen trigger for a long position is 105851. Given the rising volume and high RSI momentum, we have the confirmations needed to open this trade.
🔽 For a short position, the first trigger is the break of 105087. This is a risky position since we haven’t yet confirmed a trend reversal — this would be the first signal if a downtrend begins. Personally, I’ll wait for confirmation of bearish momentum before opening a short.
👑 BTC.D Analysis
Bitcoin Dominance is still below the 64.67 level and is ranging under this resistance.
🧩 A break above 64.67 would confirm a bullish move in dominance. A break below 64.49 would signal a bearish reversal.
📅 Total2 Analysis
Total2 is ranging below the 1.15 level. A break above this zone could initiate a bullish move.
🔔 On the bearish side, the current trigger is the 1.13 level. We need to wait for this level to be broken for a trend reversal confirmation.
📅 USDT.D Analysis
Tether Dominance stabilized below the 4.79 zone yesterday and has now pulled back to it, preparing for a possible second leg downward.
🔑 If that happens, the crypto market could move upward. However, if USDT.D rises back above 4.79, its uptrend could continue.
❌ Disclaimer ❌
Trading futures is highly risky and dangerous. If you're not an expert, these triggers may not be suitable for you. You should first learn risk and capital management. You can also use the educational content from this channel.
Finally, these triggers reflect my personal opinions on price action, and the market may move completely against this analysis. So, do your own research before opening any position.

QNT Accumulating Under Resistance — Big Move Ahead?QNT is showing strength, but a key test lies ahead.
After breaking out of its previous downtrend (red line), QNT has formed a strong rising structure supported by the blue trendline.
The price is currently consolidating just below the key resistance zone, attempting to gather momentum. This is a classic sign of healthy price action — retesting higher levels while maintaining support.
As long as QNT holds the strong rising support line and the lower support zone, the bullish structure remains intact. A clear breakout above the resistance zone could trigger the next leg higher.
However, if price breaks below the rising support, we could see a pullback toward the lower zone for re-accumulation.
For now — it’s a wait and watch at the resistance. Bulls need to prove their strength.
DYOR, NFA

TradeCityPro | NEAR: Key Support Battle in Layer 1 AI Protocol👋 Welcome to TradeCity Pro!
In this analysis, I’m going to review the NEAR coin for you — one of the prominent AI-focused and Layer 1 protocols that has gained significant attention in recent years.
🔍 This project’s coin, with the ticker NEAR, currently holds a market cap of $2.94 billion, ranking 34th on CoinMarketCap.
📅 Daily Timeframe
As you can see in the daily timeframe, there is a very strong support level at 2.239, which has been tested multiple times. The price has once again reached this zone.
✨ If this level breaks, the price could drop toward lower supports such as 1.694. Therefore, a break below 2.239 would be a valid trigger for a short position.
💫 The trendline drawn on the chart is also a significant level. If 2.239 is broken, price could potentially react to this trendline as well.
💥 If price holds this support and attempts a bullish move, we can open a long position upon breaking 2.653.
📈 The main long triggers, including potential spot buying, are at 3.355 and 3.548. If these levels are broken, NEAR could begin a strong uptrend toward targets at 4.726 and 7.998.
📊 Currently, market volume is ranging — buyers and sellers are evenly matched. We need to wait and see which side gains dominance to follow the momentum.
✔️ On the RSI oscillator, entering the Oversold zone would confirm a short setup, while breaking above the 50 RSI level would confirm a long setup.
📝 Final Thoughts
This analysis reflects our opinions and is not financial advice.
Share your thoughts in the comments, and don’t forget to share this analysis with your friends! ❤️

Ripple Analysis - What Shall we Expect !!!If the price can break through this channel's resistance, I expect it to reach $2.5 in a short time.
Stay Awesome , CobraVanguard

TradeCityPro | Bitcoin Daily Analysis #110👋 Welcome to TradeCity Pro!
Let’s dive into the Bitcoin analysis and major crypto indexes. In this review, as usual, I’ll cover the key futures triggers for the New York session.
⏳ 1-Hour Timeframe
As you can see in the 1-hour timeframe, Bitcoin formed a higher low yesterday and has now reached the 105087 resistance. It seems likely that this level will be broken soon.
✨ Currently, a candle has closed above 105087, but price hasn’t yet confirmed a breakout, and the move hasn’t taken off.
📈 For a long position, we can enter once the price confirms a breakout above this level. If 105087 breaks, price could target 106586. The main long position will be opened upon breaking 106586.
🛒 Strong buying volume is a very good trigger for this setup. RSI entering the Overbought zone would also provide a powerful momentum confirmation, and price could rise accordingly.
💥 If the current upward move fails and price falls below the recent low, we can open a short position upon breaking 103899, targeting 101750.
⚡️ The 53.49 level on RSI is critical — its break would serve as a strong confirmation for the short position.
👑 BTC.D Analysis
Looking at Bitcoin Dominance, yesterday it once again moved toward 64.67, but failed to break it and is now heading downward after being rejected from that resistance.
🔑 The trigger for bullish continuation remains 64.67, while 64.49 serves as the trigger for a bearish move.
📅 Total2 Analysis
This index formed a higher low at 1.13 yesterday and is now testing the 1.15 resistance. If this level breaks, the price could head toward 1.17 and 1.18.
📊 A break above 1.15 would be a valid long trigger. However, if price is rejected and moves downward, breaking 1.13 could send it back toward 1.1.
📅 USDT.D Analysis
USDT Dominance closed below the 4.79 level yesterday and is now moving toward 4.70. If this continues, the crypto market could see bullish momentum.
🧩 However, if dominance moves back above 4.9, the next bullish leg in USDT.D could begin.
❌ Disclaimer ❌
Trading futures is highly risky and dangerous. If you're not an expert, these triggers may not be suitable for you. You should first learn risk and capital management. You can also use the educational content from this channel.
Finally, these triggers reflect my personal opinions on price action, and the market may move completely against this analysis. So, do your own research before opening any position.
TradeCityPro | ATOM: Major Support Test in Cosmos Ecosystem Coin👋 Welcome to TradeCity Pro!
In this analysis, I’m going to review the ATOM coin for you. This project is part of the Osmosis network ecosystem.
🔍 ATOM, with a market cap of $1.68 billion, is currently ranked 51st on CoinMarketCap.
📅 Daily Timeframe
As you can see in the daily timeframe, ATOM is currently sitting on a very significant support zone. It has tested this area multiple times, and once again, it’s hovering around that level.
⭐ If the price finds support here and begins to move upward, we can consider entering a long position with a trigger at 4.588. The main bullish trigger will be the 5.380 level, and if that breaks, spot buying can also be considered.
✨ As I always mention with spot triggers on altcoins, it’s best to wait for Bitcoin dominance to start declining before entering. If that happens, ATOM could potentially move toward targets at 7.514 and 10.4.
⚡️ If the key support at 4.075 breaks, we can open a short position targeting 3.501. The 35.68 level on the RSI is a critical support, and a break below it would serve as a momentum confirmation.
📊 Also, keep an eye on market volume. It has been declining recently, and once volume starts flowing in on either side, we can prepare to act on the corresponding trigger.
📝 Final Thoughts
This analysis reflects our opinions and is not financial advice.
Share your thoughts in the comments, and don’t forget to share this analysis with your friends! ❤️

Long-Term Technical Outlook: Critical Decision Point Approaching
The chart illustrates a long-term technical structure where the price has been following an ascending channel after a prolonged bearish trend. However, recent price action indicates a breakdown below the green ascending trendline, raising concerns about a potential shift in market sentiment.
Currently, the $117 level is acting as a pivotal support zone. A sustained breakdown below this level — and more critically, below the red lower trendline — would validate the bearish scenario. This could trigger a deeper correction phase, with downside targets aligned along the red projection path. Such a move may lead to significantly lower price levels in the medium to long term.
🔽 Bearish Scenario:
If the price fails to hold above $117 and breaks below the red trendline, this would confirm the start of a bearish leg. Based on historical structure and projected trajectories, this could result in a descent toward the $93 level initially, with the possibility of extending further downward depending on market conditions.
🔼 Bullish Scenario:
On the other hand, if the price manages to reclaim the green trendline and more importantly, stabilize above the $204 resistance zone, it would signal renewed bullish strength. Such a move would open the path toward higher highs, potentially re-entering the previous upward channel and continuing the macro uptrend.
🧭 The price structure is now approaching a decisive zone, where either a confirmation of bearish continuation or a bullish recovery will likely unfold. Both scenarios have been visually outlined — green lines indicating bullish continuation, and red lines representing bearish momentum.
📌 Note: This analysis is for educational purposes only and should not be interpreted as financial advice.

TradeCityPro | Bitcoin Daily Analysis #109👋 Welcome to TradeCity Pro!
Let’s dive into the Bitcoin analysis and key crypto indicators. As usual, I’ll walk you through the futures triggers for the New York session.
⏳ 1-Hour Timeframe
In the 1-hour chart, as you can see, yesterday Bitcoin activated the short trigger at 103899 and dropped below the 101750 level. This setup gave an opportunity to open a short position—hopefully you took advantage of it.
✨ After that bearish leg, the downtrend ended and the price began to rise again, now reaching back to the 103899 level.
🔍 If the price gets rejected once from 103899 and then forms a higher low compared to 101750, we can consider a long position on subsequent attempts—if 103899 breaks. If the price breaks this level sharply, the next long triggers will be 105087 and 106586.
📉 For today's short position, we can enter on a pullback to 103899. Personally, I’ll look for a bearish trigger in lower timeframes; if confirmed, I’ll open a short. The main bearish trigger remains the break of 101750.
📊 Currently, volume favors buyers, but we’ve seen divergence during this bullish leg, and volume increased on the last bearish move. So, I still see a higher probability of the market turning bearish rather than bullish.
👑 BTC.D Analysis
Looking at Bitcoin dominance, yesterday it made an upward move to 64.67 after breaking through 64.23. This 64.67 level is a strong resistance, and as shown, the dominance got rejected there.
💫 If this rejection is confirmed, there's a high chance of a retracement back to 64.23. In that case, if the market continues to drop, Bitcoin will likely be a better short than altcoins.
☘️ However, if 64.67 breaks, dominance could initiate another bullish wave.
📅 Total2 Analysis
As for Total2, after activating the 1.16 and 1.13 triggers, it dropped to the 1.1 zone and is now making a pullback to its previous support—similar to Bitcoin.
💥 For a long position, we’ll need a Dow Theory confirmation. For a short, we can wait for a pullback to 1.13 and look for a bearish confirmation to enter.
📅 USDT.D Analysis
Now onto Tether dominance: yesterday, after breaking 4.79, it moved up to 4.98. Following that, it reversed and is now back down to 4.79.
🔑 If 4.79 breaks, Tether dominance could drop further to 4.70 and 4.64. But if it holds and finds support there, another bullish leg may begin.
❌ Disclaimer ❌
Trading futures is highly risky and dangerous. If you're not an expert, these triggers may not be suitable for you. You should first learn risk and capital management. You can also use the educational content from this channel.
Finally, these triggers reflect my personal opinions on price action, and the market may move completely against this analysis. So, do your own research before opening any position.

LINK's situation+ Target PredictionSo if you pay attention to the LINK chart you can see that the price has formed a Ascending wedge which means it is expected to price move as equal as the measured price movement.( AB=CD )
NOTE: wait for break of the WEDGE .
Give me some energy !!
✨We spend hours finding potential opportunities and writing useful ideas, we would be happy if you support us.
Best regards CobraVanguard.💚
_ _ _ _ __ _ _ _ _ _ _ _ _ _ _ _ _ _ _ _ _ _ _ _ _ _ _ _ _ _ _ _
✅Thank you, and for more ideas, hit ❤️Like❤️ and 🌟Follow🌟!
⚠️Things can change...
The markets are always changing and even with all these signals, the market changes tend to be strong and fast!!

BTCUSDT - at CUT n REVERSE AREA ? Holds or not??#BTCUSDT.. market just reached near to his ultimate aea that is around 104300
keep close that area because should holds above that if there is further buying scnerios.
otherwise below that not at all.
good luck
trade wisely


ES Trade Idea and Upcoming NFP ReportCME_MINI:ES1!
• What has the market done?
ES futures are lagging compared to tech heavy index NQ futures. ES futures are still below yearly open. Yearly open has been a strong area of resistance since the rally of April 6th Lows in futures complex.
• What is it trying to do?
ES futures are in consolidation mode, building value higher. VPOC has shifted higher since the gap up from May 11th open. VPOC and 0.786 fib level provide a base for a continuation higher.
• How good of a job is it doing?
Markets seem to be slowing its rally. After such a strong rebound, participants are wary of any pull-backs. Although a strong trend higher, consolidation or a pullback is not illogical at these levels.
• What is more likely to happen from here?
o Scenario 1: Hold steady and NFP provides needed boost for markets to get across yearly open resistance and climb higher.
o Scenario 2: A mixed NFP report may point towards further consolidation. Key level 5873 as support on move lower before reverting higher.
o Scenario 3: A hawkish NFP report that signals higher for longer rates, may be interpreted by market participants as less monetary stimulus and dwindling rate cut bets for this year. We anticipate a sell-off towards 0.618 fib level in this scenario, moving to the lower edge of micro composite volume profile.
In all the above scenarios, there is a clear LIS at yearly open. Other key levels are defined cleanly on the higher time frame. Important thing for traders to note here is to trade what you see and not what you think. Having an alignment between fundamentals and technicals is sound but the markets do what they do, and price moves where it should. Painting narrative to any move may sound fancy but it gets less important at intraday time frames in our opinion. Hence why we view all this considering auction markets and volume profile.
Glossary:
ES - emini-S&P 500 Futures
NQ - emini-NASDAQ 100 Futures
VPOC - Volume Point of Control: The most traded price by volume in a given range. Represents acceptance or consensus
NFP - Non-Farm Payroll: Released by the US Department of Labor around the 1st Friday of every month. It reports on Unemployment, Productivity and other key metrics. Key economic release
LIS - Line In the Sand: A key zone that might tip buyers or sellers to act to cover risk and might change the overall bias of our analysis

GOLD - Reached at ultimate Resistance? whats next??#GOLD. market perfectly bounced above our area that was 3382
now market just reached at his today most expensive region that is 3402-04
keep close that region and if market hold it in that case we can expect drop from here..
keep close it.
NOTE: keep in mind that above 3402-04 we will go for cut n reverse on confirmation.
good luck
trade wisely

GOLD - where is current Resistance? Holds or not??#GOLD... perfect holdings and bounced back and now market have his ultimat resistance area is 3382-84
Thats play key role from yesterday and in today it will be our key level.
Keep close and only hold shorts below that other use not
Note: above 3382 we will go for cut n reverse on confirmation.
Good luck
Trade wisely

TradeCityPro | Bitcoin Daily Analysis #108👋 Welcome to TradeCity Pro!
Let’s dive into the analysis of Bitcoin and key crypto indices. As usual, in this analysis, I’ll review the futures session triggers for New York.
⏳ 1-Hour Timeframe
As you can see in the 1-hour timeframe, yesterday the 105087 trigger was activated, and now after a pullback to that level, the price is heading toward the 103899 support.
💥 If you entered a short position based on the 105087 trigger, you can hold it until 103899. If you haven’t opened a position yet, you can consider today’s triggers.
🔽 The first short trigger for today is the 103899 level. A break below this level can start a major bearish move. Personally, I’ll enter a short if this level breaks.
⚡️ Breaking below 38.95 on the RSI will give us a suitable momentum confirmation. If selling volume increases, the probability of a bearish move will rise.
📈 For long positions, our first trigger is the same 105087 level. If a higher low is formed compared to 103899 and this level breaks, it will provide a good long opportunity.
💫 The main long trigger is 106586. If this level is broken, the uptrend can resume and price could move toward higher resistance levels.
👑 BTC.D Analysis
Looking at Bitcoin Dominance, a range box has formed between 63.93 and 64.23.
✨ A break above 64.23 confirms bullish continuation, while a break below 63.93 confirms a bearish trend in dominance.
📅 Total2 Analysis
Moving to Total2, yesterday it closed below 1.17, and now after a pullback, it's heading toward 1.16.
✅ If 1.16 breaks, a short position can be opened. If the downward move turns out to be fake, a break above 1.18 gives us a long trigger.
📅 USDT.D Analysis
Looking at Tether Dominance, yesterday it confirmed above 4.70 and is now moving toward 4.79. A break of 4.79 could signal a continuation of the upward move.
📊 If it closes back below 4.70, the price could move toward 4.64. A break below 4.64 would signal a bearish trend in USDT dominance.
❌ Disclaimer ❌
Trading futures is highly risky and dangerous. If you're not an expert, these triggers may not be suitable for you. You should first learn risk and capital management. You can also use the educational content from this channel.
Finally, these triggers reflect my personal opinions on price action, and the market may move completely against this analysis. So, do your own research before opening any position.
