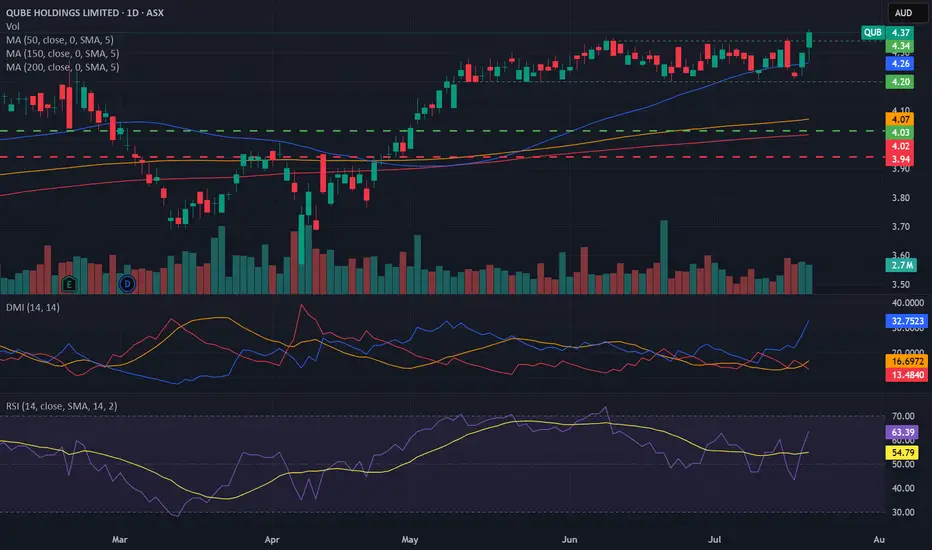
Bullish potential detected for QUBEntry conditions:
(i) higher share price for ASX:QUB along with swing up of indicators such as DMI/RSI.
Depending on risk tolerance, the stop loss for the trade would be:
(i) a close below the bottom of the formed channel (i.e.: below $4.20), or
(ii) below previous support of $4.11 from the open of 9th May, or
(iii) below the rising 150 day moving average (currently $4.07).
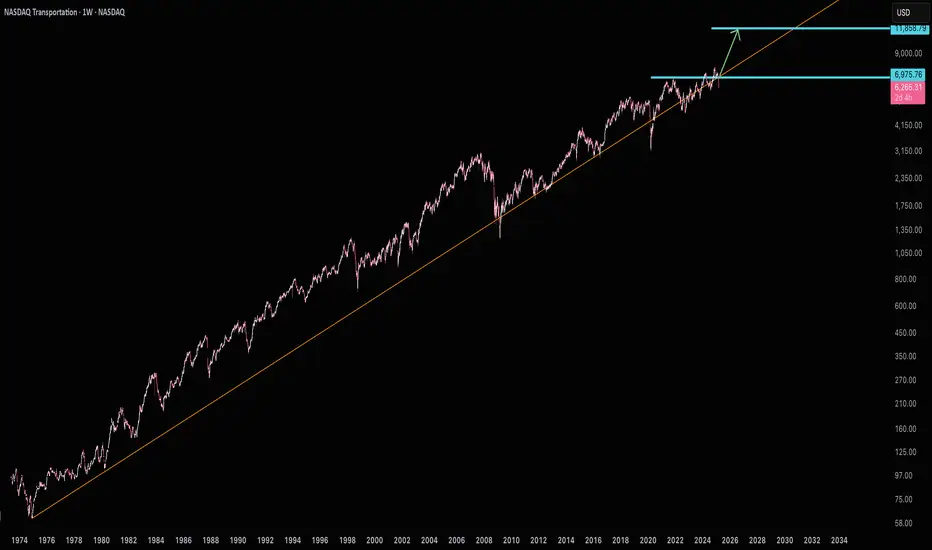
Transports
Transports Ready for Lift OffTransports have never fallen below this trend line for long and they are squeezing right into resistance. That signals to me a big move ahead for transports reaching 11,850. Search through the components and find your favorites.
Discounted GrowthRev Growth YoY and FWD are 50 and 23% respectively and 307 and 167% above the sector respectively while PE GAAP TTM and FWD are 71 and 65% below sector! This implies a huge discount in growth.
Gross Profit does lag behind the sector by about 12%, but the valuation combined with the outsized growth substantially off-sets this disparity.
On a technical note, there is an intermediary "W" pattern. Confirmation of this pattern would be realized once the SP closes above the midpoint peak of @25.75 along w/ substantial volume, 3 day rule, etc. Pattern and targets are also correlated with Fibonacci retracement levels and Fib Time series.

SPX & Dow divergencesI firmly believe the Dow transports are an important leading metric to identifying the overall strength in the economy.
Since the highs in Feb, transports have not participated in the rally to the upside.
What this tells me under the hood of this economy we are seeing weakness.

7/4/22 FDXFedEx Corporation ( NYSE:FDX )
Sector: Transportation (Air Freight/Couriers)
Market Capitalization: $57.955B
Current Price: $223.61
Breakout price: $231.00
Buy Zone (Top/Bottom Range): $219.70-$198.80
Price Target: $270.00-$276.80
Estimated Duration to Target: 266-278d
Contract of Interest: $FDX 1/20/23 220c
Trade price as of publish date: $27.06/contract

LONG SETUP DJTWe ripped her down, let's see if we can't rip her back up!
This is of course, my favorite market-leading indicator.

Potential H&S in FEDEX (mid long term)Potential H&S in FEDEX (mid long term)
First target 180 then 150
Keep unloading

Dow Transports - Weekly Sell SignalDow Theory Sell Signal is Active.
__________________________________________________________
The Primary Global Index used for Confirmation:
The Baltic Dry Index has collapsed from 5829 to 1764.
The Baltic Dry Index is reported daily by the Baltic Exchange
in London. The index provides a benchmark for the price of
moving the major raw materials by sea. The index is a composite
of three sub-indices that measure different sizes of dry bulk carriers:
Capesize, which typically transport iron ore or coal cargo.
Panamax, which usually carry coal or grain cargo.
Supramax, with a carrying capacity.
The Baltic Dry Index takes into account 23 different shipping routes
carrying coal, iron ore, grains, and many other commodities.
___________________________________________________________
The Dow Jones Transportation Average is a price-weighted average
of 20 transportation stocks.
As a Leading Indicator, the Dow Jones Transportation Average is a
Primary Indicator for the direction of the Dow Jones Industrial Average.
DJT Components:
Alaska Air Group, Inc. (ALK)
American Airlines Group Inc. (AAL)
Avis Budget Group, Inc. (CAR)
C.H. Robinson Worldwide, Inc. (CHRW)
CSX Corp. (CSX)
Delta Air Lines, Inc. (DAL)
Expeditors International of Washington, Inc. (EXPD)
FedEx Corp. (FDX)
J.B. Hunt Transport Services, Inc. (JBHT)
JetBlue Airways Corp. (JBLU)
Kansas City Southern (KSU)
Kirby Corp. (KEX)
Landstar System, Inc. (LSTR)
Matson, Inc. (MATX)
Norfolk Southern Corp. (NSC)
Ryder System, Inc. (R)
Southwest Airlines Co. (LUV)
Union Pacific Corporation (UNP)
United Airlines Holdings, Inc. (UAL)
United Parcel Service (UPS)

$APG: Safety First!Industrial stock APG is showing a potential weekly breakout as infrastructure looms. The bill's passage hangs in the balance however this company can still be good for the patient investor with an ESG mindset. Good luck trader!

Semicondoctuctors are the "Transports of the 21st century"Bespoke Research firm says "Prior to the digital revolution that began in the 1990s, the Dow Transports were viewed as a “leading” indicator for the broader stock market. In the digital age, there’s hardly an industry group that doesn’t rely on semiconductors in one way or another. A modern car can easily have more than 3,000 chips. We view the semiconductor group as the “Transports of the 21st century,” making the price action for semis important to monitor."
I agree and will be monitoring the SMH/SPY

Transports Diverge From MarketLittle late to the party on this one. Starting in May 2021 the transports started to diverge from broad market indices. Over the last two weeks that divergence has reversed a bit, but worth keeping an eye on this.

TRANS - Struggling in Trade Wars / Currency Wars100+ Container Ships off Long Beach.
A clear build there, who owns that port?
China.

$KNX: Another leg higher for this trucker post infrastructure?KNX is setting up here with a really nice long term base, cracked the 50 level last week. Was that the level it needed to make another move higher? Time will tell. Following IYT as well and the possibility of it bottoming, if it does, we should see significantly higher prices here

$GOGO: 33% Short Interest Heading Into Holiday Season$GOGO getting a pop today one day after the White House announced mask mandates through the holiday season, should we buy the news or will this be a holiday humbug?

RUSSELL 2K AND DOW TRANSPORTS TOPPED?The combination of RUT and DTX has created a rising wedge. Price has broken down out of the wedge. These two indices are known to lead the broader market, so their topping in early June is interesting. Price topped in coordination with an RSI divergence before breaking down from the lower trendline of the wedge. This seems to have a good chance of going lower.
NOT INVESTMENT OR TRADING ADVICE

𝗧𝗿𝗮𝗻𝘀𝗽𝗼𝗿𝘁𝘀 𝗨𝗽𝗱𝗮𝘁𝗲: $DJT Daily. 🐂-ish DivergenceBullish divergence at bottom of channel. Possible run to start on false #DeltaVariant fears?
$TRAN $IYT $JETS $AAL $UAL $DAL $LUV $FDX $EXPE $BA $SPY $ES_F $VIX $DIA $DJI #Stocks #Transports 🛫

Is TLT saying we are about to have a Vix explosion? I have been following many charts and patterns for quite some time. and The set up for an entire market melt down is almost too perfect right now. and I will go through the list of events that have taken place:
First lets start with Gold. Gold had rallied on the back of lower yields for the better part of 2 months all to just get shot down during the FOMC meeting just a few weeks ago when the dollar shot up. (gold tends to lead the market sells offs by about 2-3 weeks) Mind you all of this has happened as yields have gone lower and lower. (totally not what you would expect from an "inflationary environment") gold respects real rates however if deflation was about to start happening, then this is the exact precursor you would expect. This is why I believe that if I am wrong about the vix explosion gold is going to be the best buy of the quarter.
Then lets move to the DJT (dow jones transports) I explained this in my prior IYT analysis which can be found here:
The transports just like gold and precious metals are generally the first assets to take a hit give or take about 2-3 weeks before general market correction.
and that leads me to my last point. TLT, oh tlt you dirty whore you. (I am currently long tlt fyi) The set up in the line chart of tlt is identical to the pre-covid crash as you can see in this chart.
But wait there's more.. Why has DXY been rallying along with TLT that does not happen very often. Some times it happens here and there But it does not happen for stretch of 2 weeks. All I am saying is stay hedged people. this is a very very risky set up.


High Consolidation Pattern in XPO LogisticsXPO Logistics has calmly sat above its old highs for the last four months, and now the chart may be poised for a run.
First, notice the series of higher lows since January 29. Also notice how quickly it’s rebounded from drops – similar to CSX .
Second, XPO’s 21-day exponential moving average (EMA) has risen above its 50-day simple moving average (SMA). This is a potential sign of intermediate-term momentum turning more bullish.
Third, the 100-day SMA has snuck up from below to provide support. In this way, it also resembles CSX.
Finally, a look further back to 2018 shows a double-top around $115.50, followed by a drop of more than 50 percent. XPO has consolidated above that level for the last four months, a potential sign of old resistance becoming new support.
Sector trends could also favor XPO because it provides shipping services. That places it in the Transportation industry, which has broadly outperformed the S&P 500 this year as investors look for the economy to rebound from the coronavirus pandemic.
TradeStation is a pioneer in the trading industry, providing access to stocks, options, futures and cryptocurrencies. See our Overview for more.

TCI transports longGood luck for your trades.
This post does not provide financial advice. It is for educational purposes only! You can use the information from the post to make your own trading plan for the market.
But you must do your own research and use it as the priority. Trading is risky, and it is not suitable for everyone. Only you can be responsible for your trading.

Is CSX Ready to Start Rolling?Railroad operator CSX has squeezed into a tight range for almost five months. Now it may be ready for a breakout.
The first pattern jumping off the chart is the ascending triangle with resistance around $95. Prices just started to escape the top yesterday.
Also notice how the lows on January 27, March 4 and March 19 were followed by “kicker” candlestick patterns. Those snapbacks show buyers didn’t let the stock remain down for long.
Next, Bollinger Band Width has tightened during this time, creating the potential for expansion if CSX starts running.
Third, prices have recently consolidated above the 8-day exponential moving average (EMA), the 21-day EMA and the 50-day simple moving average (SMA).
Finally, MACD has just turned positive.
In addition to those technicals, CSX is a transportation stock: the type of cyclical company that can benefit as economy recovers from the pandemic.
TradeStation is a pioneer in the trading industry, providing access to stocks, options, futures and cryptocurrencies. See our Overview for more.


DJ Transport (Dow Theory) says GGGood Game... the DJ Transportation Index has broken down the up trend line. Sell signal on the ATIS system should be out soon. And MACD is crossing down into the bear territory. The BMT had already given way in early October.
According to the Dow Theory, the DJ Transports is a leading indicator and well, expect the rest of the market indices to follow.
