TRB

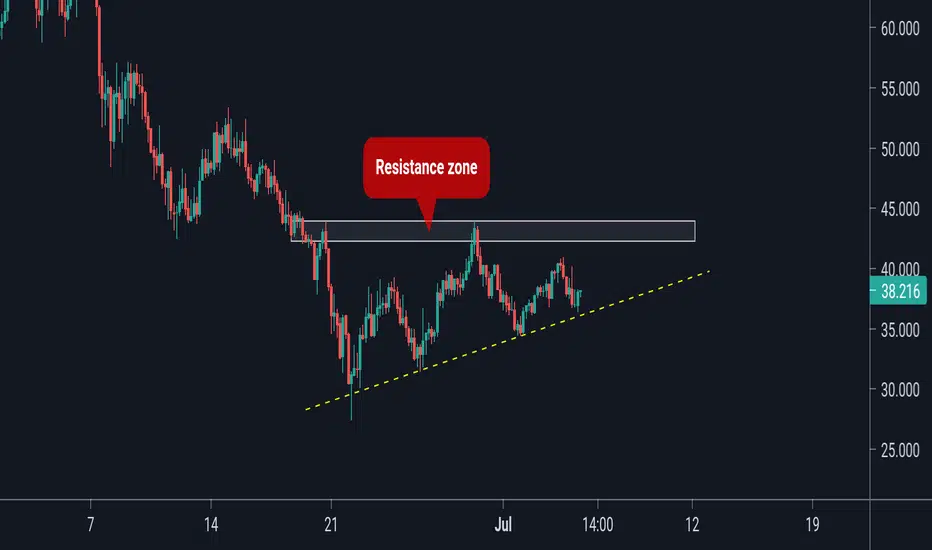
TRB Ascending TriangleTRB / USDT
Ascending Triangle
I will be bullish after break and hold above the upper resistance
Best of luck
TRBBTCGot a bounce from the daily MA200, formed into a symmetrical triangle, has remained above daily MA360
Not financial advice, do your research

🆓Tellor (TRB) May-28 #TRB $TRBTRB has just been rejected from 75$ zone and is heading to 55$ zone then may generate new rally up to 90$ or even 130$ zone in June. But if it loses 55$ zone, it will fall down to retest 40$ zone again or fall deeper to 20$ zone. So we need to pay attention to 55$ zone
📈BUY
-Buy: 53-57$ if A. SL if B
-Buy: 73-77$ if A. SL if B
📉SELL
-Sell: 73-77$. SL if A
-Sell: 88-92$. SL if A
-Sell: 127-133$. SL if A
♻️BACK-UP
-Sell: 53-55$ if B. SL if A
-Buy: 39-41$. SL if B
-Buy: 19-21$. SL if B
❓Details
🕯Timeframe : 1 Day
📈Red Arrow : Main Direction as BUY and SELL section
📉Blue Arrow : Back-Up Direction as BACK-UP section
🟩Green zone : Support zone as BUY section
🟥Red zone : Resistance zone as SELL section
🅰️A : The Close price of candlestick is Above the zone
🅱️B : The Close price of candlestick is Below the zone


TRBUSDT say hello to us ^-^If it does not lose its level of resistance, it can record the new price ceiling for itself.

TRB has great potential. :)Hello, I am publishing today my first idea on the pair TRBUSDT , time frame 2h. As always I will be mentioning a few scenarios and for each I am giving the reasons why I think that way.
FIRST SCENARIO- The market has been hurt these days by BTC. But TRB seems to recover so fast in the area between 87-96.5$. Even though we can clearly see a downtrend in this time frame, looking at the RSI, it shows a small sign of a bullish trend. However a lot of volume is needed, because if not, The RSI may show a bearish divergence. However I expect at first a small drop between 76-86 area, in which is a very buying opportunity. I think there will be at least another drop in price. In that area is a great moment to buy. If you want to have a SL, I would recommend it to be under 74$. But TRB recovers very fast, and to me it has great potential with this movement it is doing.
SECOND SCENARIO- If the daily candle closes as a hammer, probably in a few hours we could see movement in the area between 87-94$. We could be witnessing a trend reversal and the price may hit the TP of 125-127$. However it is critical to see how the daily candle stick will close and if there will be another drop of BTC and all the coins. Trade with caution and be careful while trading. TRB is very good, and recently it has recovered quite better. Be patient. If you do not feel like trading in this volatile market, step aside. Hope you liked my idea and you are free to comment for everything. :)


Retesting Support Level successfully The coin Retesting Support Level successfully with high volume breaking , i think it will go forward 161 % Expansion to 258 and i am thinking maybe 360$

TRBBTC. Newly listed on Coinbase.Is buying crypto for less popular coins a pain? Yes, it is. Figure it out techno-geniuses.
Is buying crypto on Coinbase's tradeable list difficult? No, it is not.
By logical extension: I bought TRB. That does not stand for terriblecoin. I would invest heavily in terriblecoin.
--------
This is my first attempt using a gann square. I am not a carpenter. Redirect that energy please. Perhaps into a mechanically powered generator. At a relatively distant location from myself preferably. Much appreciated.

TRB going to hit $185 with 80% probabilityThis one is going to be making new all time highs and is swt to hit $185 with a 78% probability.


Parabolic Curve Theory idea for $TRBBTC Rounded BottomThis is a personal research and idea for investment. DYOR and TIT...
This is a 3-day chart for Tellor $TRB coin.
Bare in mind this is a huge Rounded Bottom pattern that probably will develop exponentially growing price action as it starts to close. I'm calling it early as consistent with Parabolic Curve Theory (PCT) and am very conscious that events like news catalysts and BTC volatility can deviate it off its course and make price action miss some of the PCT base targets making it necessary to revisit this idea.
TIME/PRICE PROJECTION
Pattern start: Aug 31st 2020
Estimated end: 2nd half of June to 1st week of July (66 days from publishing)
Price tag at time of publishing: 236,000 satoshi
Expected price tag at end of pattern: 615K satoshi
Base 1 price level: 184,400 satoshi
Base 2 price level: 266,700 satoshi
Base 3 price level: 333,100 satoshi
Base 4 price level: 399,600 satoshi
Safe take profit range: Recommended trailing take profit at 587,300 satoshi
TECH INDICATORS
Kumo cloud is bullish with senkou span A over B and following below price action. Tenkan over Kijun sen upsloped confirm bullish momentum. Chikou lagging span is upsloped, far away and high which is also a bullish confirmation.
Parabolic SAR beneath price action bullish sign too.
Bearish divergence present on last candle.
NEWS CATALYSTS AND BTC VOLATILITY
At the time of publishing this idea we can see a huge bullish candle (may 4th) which made price action blast through base 1 target, not allowing any ranging, at least for the moment. This is consistent with the listing of the coin on Coinbase Pro, sparking great buying activity.
If we look at BTC price action on the pink line we can clearly see that $TRB hasn't been affected by bitcoins dips, at least not on this time frame.
EXPECTATIONS
I expect at least 2 months of sporadic large and increasing impulse moves to reach every subsequent base.
Ranging is expected below every base, towards the curve but they should decrease as price action moves up.
FINAL NOTE
Drawing may need to be adjusted as it's very complicated to project time on a pattern this size.

TRB BULLISH CUP AND TREND BREAKOUTwe need break trend to upper way , but we're in 7th green i hope cup will break the trend just hodl it

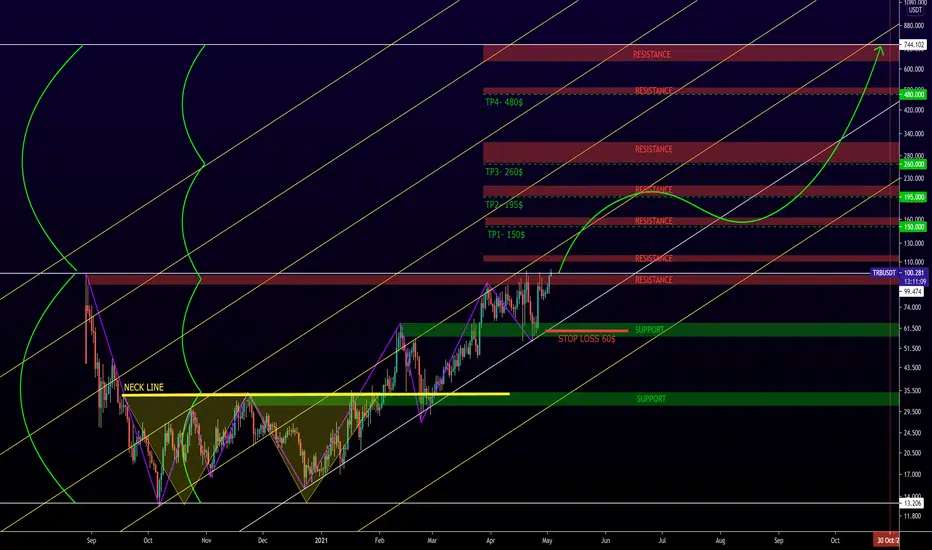
#TELLOR #TRB possible targets for 2021#TELLOR #TRB possible targets for 2021
TARGET1: 150$
TARGET2: 195$
TARGET3: 260$
TARGET4: 480$
STOP LOSS: UNDER 60$
The main move can start with the breakout and stabilization above the $ 100 resistance.

Trb Cup and Handle With double topTrbusdt is forming bullish cup and handle on daily chart as well as bearish double top. If it breaks the double top then we can see a large Buying there so a long position can be nice for profits
Thanks and have a nice trading day

TRB not good level for BUYwe see TRB test the resistance in 96$ can back to 56$ or brek the top we will take buy position
