📊 TRB re-testing resistance ! What's next?Hello, dear TradingView members.
This idea is a TRB analysis.
TRB pumped more than 16% today, and it's the second time this week that it has tried to break that resistance level.
The price is moving above the upper Bollinger Band, which causes weakness, and sends overbought signals.
However, RSI tells us the market still has room to go higher, which makes two scenarios possible for the near future.
Scenario one:
A breakout:
The price will either pump now or move to resistance levels after getting more support and buy volumes.
Scenario two:
A fake-out:
The price will fall after being around the resistance zone for a while.
The Bollinger Bands are broad, and I used them to show the resistance and support levels. Not entirely accurate, but still practical.
The Speedometer indicator shows Buy volumes on the market for TRB on a 1D interval.
Now have in mind: ANY news about this coin can cause a big pump or dump at this moment!
Let me know if you guys have any questions;
I will be more than happy to help.
Good luck, and thank you.
TRB

Tellor TRB price movement predictionPrice Prediction
not financial advice
this is for entertainment purposes only
always DYOR
smash the like button

TRB good situationTRB currently moving above previous resistance line.
Therefore 27.56 can be a new support line.
The long position could be profitable at the target of 31.46

TRB (Tellor) Token Analysis 28/03/2022Fundamental Analysis:
Tellor is a decentralized oracle network.
Oracles are a key part of blockchain infrastructure that update valuable off-chain data, making it available for on-chain smart contracts.
Tellor’s oracle supplies data that can be requested, validated and put on-chain transparently with data reporters competing for incentives of TRB. Data reporters bring valuable information on-chain for a wide range of DeFi applications.
To learn more about oracles check out the article Oracles 101:
coinmarketcap.com
Tellor’s oracle is a decentralized network of staked data reporters. Becoming a reporter requires no verification process i.e. permission less. Anyone anywhere in the world can be a reporter using open source software, a unique characteristic among blockchain oracles.
With some knowledge of blockchain and smart contracts, interested data reporters holding more than 100 TRB can start earning rewards for providing accurate data.
When oracle users request the value of an off-chain data point (e.g. BTC/USD), data reporters compete to add this value to an on-chain data-bank, accessible by all Ethereum smart contracts. The frequency with which data can be updated is limited only by how much / how often users “tip” the feed with TRB.
Also unique to Tellor, data is submitted in bytes meaning the oracle is flexible and robust for nearly any blockchain application.
The purpose of Tellor’s native token, Tributes (TRB), is to connect and align data reporters, oracle users, and community governance.
Security is achieved through Tellor’s governance contract, which uses a simple dispute mechanism to achieve community consensus on the data being reported. The way this works is that data reporters must stake TRB in order to report data and earn rewards, but they can be disputed and slashed, with their stake given to the disputer if they submit data the network deems incorrect.
Tellor was launched in 2019 by a U.S.-based team with the aim to address the oracle problem on the Ethereum blockchain.
Tellor was founded by Brenda Loya, Nick Fett and Michael Zemrose.
Brenda Loya is the CEO and co-founder of Tellor. Previously, Brenda worked as the VP and Lead Developer at Daxia in the field of blockchain, scalability and data science. Previously she was an economist and supervisory statistician at the U.S. Department of Labor.
Nick Fett is a co-founder and CTO of Tellor. Previous to Tellor, he was the founder of Daxia, a derivatives protocol on Ethereum. Nick also has experience in economics, regulation, derivatives, and machine learning including positions at the U.S. Commodities Futures Trading Commission.
Michael Zemrose is co-founder and CSO of Tellor and previously did Business development at Daxia. He was also an entrepreneur in media and consulting for several years before joining the world of crypto.
Tellor (TRB) has the Total supply of 2,385,988 tokens as of 28/03/2022.
The current CoinMarketCap ranking is #535, with a live market cap of $55,483,608 USD. It has a circulating supply of 2,313,777 TRB coins and the max. supply is not available.
Technical Analysis:
The Price Value Has Fallen to its 90% low, From its All Time High and has already Accumulated its Intrinsic Value and the Smart Money Flow is on its way. Currently the Price is at the 85% low of the ATH and it can be considered a good Opportunity for Investment.
There exist the Bullish Divergence of Price Value and MACD which is the very sign of Bearish Trend reversal and Start of the New Cycle and Bullish Impulsive waves.
We have defined 3 Targets by the Confluences of the Fibonacci Expansion and Fibonacci Trend Base Extension Levels, and these levels can be considered as the very important Pivot point on the Price Rally.
The 3 TP will get its Confirmation as the Price Triggers the 2 TP followed by some Price Correction and Retracement which is the distribution Phase.

TRB / USD (Tellor) Token Analysis 24/10/2021Fundamentals Analysis:
Tellor was launched in 2019 by a U.S.-based team with the aim to address the oracle problem on the Ethereum (ETH) blockchain. Tellor is an Ethereum-based, decentralized, secure oracle for decentralized finance (DeFi) decentralized applications (DApps).
To learn more about this project, check out our deep dive of Tellor.
Tellor allows DeFi DApps to receive high-value data for smart contracts. The data feed’s stability and reliability are ensured by staked miners who participate in proof-of-work (PoW) consensus.
The team behind Tellor also built Daxia, which is a derivatives protocol on Ethereum. Daxia created tokens that represented long or short sides of a trading pair, and an oracle was needed in order to execute these smart contracts. As a result, the team created Tellor, which is a decentralized, purpose-built oracle solution.
Tellor takes advantage of the proof-of-work consensus algorithm in order to provide a high level of security to the network through decentralization. Alongside the PoW solution, miners need to provide an off-chain data point. Participants of the network also have to deposit a minimum sum of 1000 tokens as a stake, which acts as a guarantee of the correctness of data inputs.
The TRB utility token is an Ethereum-based token that powers the Tellor system. Tellor works by allowing users to send queries to the oracle network, where TRB tokens are used as an incentive for miners to choose a particular query.
Later on, other users that want the same data can pay for it more to further incentivize miners. Approximately every 10 minutes the oracle selects the best-funded query and provides a challenge for the miners who have opted towards solving it.
Miners can then submit their PoW solution and off-chain data point within the oracle contract. The oracle then validates the input and saves it on the chain. Once this happens, the miners are finally rewarded for their mining efforts. Anyone that has TRB tokens can dispute the validity of a mined value, however, this needs to be done in a 24-hour interval by paying a dispute fee.
Tellor was co-founded by Brenda Loya and Michael Zemrose.
Brenda Loya is the CEO and co-founder of Tellor and in the past worked as the VP and lead developer at Daxia in the field of blockchain, scalability and data science. She was also the supervisory statistician in employment and training administration at the U.S. Department of Labor.
Michael Zemrose is a co-founder of Tellor and used to work as the chief strategy officer at Daxia. He was also a coach for small business owners at Real Elevation.
The current CoinMarketCap ranking is #404, with a live market cap of $109,136,660 USD. It has a circulating supply of 2,005,905 TRB coins and the max. supply is not available.
Technical Analysis:
The Token had a Bullish run and made ATH then retraced to 78.6% level of Fibonacci Retracement Level, where it is currently Reaccumulating and we are expecting a bullish wave and a new Higher cycle soon.
we have defined three new Targets with Fibonacci Projection of the Past Bullish Run and highest pick and lowest retracement dumps.
the 3 TP gets confirmed as soon as the price Touches the 161.8% of the same Fibonacci projection followed by some retracement and price correction.

TRB can Start To Increase Soon🔵🟡Chart is speaking it self!
TRB / USDT
-TRB is in a Double Bottom Pattern
-The break out has not Happened yet!
-If the Bullish Break out happens, we Must Expect a Bullish Movement as much as the Measured Price Movement.
_ _ _ _ _ _ _ _ _ _ _ _ _ _ _ _ _ _ _ _ _ _ _ _ _ _ _ _ _ _ _ _ _
Thank you for seeing idea .
Have a nice day and Good luck

TRB/ USDT (new rise soon ?)TRB / USDT
Back to late 2020 this zone was strong support area
TRB is trying to breakout from accumulation zone
We have a high chance to do so with btc trying to make new rally
Keep an eye on it
Note : before you open any trade please make sure you do your own research and respect the risk managements


TRB TO COMPLETE WAVE C WE NEED Z to be COMPLETED first so I THINK there is more bearish under $14 IS good to buy.

$TRB/USDT 12h (#BinanceFutures) Falling wedge breakout & retestTellor Tributes seems to have found local bottom and looks ready for recovery towards 100EMA!
tellor.io
Current Price= 31.58
Buy Entry= 30.78 - 28.46
Take Profit= 36.35 | 44.16 | 54.96
Stop Loss= 24.55
Risk/Reward= 1:1.33 | 1:2.87 | 1:5
Expected Profit= +22.72% | +49.09% | +88.55%
Possible Loss= -17.12%
Fib. Retracement= 0.382 | 0.618 | 0.883
Margin Leverage= 1x
Estimated Gain-time= 2 months
Contract:
#ERC20 0x88dF592F8eb5D7Bd38bFeF7dEb0fBc02cf3778a0

TRBUSDT - SETUPTRBUSDT price has just reached a critical support zone and We are expecting the bulls will react at this zone and try to claim the momentum toward the trendline, if they succeed to break this wedge then the 35.00 level will be the next target. Good Luck!

TRB/USDT TRADE SETUP!!Hello everyone, if you like the idea, do not forget to support with a like and follow.
Welcome to this TRB/USDT trade setup. TRB looks promising here. Bouncing off from the support zone. Buy now and add more in dips.
Entry range:- $26-$29
Target1:- $40
Target2:- $50
Target3:- $64
Target4:- $82
Target5:- $124
SL:- $22
If you like this idea then do support it with like and follow.
Also, share your views in the comment section.
Thank You!

TRB/USDT 1h #TRB/USDT 1h (Short Call) Chart with downwards trend
Tellor/#USDT on 1h chart there is a Bearish pattern (Rising Wedge)
Targets on the chart. If this channel got broke, Targets will come true. Stop-Loss at $37
Follow for more!
Twitter : @GodsGraphics

Tellor (TRB) formed bullish Cypher for upto 161% big moveHi dear friends, hope you are well and welcome to the new trade setup of Tellor ( TRB ) token.
Previously we had a nice trade of TRB:
Now on weekly time frame TRB formed bullish Cypher pattern.

TRBBTCTRB appears in the accumulation range. In the range of 0.000650 to 0.000750 seems to be suitable for buy. Its targets are available in the specified areas

TRB/USDT LongTRB/USDT Long
Curently trading at 55$
Dip towards 55$-51$ will be buying opportunity
Can start acculumulation at dips of the given area
Stay Long above 47.8$
Targets are define on chart, most probably 80$-85$
#TRB#Long#ALISAQIB

TRB/USDT swing trade opportunity A very good opportunity but wait after the day close to make sure it doesn’t go down below the blue line and have a sell order at the first green line. If you want longer term the rest of the goals are in front of you

TRB/USDT LONGIf Bitcoin is supported in the support range of 57 and 58, trb can be supported in the first support area .
And if Bitcoin fails to maintain 57 support. In the second support area, you can buy your second order.
pls like and share

ALMOST READY TO PUMPTRBUSDT IS ALMOST READY TO PUMP
As I draw a support and resistance zone, It could be break and touch the tp1 and tp2

TRB - In the breakout rangeTRBUSDT :
The price is moving in one channel.
As can be seen in the chart, prices have repeatedly encountered and reacted to this trend.
That all leads to a price drop.
If this trend is broken, we expect a good move.
If the price breaks the trend line of the first target, we will probably have a good price jump.
But :
The buy signal has not been seen, yet.
The trend line has not been broken, yet.
Bitcoin movements at this time may affect its movement.
Then :
You can monitor this coin and put it in your watchlist.

TRB USDT 3D - Binance FuturesTellor Tributes seems like it's forming a Adam & Eve pattern on macro view.
Entering in demand zone (blue range), taking profits on Fib extension levels.
Risk/Reward= 1 : 2.72 | 1 : 5.33 | 1 : 9.37

TRB & SXP IDENTICAL CHARTS! BOTH READY FOR W-SHAPED RECOVERY?With Bitcoin's pump all the ALT coins are gaining momentum!
2 coins that look very identical on weekly are TRB and SXP!
Looks like both will do a W-Shape recover.
If you liked the idea please give it a like :-)

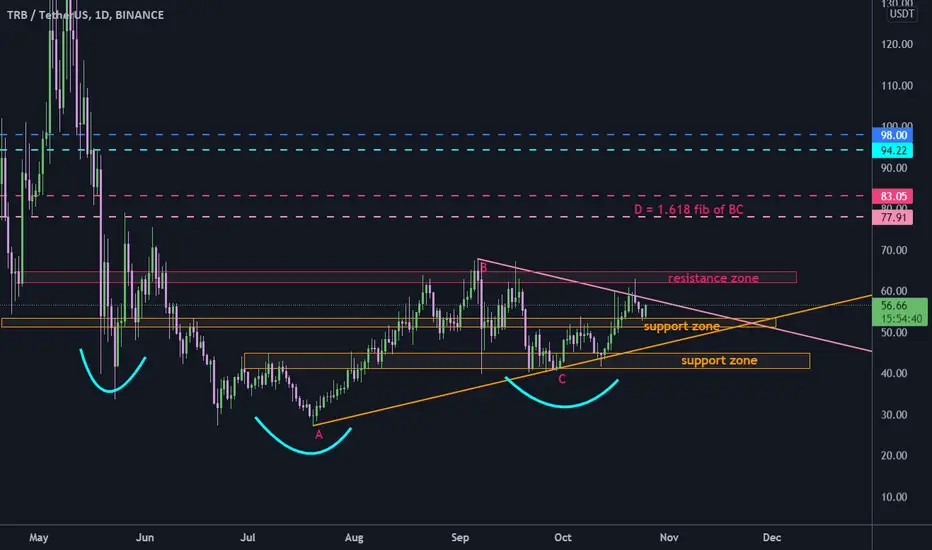
TRB inverted head and shoulders#TRBUSDT
$TRB is trading below a descending resistance line. price rejected from this line but hold above support zone.
break out from this resistance will lead price toward resistance zone around $62.
if price going up to complete AB=CD pattern, its target is around $80.
also there is an inverted head and shoulders pattern that its target is around $95.