Tellor TRB: slow mover, when MOON?To be honest, I hate this token. It moves sooooo little as if we were in a bear market.
The most strange part is, TRB is an ORACLE!!! Its counterpart, Chainlink, has done a 400x increase in one year!
But I still have some TRB in my moon bag, bc the chart is bullish.
TRB has formed a double- or triple-bottom, like many other coins that listed in fall 2020. It was under accumulating between 13-39 usdt for several months. A cup-and-handle formation after it revisits 67. We have higher lows in the recent BTC dump. Its BTC pair has a long-term bullish divergence.
Oracle is one of the essential infrastructure of the DeFi and DAO world.
And TRB has a small market cap of just 60 mil. In the same category, we have LINK of 12 bil, and BAND with 300 mil. TRB has potential to do another 10x or more as the ALTs season continues. Not a financial advice, but I will support my prediction with my own money.
Thank you!
TRBUSD

TRBUSDT 4H Long setup; W-formation setupTA explained
TRB consolidating just above broken resistance and "around" the neckline of the W-formation.
Trade setup
Best entries: 35.681 - 38.350
TP1: 42.373
TP2: 48.003
TP3: 54.764
SL: 32.371
RR: 3.86
Max leverage: 1x
—————
Do Your Own Research (of course)
Trade at own risk (of course)
Only trade what you can afford to lose (of course)

🆓Tellor/USDT Analysis (3/3) #TRB $TRBThe buying force is coming and 35$ is really a good zone to buy TRB. It will head up to 48$ zone, this zone is very strong and I think a selling force exists there so we should pay attention to that zone.
If TRB can surpass that 48$ zone, it will move up to 80$ zone at early April
📅NEWS
No News
📈BUY
-Buy: 34-36$. SL if B
📉SELL
-Sell: 47-49$. SL if A
-Sell: 76-80$. SL if A
♻️BACK-UP
-Sell: 34-36$ if B. SL if A
-Buy: 27-29$. SL if B
-Buy: 20-22$. SL if B
❓Details
Condition A : "If 1D candle closes ABOVE this zone"
Condition B : "If 1D candle closes BELOW this zone"

TRBUSDT (TELLOR) - UPTREND CONTINUATION ANALYSIS 🔎
- TRBUSDT brokeout above the double bottom neckline resistance as expected from my previous analysis.
- The market hit a swing high and retraced.
- Price is retesting the double bottom neckline resistance (flip horizontal support) and key fibonacci retracement levels (0.5 - 0.618 - 0.786).
- There's a relatively high concentration of buyers at this retest zone (High buying pressure).
- The retracement is resisted by the descending trendline resistance.
- Breakout above the descending trendline resistance could be an uptrend continuation signal.
BUY ENTRY ⬆️
- Conservative entry : breakout above the descending trendline resistance.
- Aggressive entry (risky) : market price (now).
TARGETS 🎯
- Horizontal resistance level (R1).
- Horizontal resistance level (R2).
- Fibonacci extension levels.
- ATH resistance.
SETUP INVALIDATION ❌
- Breakdown below the 0.786 fibonacci retracement level.

TRB/USDT : Retest on support, Ready for breakoutBINANCE:TRBUSDT
Hello everyone 😃
TRB was trying to break 60$'s resistance.
Now it had a retest on support line !
📌 Also MACD is being Bullish...
It could be a good zone to but TRB after breakout and holds above 60$.
Attention: this isn't financial advice we are just trying to help people on their own vision.
Have a good day!
@Helical_Trades

TRB 1H BUYAlso set some Buy orders near the Trendline
Remember no more than 5% of the deposit in one trade
SL: next sell signal

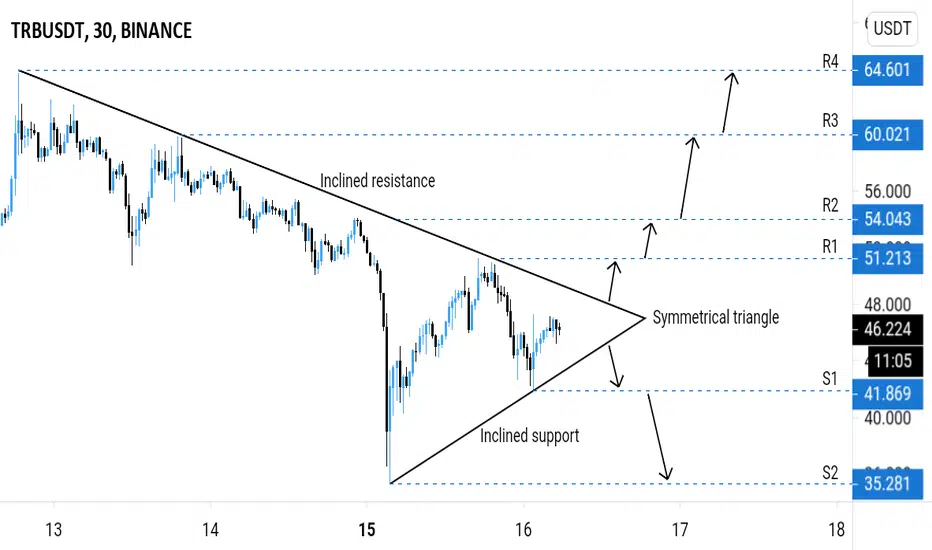
TRBUSDT (TRB) - POSSIBLE PRICE ACTIONS ANALYSIS 🔎
- TRBUSDT is consolidating in a symmetrical triangle pattern .
- A relatively big move is imminent.
POSSIBLE PRICE ACTIONS
- Uptrend ⬆️: breakout above the symmetrical triangle's inclined resistance.
- Downtrend ⬇️: breakdown below the symmetrical triangle's inclined support.
TARGETS 🎯
- Uptrend ⬆️: Horizontal resistance levels (R1, R2, R3, R4).
- Downtrend ⬇️: Horizontal support levels (S1, S2).
$TRB - gonna popThis chart looks very nice, looks to be ready to pop out this bottom range - a 5 month area of consolidation
The coin only released very late August 2020, with only a 1,7 million supply
It's another DeFi project that works in decentralised lending, where they work on providing solution for oracles and collarorations with ChainLink.
Technically a very nice chart, and fundamentally very sound too, fill the bags boys


TRBUSDT (TRB) - POTENTIAL BREAKOUT ANALYSIS 🔎
- TRBUSDT is consolidating in a symmetrical triangle pattern.
- Breakout is imminent.
BUY ENTRY ⬆️
- Breakout above the symmetrical triangle's inclined resistance.
TARGETS 🎯
- Horizontal resistance levels (R1, R2).
- Projected ascending channel resistance.
- Fibonacci extension levels.
SETUP INVALIDATION ❌
- Breakdown below the symmetrical triangle's inclined support.

TRB 1H BUYSet some Buy orders near the Trendline
Remember no more than 5% of the deposit in one trade
SL: next sell signal

TRBUSDT - DOUBLE BOTTOM ANALYSIS 🔎
- TRBUSDT is printing the double bottom trend reversal pattern on the daily timeframe.
- This is a bullish pattern.
BUY ENTRY ⬆️
- Breakout above the neckline resistance (R1).
TARGET 🎯
- Resistance 2 (R2)
SETUP INVALIDATION ❌
- Breakdown below the previous swing low.


TRBUSDT - Potential buy entry 🔼TRBUSDT is printing a falling wedge pattern.
Price brokeout above the wedge resistance.
Price action is printing a minor ascending triangle pattern.
Buy entry ⬆️ - breakout above the ascending triangle resistance.
Target 🎯 - resistance level.
Setup invalidation ❌ - breakdown below the ascending triangle inclined support.


TRBUSDT - Ascending channel TRBUSDT has been printing an ascending channel pattern since October.
Price is testing the ascending channel support.
We could see a bounce off the channel support ⬆️ or a breakdown below the channel support ⬇️.
Possible price actions are indicated on the chart.


TRB TELLOR 4H Trendline breakout - trbbtc trbusdt trbusd trbbnbTRB TELLOR 4H Trendline breakout - trbbtc trbusdt trbusd trbbnb

TRB/USDT - possible triple bottom forming?Hi all !
I like to keep it simple with the top quality alts. Fundamentally, we do not need to spend any words on the Oracle projects like Tellor. These projects are "less risky" if we consider them as a long term players that would achieve new ATH for sure.
After my LINK/USDT analysis which is going according to the plans, I think that if the market keep with the momentum that it had these last weeks, we might see an explosion in the TRB/USDT pair as well. Besides very healthy chart which we can see: healthy push after Binance listing and then healthy retracements to find the natural support are very good signs for sure.
If we keep today's daily lows, we might have triple bottom formed as marked on the chart. That's very bullish sign and if the price confirms that, we could target 145% + profits (Daily Resistance 2) in the coming weeks. However, if that plan does not come through, I would happily follow new signals and keep DCA-ing projects like TRB.
Thank you for your time !
I would also like to hear your thoughts on possible TRB movements in the near future. Your comments and support are much appreciated !
p.s. feel free to check my LINK/USDT idea and tell me your thoughts about it as well.
Happy trading!


TRB/USDT (4x Key Support Retest)💎Technical Analysis Summary💎
BINANCE: TRBUSDT
-TRB is back at its key level of support around 19 dollars
-This will be the 4th time it will be tested
-This is crucial for this coin because the support becomes weaker over time
-Please let this be a warning and plan your trade
-Always your proper stop location
-But if you are looking to short this market
-Wait for the support breakdown confirmation
A big Thanks for donating 💰 via Tradingview coins this week to SattarKHAN 🙏🎉
``````````````````````````````````````````````
Trading Involves High Risk ⚠️
Not Financial Advice 💸
Please Exercise Risk Management 💱
``````````````````````````````````````````````
Thank You All!🙏😊💖For Supporting My Channel 📺
Through Leaving A Thumbs Up, Comment & Follow 💬
Happy Trading!😊💕💖
``````````````````````````````````````````````

TRB/BTC (Retest Previous Swing Support)💎Technical Analysis Summary💎
BINANCE: TRBBTC
-TRB failed to break the key level of resistance
-The price fell back to near its previous swing low support
-The Bulls must defend this zone otherwise Bears will take the lead
-Wait for any Bullish reaction or reversals before buying at key support
-Reducing the risk by increasing the probabilities of winning is a must
A big Thanks for donating 💰 via Tradingview coins this week to SattarKHAN 🙏🎉
``````````````````````````````````````````````
Trading Involves High Risk ⚠️
Not Financial Advice 💸
Please Exercise Risk Management 💱
``````````````````````````````````````````````
Thank You All!🙏😊💖For Supporting My Channel 📺
Through Leaving A Thumbs Up, Comment & Follow 💬
Happy Trading!😊💕💖
``````````````````````````````````````````````
