Is TRBUSDT About to Explode or Fake Out Everyone Again?Yello Paradisers! After weeks of quiet price action, is TRBUSDT finally gearing up for a real breakout—or is this just another trap before the next leg down? Let’s break it all down, because the next move could catch many traders on the wrong side.
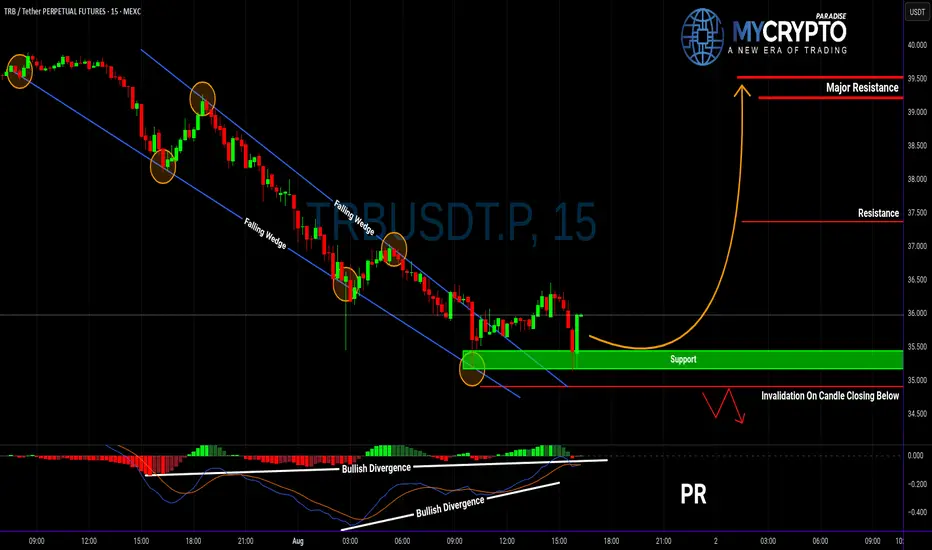
💎TRBUSDT has recently broken out of a falling wedge pattern, accompanied by a clear bullish divergence—an encouraging sign that momentum may be shifting in favor of buyers. This type of setup historically carries a higher probability of a bullish move, especially if the breakout holds above key support levels. However, the entry strategy here is critical.
💎Ideally, we want to see a minor pullback. If that happens, it could offer a solid bounce opportunity from well-defined support zones, giving a favorable risk-to-reward setup. This is the scenario where patient traders will find the highest probability entries. On the other hand, aggressive traders might consider entering from current levels, but they must understand that doing so offers a less favorable risk-to-reward ratio. Jumping in too early without a clear confirmation could expose you to unnecessary risk, especially if the market reverses quickly.
💎More importantly, we have a clearly defined invalidation level. If TRBUSDT breaks below that level and closes a candle beneath it, this would invalidate the current bullish setup completely. In such a case, the best course of action would be to step aside and wait for a new structure or more reliable price action to form. Forcing trades in uncertain territory is how capital is lost and confidence shaken.
Strive for consistency, not quick profits. Treat the market as a businessman, not as a gambler. Protecting your capital and waiting for high-probability opportunities is what separates professional traders from the rest. Patience here could be the difference between a calculated win and a costly mistake.
MyCryptoParadise
iFeel the success🌴
TRBUSDT
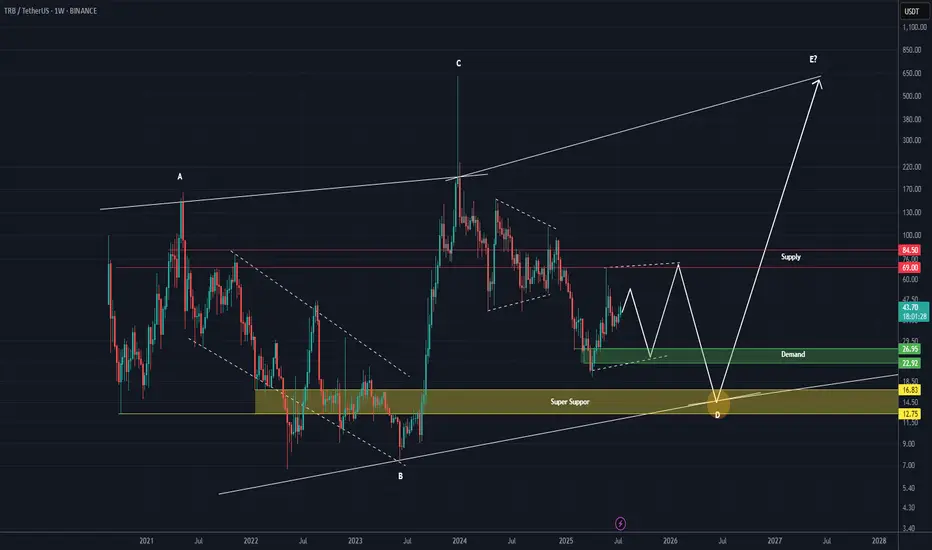
TRB Roadmap (1W)It appears to be within wave D of a larger pattern.
Given the strong rally in wave C, it is expected that this coin will enter a time-consuming correction, so considering a symmetrical pattern for wave D is not illogical.
A short-term upward swing is expected from the green zone.
However, the main buy zone is the yellow box, where wave D could end and wave E may begin.
These moves and this pattern belong to the weekly timeframe and will take time to play out. For a spot buy, it’s best to keep this asset on your watchlist.
For risk management, please don't forget stop loss and capital management
Comment if you have any questions
Thank You
TRB : FREE SIGNALHello friends🙌
📈Given the price reaching its bottom and the buyers supporting it, you can see that a classic head and shoulders pattern has formed and buyers have entered. For this reason, you can buy with capital and risk management and move with it to the specified targets.
🔥Follow us for more signals🔥
*Trade safely with us*

TRBUSDT: Massive Bullish Setup or a Fakeout Trap?Yello Paradisers — is TRBUSDT gearing up for a major breakout, or is this just another fakeout before a deeper drop? Our previous calls have been consistently accurate, and now this chart is flashing multiple signals that deserve your full attention.
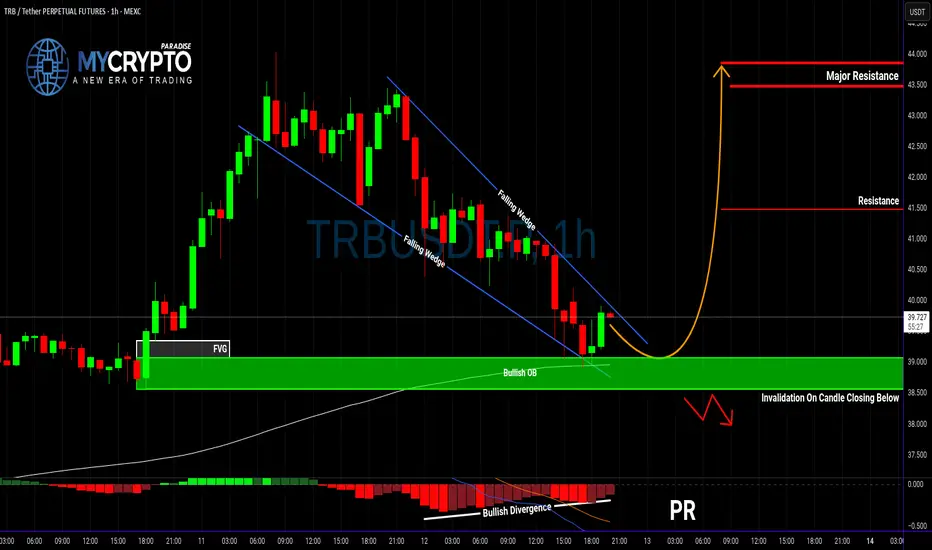
💎Currently, TRBUSDT has formed a textbook falling wedge pattern, a well-known bullish reversal signal. What's adding strength to this setup is a clear bullish divergence, suggesting that momentum may be shifting in favor of the bulls. Even more compelling, the price is now holding firmly inside a bullish Order Block (OB) zone, which is aligned with the 200 EMA — a powerful confluence that increases the probability of a bullish move significantly.
💎For aggressive traders, this could be a valid spot to enter immediately, capitalizing on the current structure and zone. However, for those looking for a more calculated entry with improved risk-to-reward, waiting for a pullback could provide a much better setup — with the potential to offer over 4.5 RR, making it a high-probability trade idea.
💎That said, it’s important to manage risk carefully. If TRBUSDT breaks down and closes candle below the bullish OB zone, this would invalidate the bullish setup entirely. In that case, the smart move would be to wait patiently for new price action to form before making any decisions. Reacting emotionally here could lead to unnecessary losses, so discipline is key.
🎖Strive for consistency, not quick profits. Treat the market as a businessman, not as a gambler. If you want to be consistently profitable, you need to be extremely patient and always wait only for the best, highest probability trading opportunities.
MyCryptoParadise
iFeel the success🌴
TRBUSDT - at CUT n REVERSE Area? What's next??#TRBUSDT - market just reached at his ultimate supporting region and below that we can expect a further straight drop.
So we will cut n reverse below our mentioned region that is around 35 (region neck line)
Good luck
trade wisely

Today's signalHello friends🙌
🔊After the good growth of this currency, you can see that the price has corrected at the top of the channel and now that we are near the bottom of the channel, there is a good opportunity to buy in stages and with capital and risk management and move with it to the specified goals.
🔥Join us for more signals🔥
*Trade safely with us*

TRBUSDT Setup – Staggered Exits, Smart Profits📌 Entry: 36.70
🎯 TP1: +10% → Secure 50% of position
🛡️ Move to risk-free after TP1 to protect capital
🎯 TP2: Take 50% of remaining volume
🎯 TP3: Close all remaining volume
Calculated exits. Risk-managed. Momentum-ready.

TRBUSDT Long with good RRTRBUSDT with bullish pivots, follows with divergence on smaller time frames, possible reversal with FakeBO, a good Risk Reward. First 85 daily target on fibonacci levels.

TRBUSDT on the Verge of a Major Move – Breakout or Breakdown?Yello, Paradisers! Is TRBUSDT gearing up for a bullish breakout, or is a deeper retracement coming? Let’s break it down.
💎TRBUSDT is forming an ending diagonal while showing bullish divergence, increasing the probability of an upward move. But for this bullish scenario to play out, we need confirmation.
💎If TRBUSDT breaks out and closes candle above the resistance level, the probability of a bullish move strengthens, setting up a potential wave 4.
💎However, if the price retraces further, we could still see a bounce, but given the broader market conditions, this would be a low-probability setup.
💎On the flip side, a breakdown and candle close below support would invalidate the bullish outlook, signaling that it’s safer to wait for a better price action structure before taking any positions.
🎖Remember, patience and disciplined execution are what separate winners from the rest. Stay sharp, Paradisers, and don’t let emotions dictate your trades!
MyCryptoParadise
iFeel the success🌴

TRBUSDT - Bottom out here? What's next??#TRBUSDT ... market just near to his bottom and looking bottom out here
Keep close and if market holds his current mentioned area than we can expect a bounce from here.
Good luck
Trade wisely

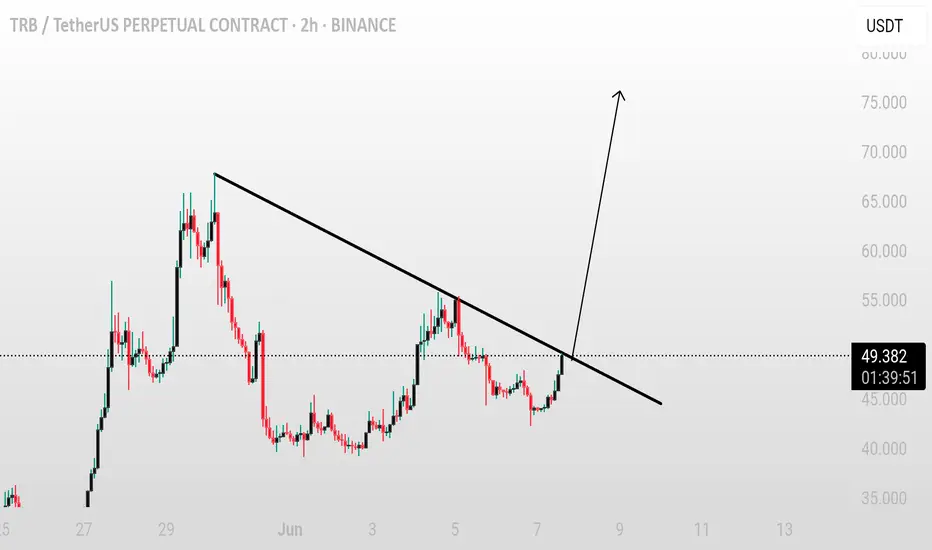
TRB/USDT – Attempting Trendline BreakoutTRB/USDT – Attempting Trendline Breakout
TRB is currently testing a key trendline resistance and attempting a breakout. If the price manages to break and hold above the trendline with strength, it could trigger a bullish move.
A confirmed breakout may lead to a 15–30% bounce in the short term.
Key levels to monitor:
– Trendline resistance
– Breakout confirmation with volume
– Immediate resistance zones above
Keep an eye on TRB — confirmation above the trendline could open the door for a strong upside move.
TRB/USDT Analysis: Potential Reversal Setup
After a prolonged correction, this asset has entered an accumulation phase. The internal structure of the range indicates buyer dominance. This is evidenced by strong absorption of market sells (as shown by cumulative delta) and volume distribution.
We're considering a long entry either on a test of the POC-$42 (Point of Control — area of highest volume concentration), or on a false breakout below the $39 low.
Upside potential: $50
This publication is not financial advice.

SMT divergence marked the top. The rest was just execution.Price doesn’t move randomly — it responds to design.
That SMT divergence at the high wasn’t a signal to short. It was a sign to prepare for the shift.
TRB printed a clean inefficiency on the 4H before distributing from the highs. The displacement candle that followed made the intent clear — Smart Money was offloading above the FVG, into passive buyers. Textbook trap.
Now we’re in the reaction phase.
We’ve tagged the 42 handle, and below it sits a 4H OB nested at 38.76. If price returns to that zone, I’m watching for signs of absorption and reaccumulation. That’s my re-entry area. Not before.
Above, the 47.24 OB is where liquidity starts pulling — it’s the first logical exit. If price reclaims that zone cleanly, the next draw becomes the 53.42 inefficiency. That FVG hasn’t been touched, and it won’t stay untouched for long.
Key levels to control the move:
🔑 Entry interest: 38.76 or lower
🧠 Watch 36.04 as final discount before reversal
🎯 Targets: 47.24 → 53.42 (unmitigated inefficiency)
❌ Invalidation: Full body break below 36 — Smart Money would be repositioning lower
This isn’t about prediction. It’s about knowing what the market must do.
You don’t need to believe in me. Just look at the chart.

TRBUSDT Forming classical Bullish BreakoutTRBUSDT has recently broken out of a long accumulation zone, forming a classic bullish breakout structure on the daily chart. The asset saw a significant surge from the key support zone between $28 to $32, which has now been confirmed as a strong demand area. The breakout was backed by a sharp spike in volume, indicating strong buyer conviction and institutional interest entering the market. This breakout marks a pivotal shift in momentum and suggests that the bulls are in full control.
The technical setup points to a potential rally of 100% to 130%, targeting levels around the $75 mark and beyond. The previous resistance zones have been decisively cleared, and the strong green candles hint at the possibility of a sustained uptrend. If the asset holds above the breakout level and continues to consolidate at higher levels, it could build a strong base for the next impulsive move. This kind of vertical price action is often seen in assets with growing investor demand and limited supply pressure.
Investor interest in TRB is noticeably rising, as reflected in the increased social media chatter, positive sentiment across crypto forums, and higher engagement on trading platforms. The coin is benefiting from renewed market confidence and strong fundamentals. With macro tailwinds in the crypto market and a technically sound chart, TRB appears poised to outperform in the coming weeks.
Traders should closely monitor the price action around $50–$52 for potential retest opportunities. A successful retest followed by bullish continuation could offer a high-risk/reward long setup. The projected upside remains highly favorable, supported by robust volume and clean technical structure.
✅ Show your support by hitting the like button and
✅ Leaving a comment below! (What is You opinion about this Coin)
Your feedback and engagement keep me inspired to share more insightful market analysis with you!

TRBUSDT 2D AnalysisTRB ~ 2D Analysis
#TRB Buy after successfully breaking this resistance line with a short-term target of at least 15%+ and a long-term target of $300++

Tellor Tributes TRB price analysis⁉️ We don't know what caused yesterday's rise in the price of #TRB, but it is a very, very manipulative asset, just remember the “short squeeze” liquidation on New Year's night 2024.
Now the price of OKX:TRBUSDT has come to the zone where longs had been taking for more than six months, with the hope that the growth trend is about to resume.... but no...
🔽 You shouldn't short it, because it's a very manipulative asset - see p.1
🔼 But whether to take longs with the hope of increasing the deposit or sitting in a drawdown is a matter of individual choice.
We depicted our thoughts at the chart.
_____________________
Did you like our analysis? Leave a comment, like, and follow to get more

Tellor Double iH&S —Marketwide Higher High NextYou can never miss a bullish market. Whenever the market stops, goes sideways, some pairs just can't take it and continue growing. They grow bullish and continue bullish and move straight up. Aren't we supposed to crash? Isn't the market going lower?
Hold on, the question: Will Bitcoin continue and hit $120,000 or is it $100,000 next?
When Bitcoin crashes, everything crashes.
Just a few days ago, it was AAVE that was moving straight up. See how Tellor is moving today, some pairs are sideways and there isn't strong bullish momentum marketwide but still, some pairs are moving ahead. This moving ahead is what reveals what comes next marketwide; bullish continuation of course.
Super high volume on this TRBUSDT chart just two days ago.
Notice the double inverted head and shoulders pattern.
Notice the change from a bearish to a bullish trend.
Notice the full green candle...
Cryptocurrency will continue growing; it is already growing and will continue to do so long-term.
Namaste.

TRB SELLHello friends
Due to the sharp drop in price, we can open a trade in the direction of the trend, of course with capital and risk management.
*Trade safely with us*

#TRB/USDT#TRB
The price is moving within a descending channel on the 1-hour frame, adhering well to it, and is heading for a strong breakout and retest.
We are seeing a bounce from the lower boundary of the descending channel, which is support at 30.84.
We have a downtrend on the RSI indicator that is about to be broken and retested, supporting the upward trend.
We are looking for stability above the 100 Moving Average.
Entry price: 28.20
First target: 29.00
Second target: 29.87
Third target: 30.84

TRBUSDT 1WTRB ~ 1W Analysis
#TRB Buy back from here with a short -term target of at least 20%+ from here.

TRB/USDT(UPDATE)Hello friends
Given the price drop, you can see that buyers supported the price on good support and were able to build a higher ceiling.
Now we have identified important and practical support areas for you to buy in steps and with capital management.
Price targets have also been identified...
*Trade safely with us*

TRB...Hello friends
According to the formation of a trading range, if the price manages to break through the price, the specified ranges can be a good support.
*Trade safely with us*

Tellor (TRB) a hidden gem, will previous price action repeat?Hello again dear reader for a another analysis.
From August to December 2023 TRB has seen a MASSIVE move of 7000% gains over the course of just 126 days. Since then it has corrected a whopping 96%!
There is now a reason to be bullish on this coin. Looking at the drawn structure we can see multiple important touch zones described with the letters ''A till F'' (NOT ELLIOT). It is quite possible price action might correct further till 19$ where a big support zone lies, but there is no guarantee that ''will'' happen.
Target: 1200$ (M-cap of 3B which is very achievable)
Stoploss: 15$
I aim to keep analysis simple and easy to understand. Any questions of requests for analysis feel free to ask!
Rustle
