TRB - It's go time!With the SR flip of the resistance against $BTC, $TRB looks quite strong against both dollar and bitcoin.
TRBUSDT

$TRB - BUY TIME IS NEAR$TRB needs to break above the immediate resistance. Depending on the market sentiment, it may be soon, or can take upto 10 days.

TRB to $40 Confirmed 🚀🚀TRB is currently range bound and will soon do a range-bound breakout which will lead to an impulsive move upside.

$TRB - gonna popThis chart looks very nice, looks to be ready to pop out this bottom range - a 5 month area of consolidation
The coin only released very late August 2020, with only a 1,7 million supply
It's another DeFi project that works in decentralised lending, where they work on providing solution for oracles and collarorations with ChainLink.
Technically a very nice chart, and fundamentally very sound too, fill the bags boys


TRBUSDT Inverted head and shouldersInverted head and shoulders on a daily chart. The Short term Volume And Price Oscillator (SVAPO) is showing a reversal divergence with volume and price - price down and the volume up! Good luck!

Opportunity in TRBThe analysis is based on MACD and as well as support, MACD behavior and its implications are seen on chart same might get repeated
If able to catch at $16 then that might be a good entry.
Tps will be at $20, $26, $32, $36
for this trade will go for a stop loss of 10$ safe or 12$ if BTC moments are strong act accordingly Manage risks


2 ALTCOINS That Are About To Explode Into Bull Market MartyBoots here. I have been trading for 14 - 15 years and I am here to share my ideas with you to help the Crypto space.
DO NOT BE LEFT BEHIND Bitcoin Bull Market Is here right now
Crypto ALTs Are Very Bullish right now should move a lot higher
This market has potential parabolic structure
ALTs can Explode - people are sleeping on it
If you want help trading Bitcoin or any other ALT coins hit me up , We will improve your trading . Have a look at the link below

TRBUSDT (TRB) - POTENTIAL BREAKOUT ANALYSIS 🔎
- TRBUSDT is consolidating in a symmetrical triangle pattern.
- Breakout is imminent.
BUY ENTRY ⬆️
- Breakout above the symmetrical triangle's inclined resistance.
TARGETS 🎯
- Horizontal resistance levels (R1, R2).
- Projected ascending channel resistance.
- Fibonacci extension levels.
SETUP INVALIDATION ❌
- Breakdown below the symmetrical triangle's inclined support.

DIA leading TRBDIA leading TRB
As the title says, DIA is running on the cycle slightly ahead. This creates opportunities obviously.. :) But they are quite in the lockstep movements.
Because of the supply and some of the tokenomics I decided to jump the DIA ship and board TRB instead.. that may have been a dumbass move. One problem is the per token cost of TRB will put off noobs. They'll buy DIA instead as they just get more. But we shall see which prevails.
Seems DIA also uses more of a centralized database within the functionality of their oracle service, which kind of defies the whole point of decentralized oracles. My friend brought this up and it kind of put me off DIA a bit.
Regardless these are two rather obvious oracle small cap plays, which no doubt will pump like crazy at some point in this cycle. They actually have some utility.
glhf

TRB 1H BUYSet some Buy orders near the Trendline
Remember no more than 5% of the deposit in one trade
SL: next sell signal

TRBUSDT - DOUBLE BOTTOM ANALYSIS 🔎
- TRBUSDT is printing the double bottom trend reversal pattern on the daily timeframe.
- This is a bullish pattern.
BUY ENTRY ⬆️
- Breakout above the neckline resistance (R1).
TARGET 🎯
- Resistance 2 (R2)
SETUP INVALIDATION ❌
- Breakdown below the previous swing low.


#TRBUSDT Trading planHi friends!
This coin has been trading in the channel for a long time at historic lows.
Provided the price breaks the strong resistance level of 25.70$, I will buy!
Target 1: 34.144$
Target 2: 45.00$
✔ Do not forget to trade using your own trading system and with stops!
✔ If you like what I do, put 👍 and subscribe! 🙌👀
✔ This is the best gratitude for my work! 💕

TRBUSDTWhat we see now :
1- the price at 25,6$
2- the support level at 22,6$
3- the resistance level at 32,7 $
4- 2 of 3 positive buy signals are active right now
5- the price cross MA 50
What we do now :
- there is 2 positive buy signals and the price is cross the resistance level now we have to wait for daily confirmation then it will be good opportunity to take position in this trade

TRBUSDT is forming cup and handle patternTRBUSDT is forming cup and handle pattern. if it break 25.20 it can go up to the 33. other resistance are 27 and 30.

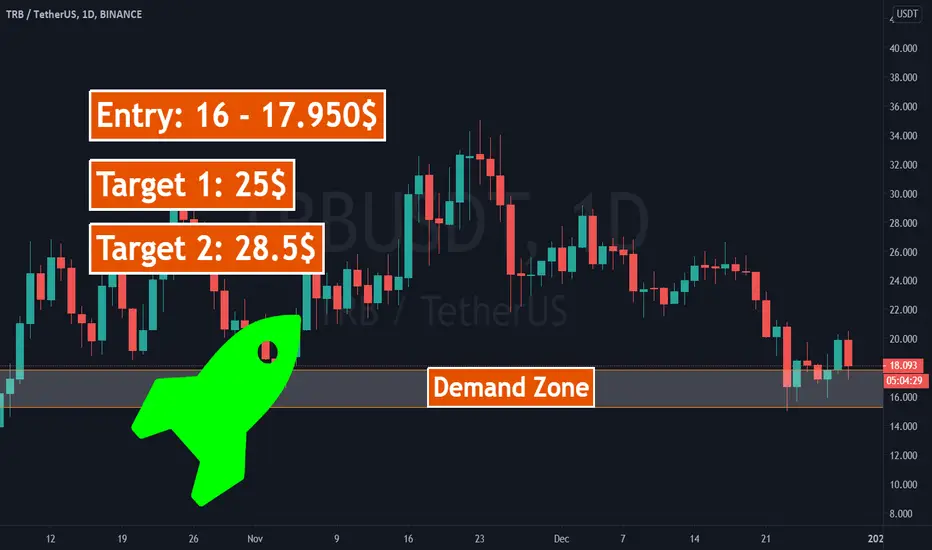
💡 TRB: Long TradeTRB has received daily based demand zone and now in accumulation phase,
soon i think it will start upside rally.
REMEMBER in ALTSEASON, THIS COINS VOLATILTY WILL BE VERY HIGH, BUY ON EVERY DIP.
TRBUSDT - Potential buy entry 🔼TRBUSDT is printing a falling wedge pattern.
Price brokeout above the wedge resistance.
Price action is printing a minor ascending triangle pattern.
Buy entry ⬆️ - breakout above the ascending triangle resistance.
Target 🎯 - resistance level.
Setup invalidation ❌ - breakdown below the ascending triangle inclined support.


