Unveiling the 2024-2025 Price Revolution Post-HalvingIntroduction:
In anticipation of Bitcoin's fourth halving scheduled for April this year, let's delve into historical price patterns to assess potential heights Bitcoin might reach in the years 2024-2025 and when the anticipated start of the next bull run may occur.
Historical Analysis:
First Halving (28-11-2012):
A year before this event, Bitcoin was modestly priced at $2.48. As the market turned bullish, it climbed to $12.20 at the halving and continued its ascent. A year later, it peaked at $1,131.
Second Halving:
Before this halving, Bitcoin had fallen to $269 but rebounded to $650 by the time of the event. It soared for about a year post-halving, reaching an impressive $2,518.
Third Halving:
The cycle repeated, with Bitcoin dropping to $7,255 before the third halving. It then modestly rose to $8,762 at the halving and significantly surged to $56,615 a year after.
Analyzing the Fourth Halving:
The fourth halving is expected in April this year in the current cycle. A year before this date (April 2023), Bitcoin had an uptick to $31,000. This suggests a strong likelihood of a substantial rise post the fourth halving, potentially lasting until April-August 2025 and surpassing the previous high of $69,000.
Key Takeaway:
Bitcoin's price behavior exhibits remarkable consistency around each halving. It gradually begins to rise a year before the halving and continues for 12-16 months post-halving, reaching new peaks before entering a bearish phase.
Investment Strategy:
For long-term investors, understanding these patterns is crucial. The peak for this cycle might be between April - August 2025. It would be strategic to start exiting the market gradually at this point.
Conclusion:
As we analyze historical patterns, Bitcoin's potential trajectory in the coming years appears promising, emphasizing the importance of strategic investment decisions in light of the upcoming halving event.
Treandanalysis

by using my past knowledge the can do thisi think that the market will do this that the market will form lower lows into support and the support will break and then it will retest back the support

Riding the Upswing: #AVAX Long Trade Setup with Entry Strategies#AVAX long trade setup:
Entry Point:
Buy at CMP: Consider entering the trade at the Current Market Price (CMP), taking advantage of the current market conditions.
Additional Entry: Add more positions up to $37.4. This level is identified as a potential strategic buying opportunity.
Target Prices:
Set specific target prices at $41.5, $43.2, $44.7, $47, and $50. These levels represent potential profit-taking points as the price moves upward.
Stop Loss (SL):
Implement a mandatory stop-loss at $35.45. This level is chosen to effectively manage potential losses. A stop-loss is a risk management tool that automatically sells the asset if the price reaches a specified level, limiting potential downside.
Leverage:
The recommendation suggests utilizing leverage based on individual risk appetite. It emphasizes the importance of exercising caution and choosing leverage wisely. Leverage amplifies both potential profits and potential losses, so it should be used with care.
Cautionary Note:
Reminds traders to do their own research (DYOR) before making any trading decisions. This reinforces the idea that the provided information is not financial advice.
In summary, the recommendation outlines a long trade setup for #AVAX, providing specific entry points, target prices, and a mandatory stop-loss level for risk management. It also advises caution with leverage and underscores the significance of conducting personal research. As always, the information is not financial advice.

"Capitalizing on Opportunities: #1000RATS Long Trade Setup!#1000RATS long trade setup:
Entry Point:
Buy at CMP: Consider entering the trade at the Current Market Price (CMP), taking advantage of the current market conditions.
Additional Entry: Add more positions up to $0.239. This level is identified as a potential strategic buying opportunity.
Target Prices:
Set specific target prices at $0.304, $0.333, $0.405, $0.456, and $0.542. These levels represent potential profit-taking points as the price moves upward.
Stop Loss (SL):
Implement a mandatory stop-loss at $0.2143. This level is chosen to effectively manage potential losses. A stop-loss is a risk management tool that automatically sells the asset if the price reaches a specified level, limiting potential downside.
Leverage:
The recommendation suggests utilizing leverage based on individual risk appetite. It emphasizes the importance of exercising caution and choosing leverage wisely. Leverage amplifies both potential profits and potential losses, so it should be used with care.
Cautionary Note:
Reminds traders to do their own research (DYOR) before making any trading decisions. This reinforces the idea that the provided information is not financial advice.
In summary, the recommendation outlines a long trade setup for #1000RATS, providing specific entry points, target prices, and a mandatory stop-loss level for risk management. It also advises caution with leverage and underscores the significance of conducting personal research. As always, the information is not financial advice.

WAVES/USDT An Excellent Chance for a LONG Trading Opportunity!BINANCE:WAVESUSDT.P Recently, the weekly chart is trying to break a long-term resistance level. The price faced rejection at this resistance on the last three occasions, but now, we expect a breakthrough. After this breakout, a unique opportunity arises for a long trade with a potential target price in the range of 5 to 6 USD.
#WAVES/USDT LONG 🍀
Leverage: 3x
Entries: $2.5249
Take profit 1: $2.8586
Take profit 2: $3.8717
Take profit 3: $5.9554
Stop Loss: $1.1164
Stay tuned for trade confirmation and additional updates. Feel free to express your thoughts by liking and sharing in the comments section:)
Thanks
The sroced.

Breakout Weekly chart analysis
Target
Stop loss 635 Target 877
Stop loss 660 Target 800
Stop loss 595 Target 900
No recommendation for buy and sell
Only education purpose
Take own analysis

GOLD correction to SUPPORT line and new GROWTHThe price formed range zone. The market is ranging after impulse leg up and it might descending cahnnel which is going to be a correction against main trend. I think gold will range in this pattern for some time retest the support level and upward trendline. My goal is the resistance zone at 2030
Traders, if you liked this idea or if you have your own opinion about it, write in the comments. I will be glad 👩💻

Gold Analysis and Trade Idea for 27-Feb-2023Bullish
- Market is in one day bull trnd and will make a LH
- Gold showed bearish trend from past 4 weeks and bearish trend is still continue until gold breaks 1817-20 Resistance zone
- Gold is facing psychological Support at 1800 which it will test in this week so Support zone is 1800-1806 in this zone gold can bounce back. and keep testing 1817-1820 Resistance zone.
- Long reversal trend is only possible if gold breaks 1820 level or above yellow doted line.
- On other Hand Dxy is getting stronger which will push gold up and give bulls a chance to jump into the market.
- Gold has made a LL on 4H around 1806.70 and can move up for today to make LH
Till this situation continous I'll wait for best move by selling in resistance zone 1817-1820 and buying in buy zone.
--Happy Trading | @patientwolff @xeshaan

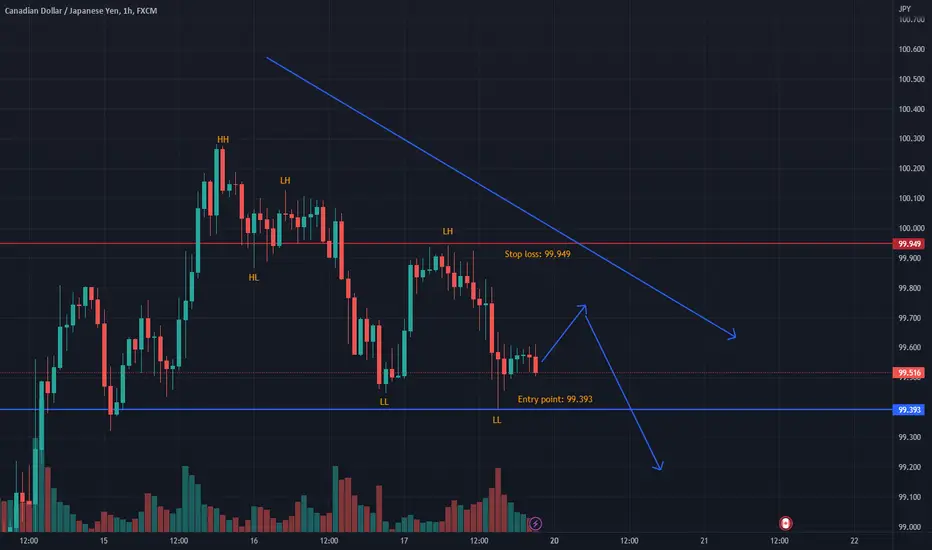
Bearish trend for CADJPYthe trend is making lower highs and lower lows, this is the indication of a bearish trend.
Permanent Magnets Ltd - Resistance + Trendline Breakout📊 Script: PERMAGN (PERMANENT MAGNETS LTD.)
📊 Sector: Electrical Equipment
📊 Industry: Engineering
Weekly Time-frame
Key highlights: 💡⚡
📈 Script is trading at upper band of Bollinger Bands (BB) and giving breakout of it.
📈 Already Crossover in MACD .
📈 Already Crossover in Double Moving Averages.
📈 Volume is increasing along with price.
📈 Script has given Trendline Breakout which was working as resistance(sown in chart) in both time frame daily as well as weekly.
📈 Current RSI is around 83.
📈 One can go for Swing Trade.
⏱️ C.M.P 📑💰- 507
🟢 Target 🎯🏆 - 597
⚠️ Stoploss ☠️🚫 - 468
⚠️ Important: Always maintain your Risk & Reward Ratio.
✅Like and follow to never miss a new idea!✅
Disclaimer: I am not SEBI Registered Advisor. My posts are purely for training and educational purposes.
Eat🍜 Sleep😴 TradingView📈 Repeat 🔁


banknifty can fall tomorrow!Banknifty forming rising wedge kind of pattern. It has given a very good upward rally last week tomorrow it can fall down. You can take short entries tomorrow if it breaks the trend.

Gala Analysisgala down to 0.22$ and then be grow to 1.50$ Very good opp to buy it
Gala Technical analysis Basically on elliott waves Principles and Priceaction Strategy and trend Principles
never forget it.

Nifty Intraday trading levels for Monday 29 NovemberNifty Intraday trading levels to watch on Monday 29 November

BankNifty Intraday trading levels for tomorrow 17 NovemberBankNifty Intraday trading levels for tomorrow 17 November


VERTEXCHARTS | AUDCAD TRADE IDEAAUDCAD is bouncing back from the strong support zone - fake breakout occurs comparing with the recent previous support
Like and Comment to support this idea.

Itc breaking outGuy itc is given a breakout in 4h and 1 day timeframes it has been consolidating for ages hope this time it will make new highs

ONEUSDT Extremely Bullish on Harmony 🚀Harmony is giving me a good vibe I must say. Clearly there is unique trend , HARMONIC patterns it has carved out for itself over time.
Consecutively ONE has had series of Bullish reversal mode of movement uninterrupted.
Every time it makes this move it sets another ATH . I see a huge new ATH this time as the correction taken quite longer than expected.
A solid Support near 16c has been defended by the bulls few days straight. Quite impressive the rally behind the Harmony token.
Nothing really to chart here, no need for complex analogy . It is all clearly drawn out in the Chart , crystal clear the next path for ONE which is, you guessed rightly UP 🚀
Bulls are likely going to attack at dawn and push upward. I am extremely bullish on Harmony .
Follow 🚶
Like 👍
Share your thoughts !

EUR/USD Signal to open LONG position {hidden Divergence}Greetings!
Euro / U.S. Dollar
If the 1.18289 line is broken, the price will go up to around 1.18600
As you can see, the RSI show a Hidden Divergence divergence, Which indicates a price increase.
ADX Below 25 means that the market has a neutral trend
Remember that oscillators show the future of the market
Line 1.17900 is a weekly and monthly support that is very important
Daily resistance 1.18600
Resistance level : 1.18600
Support level : around 1.17900
Things can change...
The markets are always changing and even with all these signals, the market changes tend to be strong and fast
Traders, if you liked this idea or have your opinion on it, write in the comments,We will be glad.
Thank you for seeing idea .
Have a nice day and Good luck.


