If UNI brakes Out Of Descending Triangle Hey guys welcome for a fresh crypto update
--------------------------------------------------------
A request from all of you to please like and follow our Hard work to keep encouraging us, there's no fee for likes and followings :)
--------------------------------------------------------
As you can see in this chart Uni can brake out of a descending channel towards the upside. A good trade opportunity.
UNI looks good for a buying opportunity under 3.75$-3.72$ expecting another rally towards 5.1$-5.3$ zone, however 3.36$ will the best stop in case things goes wrong. There's Good RR 2
--------------------------------------------------------
Thanks for reading...
--------------------------------------------------------
this is Husain Zabir, signing out
Thankyou...
Trend-analysis

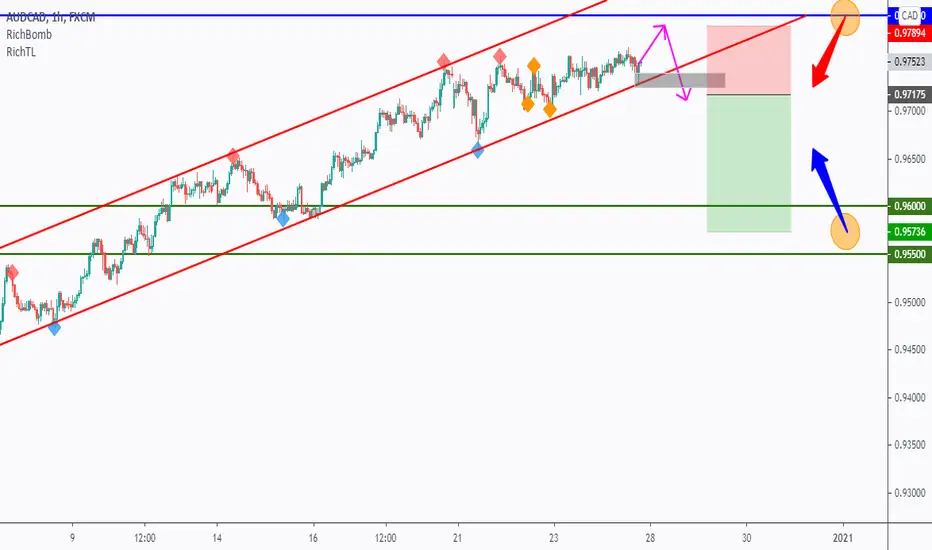
AUDCAD waiting for the sell setup to formHello everyone, if you like the idea, do not forget to support with a like and follow.
on DAILY: AUDCAD is sitting around strong resistance in blue so we will be looking for sell setups on lower timeframes.
on H1: AUDCAD formed a channel in red so we are waiting for a new swing to form around it to consider it our trigger swing.
Trigger: Waiting for a momentum candle close below the gray area to sell.
and until the sell is activated, this one would be overall bullish and can still dive inside the blue zone.
As price approaches our lower green support, we will be looking for buy setups.
Good luck!
NZDCHF - Sell valid - price pulled back..... 🎯NZDCHF sell signal was valid earlier.
Now we have seen price pull back to entry price, you can take another look.
Entry 0.62809
SL 0.63029 (22 PIPS)
TP1 0.6256
TP2 0.62311
TP3 0.61813
Regards
Darren

Plans are preparedwaiting for 30m closed. plans are prepared. wait for breakout above or below previous candle

Uptrent on the way of NZDCADI predict an uptrend for NZDCAD
target: 0.95150
If it does not go the way I predict, then it will possibly go down to 0.86000 after reaching the 0.91600

GBPUSD video top-down AnalysisHello everyone, if you like the idea, do not forget to support with a like and follow.
Here is the top-down analysis for GBPUSD, feel free to request any pair/instrument or ask any questions in the comment section below.
Best of luck!


SEKJPY video top-down AnalysisHello everyone, if you like the idea, do not forget to support with a like and follow.
Here is the top-down analysis for SEKJPY, feel free to request any pair/instrument or ask any questions in the comment section below.
Best of luck!

OSP - where to from here?We look at ASX:OSP after a rapid mid-year rise and subsequent fall-off.
After entering the downtrend in August, ASX:OSP hit a support of $0.022 before failing to break through 0.618 fib resistance. Subsequently the previous support of $0.022 turned into resistance.
New 'Support 1' of $0.018 was found which ASX:OSP has looked to have bounced off at the start of November.
Four-month downtrend will be tested again next week and will dictate how the remainder of 2020's trading plays out.
Crucially, DMI+ crossed over the ADX in early November and this still remains (although close to the 25 level which is the rule of thumb for trend significance)
In addition, standard Stoch is showing a movement away from oversold.
Finally, the WVF is hinting at a movement away from market bottoms.
An interesting stock to watch over the next week - a movement away from Support 1 is likely and even trading sideways would see the four-month downtrend broken.

EURTRY video top-down AnalysisHello everyone, if you like the idea, do not forget to support with a like and follow.
Here is the top-down analysis for EURTRY, feel free to request any pair/instrument or ask any questions in the comment section below.
Best of luck!

WHERE IS THE USD HEADING? Practical Live Example on DXY IndexHello everyone, if you like the materials in this video, do not forget to support with a like and follow.
and feel free to post ideas/suggestions for the next educational videos in the comment section.
See you in the next one.
~ Rich

EURUSD video top-down AnalysisHello everyone, if you like the idea, do not forget to support with a like and follow.
Here is the top-down analysis for EURUSD, feel free to request any pair/instrument or ask any questions in the comment section below.
Best of luck!

short ttdThe shadow candles and decreasing volume shows the exhaustion in bull trend for ttd post earnings it has ran too much. I would like to start my short position today and if needed will average around 895-900 with stop loss of 920 if breaks with good volume..!!!

EURJPY Sell Setup!Hello everyone, if you like the idea, do not forget to support with a like and follow.
on DAILY: EURJPY is sitting around strong supply in blue so we will be looking for sell setups on lower timeframes.
on H1: EURJPY is forming a trendline in red, but it is not valid yet, so we will be waiting for a third swing to form around it to consider it valid.
Trigger: Waiting for a momentum candle close below the gray area to sell.
and until the sell is activated, this one would be overall bullish.
N.B. when the sell is activated, we will move our stop loss to breakeven as the trade approaches the lower blue trendline.
Good luck!

EURGBP video top-down AnalysisHello everyone, if you like the idea, do not forget to support with a like and follow.
Here is the top-down analysis for EURGBP, feel free to request any pair/instrument or ask any questions in the comment section below.
Best of luck!

EURUSD video top-down AnalysisHello everyone, if you like the idea, do not forget to support with a like and follow.
Here is the top-down analysis for EURUSD, feel free to request any pair/instrument or ask any questions in the comment section below.
Best of luck!

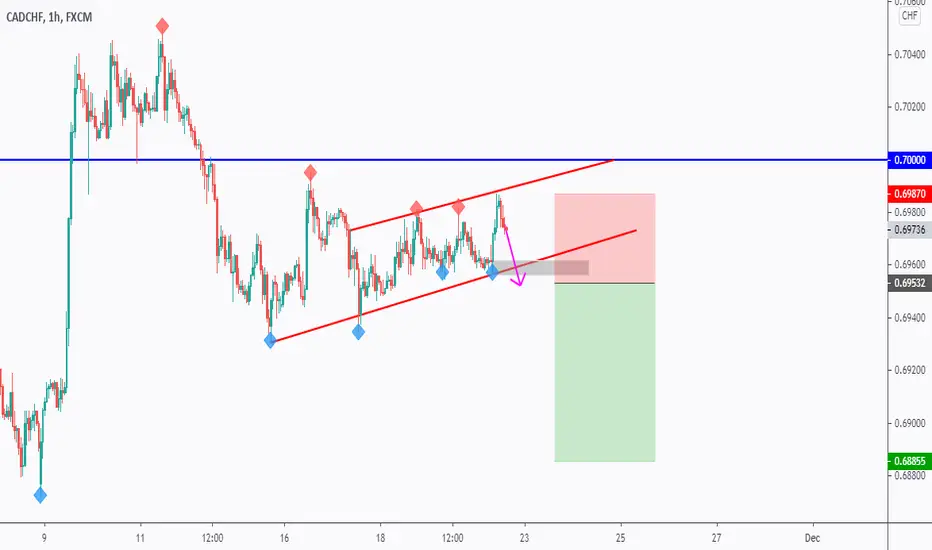
CADCHF Sell Setup!Hello everyone, if you like the idea, do not forget to support with a like and follow.
on DAILY: CADCHF is sitting around a strong resistance (and round number 0.700) in blue so we will be looking for sell setups on lower timeframes.
on H1: CADCHF formed a valid channel in red.
Trigger: Waiting for a momentum candle close below the gray area to sell.
If the price forms a new blue dot around our lower red trendline, then we will update our trigger swing.
NB: Until the sell is activated, this one would be overall bullish.
Good luck!

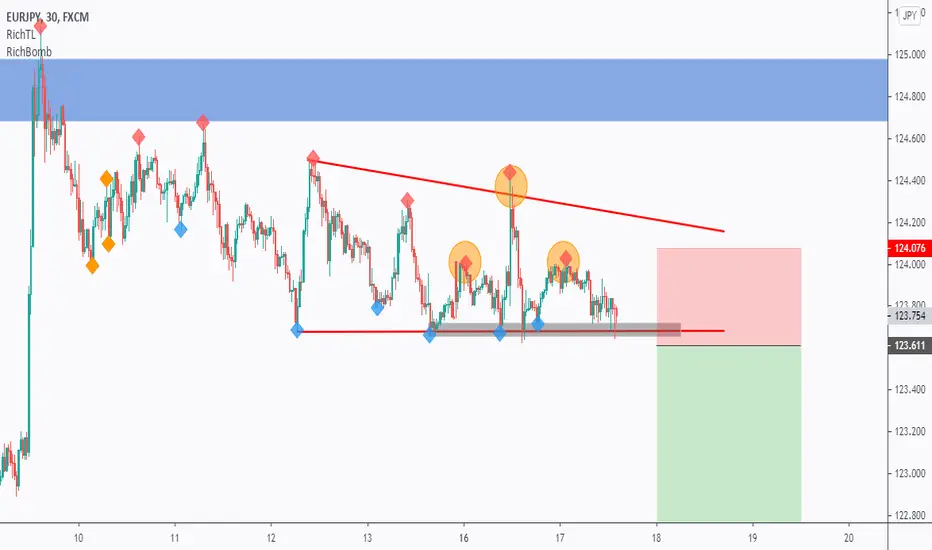
EURJPY Sell Setup!Hello everyone, if you like the idea, do not forget to support with a like and follow.
on DAILY: EURJPY is sitting around a strong resistance/supply in blue so we will be looking for sell setups on lower timeframes.
on H1: EURUSD formed a descending triangle and head and shoulders pattern.
Trigger: Waiting for a momentum candle close below the gray area / neckline to sell.
NB: Until the sell is activated, this one would be overall bullish.
Good luck!
EURCAD Sell Setup!Hello everyone, if you like the idea, do not forget to support with a like and follow.
on DAILY: EURCAD is sitting around a strong resistance in blue so we will be looking for sell setups on lower timeframes.
on H1: EURCAD is forming a trendline in red (not valid yet) so we will be waiting for a third swing to form around it to consider it valid and sell on its break downward.
Trigger: Waiting for a momentum candle close below the gray area to sell.
NB: Until the sell is activated, this one would be overall bullish.
Good luck!

EURUSD Sell Setup!Hello everyone, if you like the idea, do not forget to support with a like and follow.
on DAILY: EURUSD is sitting around a strong resistance in blue so we will be looking for sell setups on lower timeframes.
on H1: EURUSD formed a valid trendline in red
Trigger: Waiting for a momentum candle close below the gray area to sell.
NB: If a new blue dot is formed around our lower red trendline, then we will update our gray area.
and until the sell is activated, this one would be overall bullish.
Good luck!


