USDHUF JUNE 1-5FOLLOWING LAST WEEKS DOWNTREND
WAITING FOR RECTANGLE TO BREAK OUT OF CONSOLIDATION
4 HR FULL BEARISH CLOSURE BELOW 310.887 CONSOLIDATION, ENTER SHORT
Trend-analysis

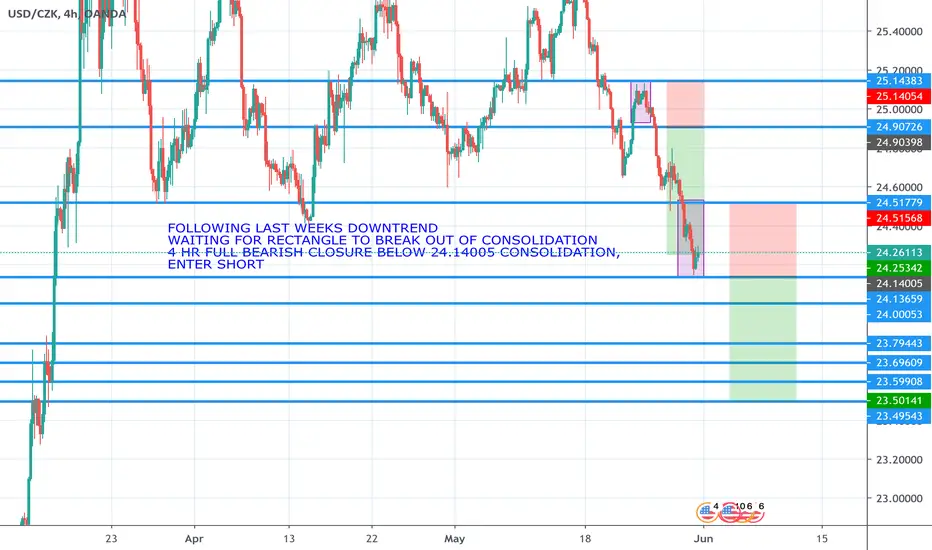
USDCZK JUNE 1-5FOLLOWING LAST WEEKS DOWNTREND
WAITING FOR RECTANGLE TO BREAK OUT OF CONSOLIDATION
4 HR FULL BEARISH CLOSURE BELOW 24.14005 CONSOLIDATION, ENTER SHORT
GBPPLN JUNE 1-5FOLLOWING LAST WEEKS DOWNTREND
WAITING FOR RECTANGLE TO BREAK OUT OF CONSOLIDATION
4 HR FULL BEARISH CLOSURE BELOW 4.91009 CONSOLIDATION, ENTER SHORT

USDPLN SHORT JUNE 1-5 2020FOLLOWING LAST WEEKS DOWNTREND
WAITING FOR RECTANGLE TO BREAK OUT OF CONSOLIDATION
4 HR FULL BEARISH CLOSURE BELOW 3.98802 CONSOLIDATION, ENTER SHORT

USDJPY 28.05.2020This analysis is only intended for educational purposes, not financial advice!
Be safe !

EURUSD 27.05.2020Hello traders,
As we can see on the chart, the price has been rejected two times already from the Resistance trendline near the 1.10 psychological number and heavy resistance as expected from the yesterday analysis.
What is seen on the chart now is that the price reached a region from where it pushed back up and if it holds above these long wicks the EUR/USD pair could see higher prices and eventually break the 1.10 resistance that hold for so long now.
Please remember that this is not financial advice in any way and it is meant only for educational purposes.
If this helped you in any way feel free to leave a like.

A little sprint to the bottom GPB/USD => shortWe have an overall bearish trend and price is at a key/support level. As we can see it traveled up a little bit but the trendline proofs to be rock solid. We are expecting a drop to the next strong support and that the trendline continuously make a good job. Price is currently at a good position. Good opportunity for setting up a better Risk/Reward-Ratio.


Breakout of rangeprice finally broke out of its range to the downside! currently retesting so I'll be looking for sells

AUDNZD - trade running in profit - check out our strategyVery simply strategy, the chart speaks for itself.
For more information on our strategy please view our 'Scripts' page on our Trading view profile.
Our V2 strategy shows the SL and multiple TPs on the chart too.
Works on all instruments
Directly onto your own personal trading view - all devices work
Non repainting
Regards
Darren
Blue FX

AUDCHF - trade running in profit - check out our strategy Very simply strategy, the chart speaks for itself.
For more information on our strategy please view our 'Scripts' page on our Trading view profile.
Our V2 strategy shows the SL and multiple TPs on the chart too.
Works on all instruments
Directly onto your own personal trading view - all devices work
Non repainting
Regards
Darren
Blue FX

Long in EUR/GBPEUR/GBP represent in some days a double bottom, now, this pattern is broke up the resistance and now a support to put in long. So, its very interesting what pattern chartist do next do. So, It's very important to stay watch this market to know what knowing of the psycology this pattern represent. It's may be to form a ABCD or ar special or BAT. Also, a data interestig it's what I use Fibonacci and mark a retrocement of 0.382% of Fibonacci, this is a good area to buy. Indicator show in H1 timeframe that we can see a possible up of all indicators especially the MACD.
Also, I want to say you a thing. Because I study a lot how indicators is move into the price action in each timeframe, this is an example of my predictions that I see while of my strategy that I use, I study a lot, a lot but a lot so indicators to know how it's work using the price action and analyzing the past, future in the graphs to study the markets movements.


Waiting and managing. I recently purchased more BSV at 182$. The point is to see if it will drop more to the bottom cause it did go down to 171$ yesterday. Which means that area is still accessible. As of right now a purchase at 182$ was good but we are still looking as to what will happen next. If it goes up then we wait for the drop to buy in. If it goes down then we buy in. Points to look out for are 160$ on the bottom end and 210$ at the upper end.

ADI LONG Trend Analysis PredictionStock rises after drop down. Order should placed above previous low Analog Devices (NASDAQ:ADI) to earn +11.2% . The analysis based on Fibonacci Extension and RSI Algo trade line.

GOLD GOLD GOLDGold.
The price strictly went according to my past schedule.
I think the price will still reach the resistance line, but then it will go down.
Having broken through the support line.

EURGBP SHORTIn a nice downward trend zone looking to continue as we approach top trend line for 100 pips 👍✅

Bullish short term on XRPM20Self explanatory trade thats clean and simple.
- Break in overall down trend
- Bullish trend forming
- Break in resistance
- Look to buy the retest and take profit at 2%

XRP USD bottom finally in?I think so.
Look at my longterm LOGchart. It has hit the bottomline like back in 2016/2017. Might hit that line again, but from there --> perhaps moon!

Waiting For Next Week Price Action Confirmation Long EntryGBPUSD Can go Long run !!!! Buy
Waiting for confirmation and best entry
patience is the key

ZEC Daily Chart Pinnacle Moment After wiping away substantial gains along with the rest of the market. ZEC is ready to decide trend direction on the daily. We recently had a Golden Cross which gave us our first impulse up. Following that move we have had about a 20% pullback from candle body high to low from last high. Stochastic RSI just made bullish cross in oversold conditions. However, Price may need to come down and touch the 50 day moving average first. If we can break above the $75 region I see our next major resistance at $100.
I am long term Zcash investor only swing trading 5% of my overall position. I see an opportunity in ZEC similar to the early days of BTC. You may agree but that is my opinion long term. There are only 8 million "shares" in circulation. It has never been through a block halving event meaning the supply has not yet seen a reduction. After the first BTC halving price went from around $10 to $1000. Zcash in my opinion has massive institutional potential.
Not Investment Advice.
