EUR/AUD +140 Pips Wohoo Congratulation if you did enter with me the price has broken the weekly uptrend on the daily time frame, using the fib tool we can see the possible sell trade at the 71%,78% fib level
Trend-analysis

XAU short opportunityxau is bearish in HTF and rejected from a seller POI .and building liquidity below the OB .if it wants to fall from the current point then it should first clear the current liquidity and again retest the lower 15M OB . And in case if it reaches to the top OB prefer high rejection from it.and go for short. if it shows bullish momentum then the setup is invalid.
#AQURISHA

Eurusd ready to downfall read the caption The eurusd pair trade little change for a second eurusd will down soon so wait and see consecutive day changing hands at around 1.0880 ahead of united states us opening the peaked at 1.0906 while it net a bottom at 1.0876

AUDUSDPrice is finally breaking through the range by making clear H's & L's, i would be waiting for Intraday Sell opportunities after the clean exhaustion on 1h TF and the target would be around 0.66520

GBPUSDUntil price continue holds the 1.2720 level, i would be looking for buying opportunities on intraday timeframes, or if price come to 1.2795 major support level and shows the depletion in bullish momentum, i would be looking for Sell opportunities on intraday timeframes

2024 Crypto SUMMER is here! PRICE, TRENDS & FORECASTSIn this video we lay out our short and long-term forecast for the entirety of 2024 Crypto Summer and beyond. Also, we do a little review and take a look at how our forecast stacked up against the eventful 2023 Crypto Spring. As always please feel free to leave your thoughts and ideas in the comments and thanks for watching!

After strong upward impulse, BTC can make correction to 44150Hello traders, I want share with you my opinion about Bitcoin. Looking at the chart, we can see how the price some days ago reached the resistance line of the downward channel, which is located in the support area, but at once rebounded and continued to decline in the channel. Later BTC fell to the support level, which coincided with the support line of the channel and buyer zone, but then the price rebounded and made impulse up to the resistance line. After this, Bitcoin bounced and declined until to support line of the channel, thereby breaking the 42000 level, but soon price rebounded and rose back, making a fake breakout of this level. Next, the price some time traded near the 42000 level and later rebounded up to the resistance line of the downward channel. In a short time, BTC exited from the channel and made a strong upward impulse to 45900 points, thereby breaking the 44150 level, which coincided with the support area. Recently it started to decline and possibly Bitcoin can make a correction to a current support level. For this case, I set my target at this level - 44150. Please share this idea with your friends and click Boost 🚀

BTC/USDT showing a prominent bearish double top pattern(M)BINANCE:BTCUSDT.P The 12-hour chart is showing a prominent bearish double top pattern(M), and a break below the trend line is likely to lead to a drop in the $41,000 to $40,500 range. Currently the price is above the trendline and we will see what happens in the future!✨

BIGTIME/USDT LONG Setup!BINANCE:BIGTIMEUSDT.P Observing the chart, it is evident that BIGTIME has undergone a distinct breakout on the 4-hour chart trendline, signaling a strong bullish momentum. This breakout aligns well with the overall bullish sentiment in the market, adding further support to the optimistic outlook for BIGTIME. Anticipating the continuation of this bullish trend, we can set our sights on achieving the targets set for our LONG trades.
#BIGTIME/USDT LONG
Entries: $8.062
Take profit 1: $0.6723
Take profit 2: $0.7347
Take profit 3: $0.8086
Stop Loss: $0.5455
Stay tuned for trade confirmation and additional updates. Feel free to express your thoughts by liking and sharing in the comments section:)
Thanks
The sroced.

GAS/USDT The confirmation of a breakout for a long trade!BINANCE:GASUSDT.P The breakout from resistance in the GAS chart is evident, signaling a favorable moment to enter a long trade.
#GAS/USDT LONG SCALP
Entries: $7.196
Take profit 1: $7.308
Take profit 2: $7.518
Take profit 3: $7.918
Stop Loss: $6.543
Stay tuned for trade confirmation and additional updates. Feel free to express your thoughts by liking and sharing in the comments section:)
Thanks
The sroced.

RUNE/USDT The breakout for a long trade in has been confirmed!The chart clearly indicates that RUNE has broken out of its resistance. Now is an opportune moment to initiate a long trade.
#POLYX/USDT LONG SCALP 🍀
Leverage: 3x
Entries: $5.940
Take profit 1: $6.291
Take profit 2: $6.850
Take profit 3: $7.205
Stop Loss: $5.353
Stay tuned for trade confirmation and additional updates. Feel free to express your thoughts by liking and sharing in the comments section:)
Thanks
The sroced. BINANCE:RUNEUSDT.P

Gold (XAUUSD) Update Next Week 18-22 Dec23 The market seems poised for a period of consolidation, suggesting a sideways movement before a potential directional shift. During this phase, support is anticipated around 2010 - 2007, and a retracement could lead to a brief upside towards the resistance at 2028 - 2030. The market currently aligns with a green chart pattern, showing a possible resistance followed by a descent to 2000 - 1995 for Target 1, and further down to Target 2 at 1975 - 1960.
Other side, If market successfully breach its resistance levels of 2030 - 2033, as indicated in the buying zone, an upward trajectory is likely possible. This could result in reaching the Target 2050 - 2060, with a subsequent move towards 2090. Monitoring the market closely is crucial to identifying whether it will adhere to the consolidation phase or exhibit a breakout in either direction.

EURUSD: Theory of daily movement: Trading RangeHello
Considering the movements, I think today's movements are suffering
Today, our movement scenarios are a bit too much. But the move I expect for the #EURUSD today:
Let's have a temporary bullish move first, if it reaches my desired point, I'll look to sell at that point
If it's against my opinion and I see a drop, I try not to trade unless the price reaches the area I specified on the floor.

TRIANGLE breakout in HDFC AMCElliott Wave Analysis:-
Triangle breakout has happened and retracement is taking place.
with 2649.35 as stop loss we can get entry at current level.
Target
1. it has to cross 2737
2. 2772
3. 2800 - 2854
if the C wave was broken downside then the triangle may be in reverse and the fall will be the size of the A wave we marked.

Will GBPUSD bounce back from here?GBPUSD is one of the trading pair. By looking on the current structure on chart we can say it's below the major trend. And also reaching to the high demand zone.
There is a good possibility it will be bouncing back from here because of
Reason :
1. RSI is in oversold zone. But don't have good strength so buyers will start making positions here.
2. Zone has provided the good support zone for demand.
3. Reduction of volume of sellers.
Verdict :
Bulliness in near future.
Plan of action :
Wait for breakout of dotted trendline.

US DOLLAR INDEX IS APPROACHING ITS IDEAL COUNTER-SWING TARGETThe US DOLLAR INDEX is approaching its ideal counter-swing ideal target where we anticipated that profit taking and fresh selling interests will drive the index lower.

You can see the Momentum Picking-up. A Chance 2 make Some Easy $I am mainly Looking at the Trendline, as you can See, that will Guide the stock up in the near-term. As u can See, From the Current Trajectory it Should make Some quick gains.

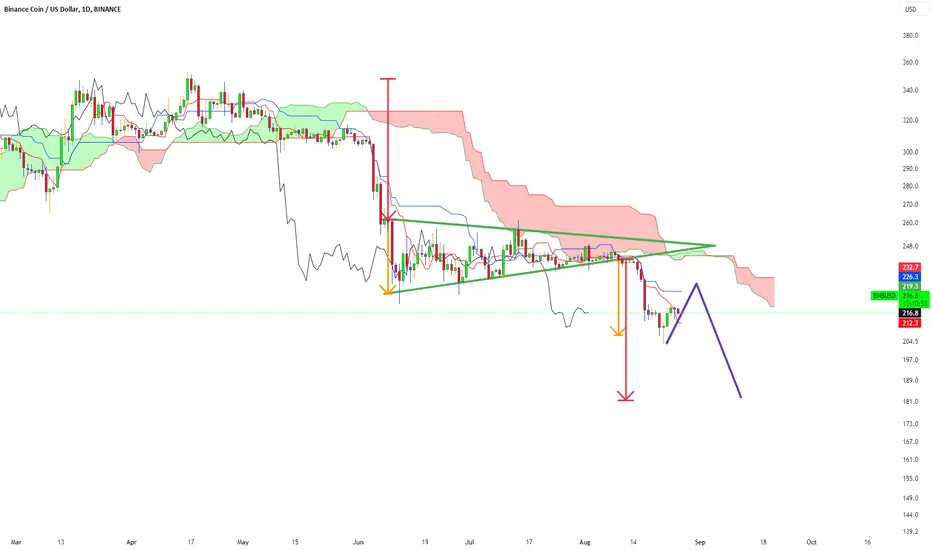
BNB Short-Term Vision !Hello Guys 🙌
Let me tell you something clearly.
it's not financial advice. it's just my vision of the chart of BNB.USD
I wanna share this vision with you. That's all.
Please read it carefully and tell me what you think.
As you see the main trend is still bearish. because we are under the Komo cloud.
The price is far from Kijun-sen.
As we know the price is so eager to be close to Kijun-sen and because of slowing movement In Kijun-sen, the price should be waiting to reach Kijun-sen.
So, we can expect to reach the price of 225-230 USD and then the next scenario will be activated.
So after that, we have to wait for a negative switch between Tenken-sen and Kijun-sen which can lead to further drops.
I specified the short-term target. after breaking the triangle to the price we expect to move. we have two targets. the first one is a Yellow arrow and the second one is a Red arrow. (The last swing)
The main support Zone of around 180-185 USD is everything for Binance coin. I hope Binance Coin never loses this zone. if the price loses that, everything will change for Binance coin and all the market.
Do you agree with me?
do you think Binance coin will lose the main support one and drop?
please do not forget to Like, share, and write your comments below the link.
I'm so eager to know what you think.
and what's your favorite movement in Binance coin?
Share your thoughts in the comments 🙏
Don't Forget To Push The Boost (Like) Button and Follow Me for more!
Best Regards , Ho3ein.mnD
Usd might have some upside to 102.xx area...From 102 area then on watch potential turning already.
Trend on higher timeframe i believe is still down.
**Find out more from my Tradingview Stream this week**
***************************************************************************************
Hello there!
If you like my analysis and it helped you ,do give me a thumbs ups on tradingview! 🙏
And if you would like to show further support for me, you can gift me some coins on tradingview! 😁
Thank you!
Disclaimers:
The analysis shared through this channel are purely for educational and entertainment purposes only. They are by no means professional advice for individual/s to enter trades for investment or trading purposes.
The author/producer of these content shall not and will not be responsible for any form of financial/physical/assets losses incurred from trades executed from the derived conclusion of the individual from these content shared.
Thank you, and please do your due diligence before any putting on any trades!

#GOLD #XAUUSD 1D|4H Sell🔘Broke the structure on the daily timeframe
🔘Downtrend on the 4 hour timeframe
If we broke market structure on the 4 hour timeframe I think we we'll go a little higher before drop, but if we break the red level on the daily timeframe, the analysis becomes invalid🙅♂️


XAUUSD: Operating strategy for the second week of JulyThis week's gold analysis: The trend of gold this week is still the same as last week, and it cannot get out of the range shock. I originally thought that the non-agricultural situation could break the current situation of gold. Still seems disappointed.
After bottoming out and recovering on Friday, it seemed that the rise was strong, but it was just in shape. After rising to the 1934 line, the bears had the upper hand, and there was no upward momentum anymore. Before I thought that the overall short position cannot be reversed if it does not stand above 1930, which also proves what I thought. At present, we can see that the price of gold has risen by about 25 U.S. dollars since the news of non-agricultural benefits came out, and the closing price is also firmly above 1925. It can only be said that the current gold short forces have been temporarily suppressed, and the bulls have the momentum to regain their dominant position, but before breaking through the 1940 position, it can be said. So what we are considering now is not to look long or short, but to consider the position of entry is the key. This week mainly depends on the release of CPI data on Wednesday to see if gold can break through the range and go in a new direction.
So this week's operation strategy, just find a suitable point to enter the market. Because I only do short-term within the day, so the operation is still the same as last week, just sell high and buy low. Net assets increased by 37% last week, hopefully I will make more profits this week! Focus on the 1910~1940 interval, follow my new post for more detailed entry timing

EURUSD continues in a bullish trendDuring this week the price seems to have confirmed a bullish flag charrtist pattern that would take the asset to the 1.09785 points in the following weeks.
