XYRO/USDT NEW VOLUMEXYRO/USDT NEW VOLUME
High riks coin, same time its a coin which can show new volume coming time
Trend

RUNE/USDT DAYTRADE VOLUMERUNE/USDT DAYTRADE VOLUME
It can start a new uptrend volume in the coming hours

Gold (XAU/USD) 4H: Bullish with Possible Pullback?Gold (XAU/USD) 4H Chart Analysis: Bullish Trend with Possible Pullback
Key Observations:
1. Price Action & Trend:
The price is currently trading around $2,817.685.
The trend appears bullish, with a strong upward move.
There is a marked internal liquidity (Int. LQ) taken, indicating that liquidity has been absorbed, which could lead to further upside.
A market structure break (MB filled) suggests past resistance turned into support.
2. Technical Indicators:
Exponential Moving Average (EMA 200, red line) is at $2,709.123, which is significantly below the current price. This suggests that gold is in a strong uptrend.
Relative Strength Index (RSI, 14 close) is at 68.56, nearing the overbought zone (70) but still has room for potential upside.
3. Projected Movement:
The chart suggests a potential pullback (small consolidation) before further upward movement.
Fair volume ranges (marked in red) indicate levels where price may slow down or consolidate before continuation.
Price is above key liquidity levels, which may act as support.
Conclusion:
The trend remains bullish, and the price could continue rising after a minor consolidation.
Key levels to watch:
Support: Around $2,800 (former liquidity level).
Resistance: Next potential target is $2,840 - $2,860.
Risk Consideration: RSI is approaching overbought levels, so a short-term correction could occur before another push higher.

ETH - One More, No More!Hello TradingView Family / Fellow Traders. This is Richard, also known as theSignalyst.
📈 ETH has been bearish trading within the falling channels.
🏹As ETH is hovering around the lower bound of the channels, which lines up perfectly with the $2,500 round number, it would be an attractive zone (at least for me) to look for longs.
🏹On the other hand, for the bulls to take over long-term, a break above the upper trendlines and $3,000 round number is needed.
For now, we wait! ⏱️
📚 Always follow your trading plan regarding entry, risk management, and trade management.
Good luck!
All Strategies Are Good; If Managed Properly!
~Rich

SUAI/USDT NEW TOKEN : AI AGENT 5-10x?SUAI/USDT NEW TOKEN
This is a high-risk coin, which can show some possibilities in the coming time.
There is no data about this coin, and the only reason for checking is the first TA confirmation includes some trend following.
Can this coin gain to $0,08?
This is exactly what we are going to follow.
Never hold high-risk coins, but you can follow them with the right SL.
This coin is added at the mexc exchange
This is not trading advice, manage always the risk since crypto is risk full.

Bitcoin (BTC/USDT) 4H Analysis: Critical Support Test –(caption)🚀 Bitcoin (BTC/USDT) 4H Chart Analysis (Feb 2, 2025) 📊
🔍 Key Observations:
1️⃣ Strong Support Zone (Red Box) 🛑
BTC is currently testing the $98,000 - $99,000 support zone.
This level has previously acted as a demand area, meaning buyers might step in.
2️⃣ 200 EMA (Exponential Moving Average) Resistance (Red Line) 📉
The 200 EMA at $100,718 is acting as dynamic resistance.
A break and close above this level would indicate bullish strength.
3️⃣ Key Resistance Levels 🚧
$100,718 (200 EMA Resistance)
$102,884 (Major Horizontal Resistance)
If price breaks these levels, next targets: $104,000 - $106,000.
4️⃣ Key Support Levels 🛠️
$98,000 - $99,000 (Current Demand Zone)
$90,000 - $89,184 (Next Major Support Below)
📈 Possible BTC Price Scenarios:
✅ Bullish Case (Price Bounces from Support) 🟢
If BTC holds above $98,000 - $99,000, a move toward $102,884 and higher is possible.
Breaking above $102,884 could trigger a rally toward $104,000 - $106,000.
Watch for volume increase & bullish candlestick confirmation.
❌ Bearish Case (Break Below Support) 🔴
If BTC breaks below $98,000, we could see a drop to $90,000 - $89,184.
A break below $90,000 could lead to further downside toward $88,000.
Watch for strong selling pressure & breakdown candle.
📊 Final Thoughts: BTC at a Critical Level!
🚨 Decision Point: BTC is at a key support level—will bulls step in, or will bears take control?
🔹 For Bulls: Need to reclaim $100,700+ for bullish continuation.
🔹 For Bears: Losing $98,000 could open the door for a drop toward $90,000.
👀 Keep an eye on price action & volume for the next big move!
🔥 What’s your bias? Bullish 🚀 or Bearish 📉? Let’s discuss!

ADA/USDT RECOVERY TIMEADA/USDT RECOVERY TIME
There is good chance that Ada/usdt will return to up 1 USD level

XAUUSD TODAY'S MAPPING IN 4H TF Hello Guy's Welcome To Another Day Of TRADING
Here we are mapping chart of XAUUSD ( GOLD ) in 4-Hour TF
This chart shows the price of gold (XAUUSD) over time. The price is moving in an upward trend (light blue channel).
Current Situation: The price recently dropped but is near a strong support area (gray zone).
Prediction: If the price stays above this support, it might bounce back up and continue rising.
Risk: If it falls below the support zone, the trend could change.
Basically, the idea is that gold might go up again after a small dip, but if it breaks below support, the trend could reverse.


EURUSDA trend it may or may not respect it but I only try my Tools should it respect my tool or my strategy is wrong that what am into it

SHORT SILVER (XAGUSD) Based on Trend Exhaustion & Mean ReversionThe line-work pretty much spells it out ...
Not shown are the pitchforks that generated some of the trendlines. The Resistance/Support Channel is derived from the same. The AVWAP establishes the "horizontal" (i.e. "momentary) component of the range, while the diagonals establish the "arguably more reliable"trading range. The anchored Volume Profile lends further corroboration.

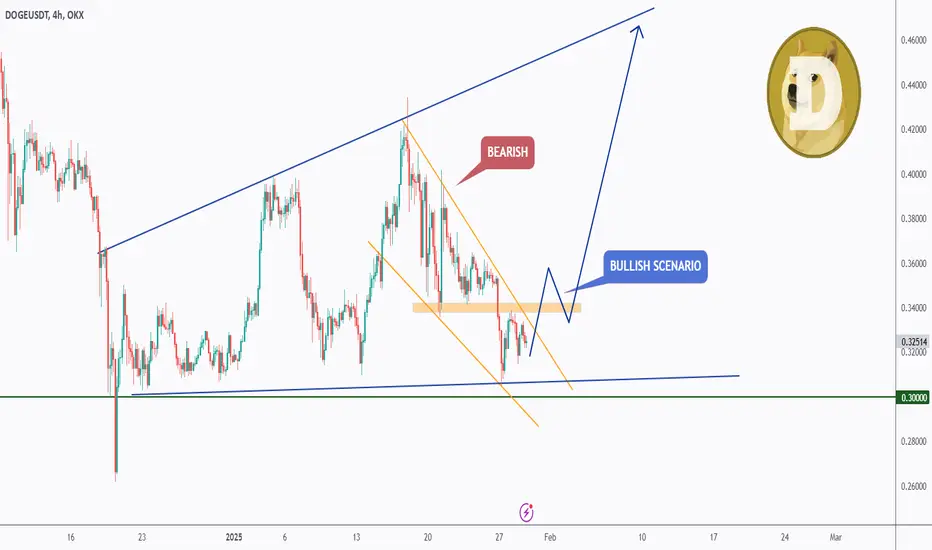
DOGE - DOGS vs BEARSHello TradingView Family / Fellow Traders. This is Richard, also known as theSignalyst.
📈 DOGE has been in a correction phase trading within the falling wedge pattern marked in orange.
🏹For the DOGS (bulls) to take over, and start the next impulse movement towards the upper bound of the blue wedge, a break above the last high marked in orange is needed.
For now, we wait! ⏱️
📚 Always follow your trading plan regarding entry, risk management, and trade management.
Good luck!
All Strategies Are Good; If Managed Properly!
~Rich
BULLISH ON $LINK as potential front runner for Alt of 2025?I know that’s a BIG STATEMENT but I do see merit here. ChainLink is a very powerful network with its capability’s.
Anyway the idea is simple the first circle's purple green yellow all smaller to larger are same as the right side but the last yellow circle you see only 1/6th so if the rim. All this is hard to make out when zoomed in on a long frame chart so it was easiest way and I added pitch fork to give the over-all tend-line with the fork set to the last trend change. For a more realistic outlook which is still FUCKING INSANE! “”IF IT CAME OR COMES TRUE!”” I will see when I look at this accounts ideas ain 1-10 years and to holy shit I actually owned that..!?? Haha
Alright THIS IS WHY I AM SO BULLISH ON BITCOIN I MEAN LINK! lol CRYPTOCAP:BTC WILL PULL CRYPTOCAP:LINK ID OWN BOTH JUST A IMO.
ALSO MOT FINACIAL ADVICE I AM NOT FINANCIAL ADVISOR OR STUDY FINANCE SO I ONLY TRADE WHAT I KNOW WHORKS AND SHARE WITH SOME PEOPLE BUT THIS WONT BE THE SAME ON ANOTHER TRADE AS IT ALWAYS CHANGES SO TRADE YOUR OWN STRATEGIES!
Below is the reason I own and will continue to HODL CRYPTOCAP:LINK #ChainLink
Chainlink ( CRYPTOCAP:LINK ) has as a decentralised oracle network that connects smart contracts with real-world data, APIs, and traditional banking systems. It’s absolutely next level and NEW businesses or entrepreneurs will want to build on or use the chain link blockchain to do business maybe just pay people or for BONUS salary or even a “second option” to “Superannuation” or CRYPTOCAP:BTC will do so for first time under Trump administration or a the least I have heard this from a random but human source.
Anyway so since blockchains cannot access external data on its own, Chainlink acts as a bridge, enabling smart contracts to execute based on real-world events, such as price feeds, weather data, or even sports scores.
For users being solo or business, Chainlink enhances most (if not all) blockchain applications by providing reliable and tamper-proof data, ensuring decentralised finance (DeFi) platforms, NFT projects, and other Smart Contract-Based services function accurately and securely. This reduces reliance with any centralised data providers, increasing transparency and trust amongst the entire user base and anyone who chooses to look on the chainlink block explorer.
For big company’s Chainlink offers a secure way to integrate blockchain technology without overhauling existing digital infrastructure. Businesses can leverage its oracles to automate processes, improve efficiency, and access new blockchain-based financial products. It enables smart contracts to be used in insurance, gaming, supply chain management, and more.
The benefits of Chainlink include its decentralized nature, security, and widespread adoption across major blockchain projects. However, drawbacks include potential scalability concerns, reliance on node operators for data accuracy, and competition from other oracle solutions. Despite these challenges, Chainlink remains the dominant oracle provider in the crypto space, powering many DeFi applications.
Now that there wasn’t me that’s a disc rip took of Link. This is why I BELIEVE it’s a contender FOR 2025 Altcoin of the year or at minimum top 5…! Heck it is just following CRYPTOCAP:BTC little bit of CRYPTOCAP:ETH moves it. Depends.. I just think the MARKET NOW is about to go KAPUT AND BE TRIAL FOR THSOE WHO ARE HOLDERS AND WHO ARENT. This is one of my final warnings.
It will happen the market is way over priced. It may SEEM not but it is and mathematically as well. So we need to be careful with “MEMES” always another threat which is so stupid people still fall for the Twitter or telegram or Instagram image of some random LOGO animal and name with a $ ticker so it seem “Legit” cut so many new people don’t know it’s easy to make a meme coin and has been for years now. It’s that no one knew or no one wanted to know and didn’t learn it and it wasn’t idealised by the ”masses” to look at. I mean even the church or the royal family’s ITS NEW for them and this is the whole thing with cryptocurrency even JUST CRYPTOCAP:BTC AND that’s why we say “JUST Bitcoin” because anything else HAS YET TO BE ADVERTISED largely on a world wide scale like bitcoin on the Bitcoin network. Notice the lower b and upper B single word bitcoin is reference to the coin I or you own. Or can mine then the Bitcoin network or even Bitcoin references the Bitcoin network.
Just for any future reference if it’s a book or something you will get it ;)

SHORT META Ahead of Earnings Report Based on Insider Selling"Meta Platforms Insider Sold Shares Worth $22,132,922"
Mark Zuckerberg, 10% Owner, Director, Chair of Board and Chief Executive Officer, on January 15, 2025, sold 35,921 shares in [eta Platforms. Following the Form 4 filing with the SEC, Zuckerberg has control over a total of 353,696 shares of the company, with 353,696 controlled indirectly.
Jennifer Newstead, Chief Legal Officer of Meta Platforms sold 905 shares of Class A Common Stock on January 14, 2025, at a price of $604.54 per share, totaling $547,108. Following the transaction, Newstead directly owns 31,105 shares of Meta Platforms.
Jennifer Newstead, Chief Legal Officer of Meta Platforms, sold 905 shares of Class A Common Stock on January 21, 2025, at a price of $618.0 per share, totaling $559,290. Following the transaction, Newstead directly owns 30,200 shares of Meta Platforms.
The sales were conducted under a Rule 10b5-1 trading plan adopted on November 30, 2023.
Olivan Javier, Chief Operating Officer of Meta Platforms, sold 413 shares of Class A Common Stock on January 21, 2025, at a price of $618.0 per share, totaling $255,234. Following the transaction, Javier directly owns 16,275 shares and indirectly owns 95,287 shares through various entities.
The sale was conducted under a Rule 10b5-1 trading plan adopted on August 30, 2023.

US500 - Short-Term Pain!Hello TradingView Family / Fellow Traders. This is Richard, also known as theSignalyst.
📈US500 has been in a correction phase and it is currently approaching the lower bound of the blue channel.
Moreover, the blue zone is a strong demand and structure.
🏹 Thus, the highlighted blue circle is a strong area to look for buy setups as it is the intersection of structure and lower blue trendline acting as a non-horizontal support.
📚 As per my trading style:
As #US500 approaches the blue circle, I will be looking for bullish reversal setups (like a double bottom pattern, trendline break , and so on...)
If the blue intersection is broken downward, a deeper correction towards the green intersection would be expected.
📚 Always follow your trading plan regarding entry, risk management, and trade management.
Good luck!
All Strategies Are Good; If Managed Properly!
~Rich

BTC/USDT THE WAY TO 122KBTC/USDT THE WAY TO 122K
There is high chance we will see building trend for BTC

SWFTC/USDT PRICE PREDICTION 2025 $0,12 (Blockchain swift)SWFTC/USDT PRICE PREDICTION 2025
Means for long-term follow, and where the possibility is for this coin 2025
The best way of volume entering is in steps.
Depending on the 2025 protection for this coin, we expect this is a good chance this swift system for blockchain can gain over $0,12
We already know the real swift where billions of transactions going, this one means for the blockchain tech.
How more time the coin stays stable and holding levels, how better it is for the coming volume spike.
This update will stay a prediction, do always your study and manage the risk.
Expect nothing from the market, but more see the possibilities.

VSA Rays: Mastering the Art of Predicting Future Price MovementsThe cryptocurrency PUFFER/USDT.P has captured our attention today as it flirts with a critical moment of decision. Currently trading at $0.5659, the price reflects a staggering 44% deviation below its all-time high of $1.0122, achieved just 50 days ago. Yet, it has also soared over 138% from its absolute low, a testament to its volatility and potential for rapid moves.
With a Relative Strength Index (RSI) hovering near a neutral 50, and buy volume patterns increasingly dominant over the past 24 hours, the market appears to be in a state of consolidation. The Moving Average 50 (MA50) at $0.5752 suggests minor overhead resistance, while psychological resistance levels are forming near $0.5961, possibly triggering the next rally.
Fundamentally, macroeconomic whispers of liquidity adjustments and renewed interest in altcoin markets are setting the stage for a bold shift. The big question remains: Is this your chance to ride the wave up, or will the bears claw back dominance at this critical threshold? For both traders and investors, the stakes couldn't be higher. The coming days will determine whether PUFFER/USDT.P’s momentum builds into a breakout or fades into retracement.
Are you ready for the ride? The clock is ticking, and this could be your chance to capitalize on a decisive market move. Stay tuned for our detailed analysis on key levels and patterns shaping this opportunity.
PUFFER/USDT.P Roadmap: Decoding the Patterns for Success
Understanding the flow of market movements is crucial for both traders and investors. Here’s a detailed roadmap of the key patterns recently observed in PUFFER/USDT.P, using historical data to confirm their validity and align with anticipated price directions.
January 25, 2025 – VSA Manipulation Buy Pattern 4th
Direction: Buy
Trigger Point: Low of the last 3 bars ($0.5514)
Outcome: The market closed slightly higher at $0.5564, hinting at a bullish impulse. This aligns with the main direction, as the next pattern confirmed upward movement to a high of $0.5777. This is a textbook pattern execution, showing strong buyer momentum.
January 26, 2025 – Increased Buy Volumes
Direction: Buy
Trigger Point: Open price ($0.5628)
Outcome: This pattern delivered as expected, with a close above the open at $0.5768. The immediate next high of $0.5777 supports this buy direction, emphasizing consistent buyer dominance.
January 25, 2025 – Increased Sell Volumes (Skipped)
Direction: Sell
Trigger Point: High of the last 3 bars ($0.6345)
Outcome: Contrary to the sell direction, subsequent price action leaned bullish. This pattern did not trigger effectively, and its impact is minimal in the broader roadmap.
January 24, 2025 – VSA Buy Pattern Extra 1st
Direction: Buy
Trigger Point: Not applicable
Outcome: The market moved consistently higher, with the high extending to $0.6112 shortly after. This pattern highlighted the continuation of a buying trend, supported by increasing volume and a steady climb.
January 22, 2025 – Sell Volumes Take Over (Skipped)
Direction: Sell
Trigger Point: Low of the last 3 bars ($0.5873)
Outcome: While sell volumes showed a momentary dip to $0.5873, the market rebounded quickly, invalidating the sell direction and confirming a persistent bullish bias.
January 23, 2025 – Buy Volumes Take Over
Direction: Buy
Trigger Point: Open price ($0.6024)
Outcome: The price continued upward to $0.6094, marking this as a clean execution of a bullish pattern. Traders who spotted this transition capitalized on the trend.
Key Takeaways from the Roadmap
Bullish patterns like VSA Buy Pattern 4th and Buy Volumes Take Over consistently outperformed, confirming strong market optimism. Sell patterns were largely invalidated, indicating underlying buyer control over the asset during the observed period. Trigger points proved reliable markers for entry, with clear follow-through seen in consecutive highs.
This roadmap demonstrates how understanding pattern execution and aligning with validated directions can significantly enhance trading success. Watch for future VSA Buy Patterns—they've consistently marked golden opportunities for upward momentum. Stay sharp, and ride the trend!
Technical & Price Action Analysis: Key Levels to Watch
When it comes to trading, knowing your levels is half the battle. Below are the critical support and resistance zones for PUFFER/USDT.P, straight from the charts. If these levels fail to hold, you can expect them to flip and act as resistance in the future. Mark these on your radar—miss them at your own risk!
Support Levels
0.5201 – Your first line of defense; a break below could open the door to further downside.
0.2934 – A deeper support level that traders should keep an eye on if the price dives lower.
Resistance Levels
0.5961 – The immediate overhead barrier. Bulls need to clear this for any meaningful push higher.
0.6934 – A higher resistance zone that could attract sell-side interest.
0.7277 – A strong ceiling to watch, marking the upper range of current price action.
0.8881 – A psychological level that’s likely to be a battleground for bulls and bears alike.
Powerful Resistance Levels
1.0122 – The absolute high. Breaking and holding above this level would signal a major trend reversal.
What Happens If These Levels Fail?
If support levels crumble under selling pressure, they’ll likely become resistance as sellers defend their positions. The same goes for resistance—if bulls break through, it flips to support, creating a solid base for further upward momentum. Keep these levels in mind to navigate the chop and make informed decisions in this dynamic market.
This is your roadmap to the action—stay sharp, and let the levels guide your trades!
Trading Strategies Using Rays: From Concept to Actionable Scenarios
The Rays from the Beginning of Movement concept provides a systematic approach to predicting price reactions based on Fibonacci-based geometrical rays. These rays, combined with dynamic factors like moving averages, offer traders a reliable method to identify high-probability trade setups. Below, we outline the framework and suggest two scenarios—optimistic and pessimistic—to align with potential market conditions.
Concept of Rays in Action
Fibonacci Rays and Their Purpose: Each ray defines key dynamic levels derived from the beginning of the price movement. They help map the probable path of the price and identify zones for potential reversals or continuations.
Dynamic Factors: Moving averages (e.g., MA50, MA100, MA200) act as secondary confirmation tools. When price interacts with a ray and aligns with a moving average, the probability of a valid move increases.
Actionable Levels: Traders focus on interactions between rays, moving averages, and VSA patterns on the chart. After a confirmed interaction, the price typically moves from one ray to the next, presenting opportunities for profitable trades.
Optimistic Scenario: A Breakout with Momentum
Initial Interaction Zone: $0.5752 (MA50)
First Target: $0.5862 (MA100, next ray level)
Second Target: $0.6272 (MA200, upper ray boundary)
Third Target: $0.6468 (Extended ray, potential continuation)
Commentary: In this scenario, the price demonstrates bullish momentum after interacting with the MA50 and first Fibonacci ray. Buyers take control, driving the price to subsequent ray levels.
Pessimistic Scenario: A Controlled Decline
Initial Interaction Zone: $0.5752 (MA50)
First Target: $0.5201 (Key support level)
Second Target: $0.2934 (Lower ray boundary)
Third Target: $0.2375 (Absolute low)
Commentary: Here, the price fails to sustain above the MA50, leading to a downward interaction with Fibonacci rays. Sellers dominate, targeting progressively lower levels.
Potential Trade Setups Based on Ray Interactions
Bullish Entry: After price confirms an upward bounce from $0.5752, enter long, aiming for $0.5862 (first target). Place a stop-loss below $0.5730 to manage risk.
Bearish Entry: If the price rejects $0.5752, consider a short position targeting $0.5201 with a stop-loss above $0.5770.
Breakout Trade: Watch for a breakout above $0.5862 with strong volume. Enter long with targets at $0.6272 and $0.6468.
Range Trade: If the price oscillates between $0.5752 and $0.5862, use the range to buy near support and sell near resistance.
Final Notes
The combination of Fibonacci rays and moving averages creates a robust system for identifying dynamic trade zones. Remember, trades should only be entered after clear interaction and validation from the rays and dynamic factors. Whether the market trends bullish or bearish, these scenarios provide a clear framework for traders to follow and adapt as conditions unfold.
Your Turn to Join the Conversation
Hey traders and investors! Let’s make this space interactive. If you’ve got questions about the analysis, specific levels, or just want to dive deeper into the strategy—drop them right in the comments. I’ll be happy to answer and discuss with you.
If you found this analysis helpful, don’t forget to hit Boost and save the idea to revisit later. Watching how price reacts to these levels is the best way to learn and grow as a trader. Remember, understanding entry and exit points is key to consistent success.
For those interested, my proprietary indicator automatically maps out all the rays and levels you see here. It’s available privately, so if you’re curious about using it, feel free to send me a message directly.
Have a specific asset in mind? I’m open to providing analysis! Some ideas I’ll post here for everyone to benefit from, and for others, we can discuss more personalized setups. Whether it’s public or private, we can figure out the best approach together.
Lastly, don’t forget to follow me here on TradingView. This is where I post all my insights and updates, and I’d love to have you as part of my trading community. Let’s keep learning and growing together—one chart at a time. 🚀

XAUMO: The Ultimate Multi-Timeframe Gold Analysis ReportXAUMO: The Ultimate Multi-Timeframe Gold Analysis Report
Period: January 27 – February 2, 2025
📊 Daily Chart (Long-Term Trend)
🔍 Ichimoku Analysis:
• Clouds (Kumo):
• Thick Kumo ($2,744-$2,752) providing strong long-term support.
• Future Kumo: Steep bullish slope with (Senkou Span A > Senkou Span B), reinforcing the bullish trend.
• Tenkan/Kijun (TK/KS) Crosses:
• Type of Cross: Bullish cross above the Kumo.
• Support Levels:
• Tenkan ($2,774): Dynamic short-term support.
• Kijun ($2,761): Key support during pullbacks.
• Chikou Span:
• Positioned above price and Kumo, confirming strong bullish control.
• Stable slope, suggesting minor consolidation.
📈 Regression Channel Analysis:
• Price is moving within an upward channel, with resistance near $2,785-$2,790, signaling potential overbought conditions.
🔗 Support and Resistance Levels (VRP):
• POC: $2,771 (Pivot point for accumulation).
• VAH: $2,785 (Supply zone).
• VAL: $2,756 (Demand zone).
📦 Supply and Demand Zones:
• Supply: $2,785-$2,790.
• Demand: $2,744-$2,752.
⏳ Sushi Kinko Cycles:
• 26-Period Cycle: Confirms bullish continuation toward $2,800.
📌 Tradeable Levels:
• Upside: $2,785-$2,810 (Fibonacci Extension 161.8%).
• Downside: Below $2,756 targeting $2,740 (VWAP).
⏳ 4-Hour Chart (Swing Trading)
🔍 Ichimoku Analysis:
• Clouds (Kumo):
• Moderate thickness supporting price at $2,744-$2,752.
• Steep bullish slope confirming momentum.
• Tenkan/Kijun (TK/KS) Crosses:
• Bullish cross above the Kumo, reinforcing the trend.
• Key Supports:
• Tenkan ($2,774): Immediate support.
• Kijun ($2,761): Major support.
• Chikou Span:
• Positioned above price and Kumo, signaling strong bullish pressure.
• Upward slope, enhancing bullish momentum.
📦 Supply and Demand Zones:
• Supply: $2,785-$2,790.
• Demand: $2,744-$2,752.
⏳ Sushi Kinko Cycles:
• 9-Period Cycle: Minor pullback toward $2,771.
• 26-Period Cycle: Signal for a move toward $2,800.
📌 Tradeable Levels:
• Upside: $2,785-$2,810.
• Downside: $2,756-$2,744.
⏳ 1-Hour Chart (Intraday)
🔍 Ichimoku Analysis:
• Clouds (Kumo):
• Weak clouds with support near $2,774-$2,771.
• Moderately bullish slope.
• TK/KS Crosses:
• Tenkan ($2,777): Immediate support.
• Kijun ($2,773): Key support level.
📦 Supply and Demand Zones:
• Supply: $2,785-$2,790.
• Demand: $2,773-$2,765.
📌 Tradeable Levels:
• Buy: $2,773 targeting $2,785.
• Sell: Rejection at $2,785 targeting $2,773.
⏳ 30-Minute Chart (Scalping)
🔍 Ichimoku Analysis:
• Thin clouds supporting upward momentum.
• Tenkan ($2,777): Immediate support.
• Kijun ($2,773): Major support for scalping.
📌 Tradeable Levels:
• Buy: $2,773 targeting $2,785.
• Sell: Rejection at $2,785 targeting $2,773.
🔑 Summary:
• Bullish Bias: Above $2,785 targeting $2,800-$2,810.
• Bearish Bias: Below $2,756 targeting $2,740.
• Pivot Point: $2,771 (POC).
📌 Session Insights:
• Tokyo: Scalping at $2,773.
• London: Rejection at $2,785 or breakout opportunities.
• New York: Breakout above $2,785 or correction toward $2,771.
🔗 A blend of analytical tools for a precise and balanced trading strategy.

ETH - Super bullish inverse H&SCould we be looking at a super bullish scenario of an inverse head and shoulders for ETH? It looks ugly, but could work if the neckline is decisively breached. If it is, we could be looking at some serious gains for ETH. This isn't meant to be fake news or an attempt to gain followers, it's all on the pile of possibles until made improbable. So, we'll keep our fingers crossed and look for higher highs. Until then, follow for more.

BTC - Steady... steady... almost there!BTC in the short term is looking very much like a WXYXZ is forming. We should therefore see a low, which could temporarily breach the lower trend line. In fact, it'd make for a bullish signal if it did - so watch this carefully. If we see it ping back within the channel, then the formation will likely complete. Next thing we'll need to look for us the breakthrough of the upper trend line. This would then lead to higher higher and the completion of wave 5 of 1 which we have long been looking for. I'm not going to take any actions here until either trend line is decisively broken leading to a trend change. Looks good though, follow for more.

Complete analysis and review of Ethereumhello friends
We came with Ethereum analysis
As you can see, the price reached good support after a drop and was able to grow.
Now that the price has compressed and created a triangle for us, we are facing two scenarios:
1_ According to the beginning of the upward trend, succeed in breaking the ceiling and move to the specified goals.
2_ The price should fall from here until the support area is determined and then it starts to climb.
In our opinion, scenario 1 is more tolerant.
*Trade safely with us*

FWOGUSDT: Approaching the Turning Point – What’s Next?FWOGUSDT is trading at $0.12006, hovering just above its absolute low of $0.11783, established only hours ago. This marks a staggering -84.6% retreat from its absolute high of $0.78189, reached just 72 days prior. With RSI14 dipping to 29.42, the asset is entering oversold territory, raising the stakes for a potential reversal or a continuation of the bearish trend.
A surge in sell volume, as confirmed by recent VSA patterns, highlights increasing market activity amidst uncertainty. The asset is also testing critical resistance at $0.13946 while struggling to break above the 50-day moving average of $0.15193, emphasizing the importance of this consolidation phase.
Is the market setting the stage for a bullish rebound or bracing for deeper lows? With macroeconomic factors such as volatile liquidity conditions and heightened market sentiment, the next move could offer opportunities for both traders eyeing quick scalps and investors seeking long-term positioning.
The big question remains: Are you ready to seize the moment, or will this opportunity pass you by? Stay tuned as we dive deeper into the technicals and strategies for this critical juncture.
Roadmap: Tracing FWOGUSDT’s Path Through Pattern Dynamics
FWOGUSDT has had a whirlwind of activity in recent trading sessions, as highlighted by a sequence of critical patterns. Below, we’ve broken down the roadmap of these patterns in order of their emergence, filtering only the ones that delivered accurate directional moves based on the previous pattern’s main direction.
Pattern 1: Increased Sell Volumes (Jan 21, 18:00 UTC)
The market initiated a significant sell wave, closing at $0.21192 after an open of $0.22732, marking a notable drop. The main direction was clearly bearish, and this pattern laid the groundwork for subsequent sell-offs.
Pattern 2: Buy Volumes Takeover (Jan 23, 20:00 UTC)
Despite a brief bullish attempt that pushed the price to a high of $0.16481, the market turned back to bearish territory, aligning with the previous sell-off. This confirms the direction set earlier, showing the strength of sellers.
Pattern 3: VSA Buy Pattern Extra 1st (Jan 25, 00:00 UTC)
Here, the market attempted a reversal, with a closing price of $0.12599 and a high of $0.13648. While buyers showed strength, the follow-through failed as the price closed lower in subsequent sessions. This indicates the struggle of bulls to reclaim control.
Pattern 4: Increased Sell Volumes (Jan 25, 02:00 UTC)
The most recent sell-off, aligning perfectly with the earlier bearish direction, confirms the dominance of sellers. With a low of $0.11783, FWOGUSDT reached its absolute bottom. This marks a critical juncture for traders.
Key Takeaways
The bearish trends dominated, with multiple sell patterns confirming the overall downtrend.
Bullish patterns showed potential but failed to break critical resistance, indicating weak momentum.
The most recent bearish breakout to $0.11783 highlights the market’s vulnerability at these levels.
What’s Next?
Investors and traders should watch for sustained price action at critical support zones. Will the bulls finally stage a comeback, or is more downside ahead? Follow the roadmap to stay in tune with the market's rhythm!
Technical & Price Action Analysis: Key Support and Resistance Levels
When it comes to navigating the FWOGUSDT price action, the key levels below are your bread and butter. Let’s break it down:
Support Levels
These zones are where buyers are likely to step in. If the market doesn’t respect these, expect them to flip into resistance faster than you can blink:
$0.11783 – This is the absolute low. If broken, we’re diving into uncharted waters.
$0.29444 – A strong psychological area to watch if prices stage a rally from current levels.
Resistance Levels
Here’s where sellers are holding their ground. Break these, and the bulls might just get the upper hand:
$0.13946 – The first line of fire for any upward push.
$0.19064 – A significant hurdle for medium-term bulls.
$0.23757 – Beyond here, the market might just start cooking.
$0.25695 – The final boss level for this structure.
Powerful Support Levels
These are your safety nets if the market wobbles. But if they give way, you’re looking at resistance zones in the making:
$0.29444 – Not just a level, but a fortress for the bulls to defend.
Powerful Resistance Levels
While none were detected in this cycle, keep an eye on the levels above as potential magnets for price.
Pro Tip: If these levels don’t play out, the market could be flipping the script, turning support into resistance or resistance into support. Keep your eyes peeled and trade smart!
Trading Strategies Using Rays: Optimistic and Pessimistic Scenarios
The "Rays from the Beginning of Movement" concept provides traders with dynamic levels derived from Fibonacci principles. These rays form a predictive framework, guiding price action from one ray to the next. Interactions between rays and moving averages (MAs) further confirm key market zones. Let’s dive into the strategy.
Concept Overview
Rays and Fibonacci: Rays are constructed at precise angles that correlate with the start of a trend.
Dynamic Levels: The rays adjust to new patterns, providing an updated roadmap for price movement.
Key Interaction Points: Trade entries are based on price reactions to rays, confirmed by interaction with MAs.
Directional Flow: Price moves from one ray to the next, making each ray a potential trade target.
Scenarios and Strategies
Optimistic Scenario
This assumes the price successfully interacts with a ray, confirming bullish momentum.
Initial Entry Point: Interaction at support ray near $0.11783 (absolute low).
First Target: $0.13946 (next ray and first resistance level).
Second Target: $0.19064 (medium-term ray resistance).
Confirmation Tools: Price above MA50 ($0.15193) signals upward momentum.
Pessimistic Scenario
In this scenario, the price interacts with a resistance ray and begins to reverse, confirming bearish sentiment.
Initial Entry Point: Rejection at resistance ray near $0.13946.
First Target: $0.11783 (absolute low and ray support).
Second Target: $0.29444 (long-term powerful support zone, now acting as resistance).
Confirmation Tools: Price below MA50 ($0.15193) reinforces a downward trend.
Suggested Trades
Bullish Trade Idea :
Enter long at $0.11783 after confirmation of ray support and MA interaction. First target $0.13946, with stop-loss below $0.11700.
Bearish Trade Idea :
Enter short at $0.13946 upon rejection. First target $0.11783, with stop-loss above $0.14000.
Scalp Trade Idea :
Trade between $0.13946 and $0.19064 for quick profits within the ray structure, confirming movement via the MA50.
Final Thoughts
Dynamic rays and MAs act as a dual system for identifying actionable trades. Always enter after a confirmed interaction and let the price move between rays for optimal profit opportunities. Adapt to new ray formations and keep an eye on volume surges for added confirmation. This strategy offers precision for both cautious and aggressive traders.
Your Feedback and Ideas Matter!
Hey traders, thanks for taking the time to explore this analysis! If you’ve got questions or ideas, don’t hesitate—drop them in the comments. I love seeing your thoughts and will do my best to respond to everyone.
If this idea resonates with you, hit Boost and save it to your favorites so you can revisit it later and track how the price moves along my levels. This is the cornerstone of successful trading—understanding the points where trades can be made with confidence.
For those curious about my indicator-strategy, it automatically plots all the rays and levels, simplifying your analysis. While it’s available privately, feel free to DM me if you’re interested in using it—I’m happy to share details.
Need a custom analysis for your favorite asset? Let me know in the comments! I’m open to doing some for free and posting them here, or working on something private if you’d prefer to keep your ideas exclusive. The rays work on any asset, and I can craft a personalized layout just for you.
And of course, if you’d like to see more of my work, follow me here on TradingView. This is where I post all my articles and strategies, so don’t miss out!
Trade smart, stay curious, and let’s keep the conversation going! 💬📊
