INJ - Injecting An Impulse 💉Hello TradingView Family / Fellow Traders. This is Richard, also known as theSignalyst.
📈 INJ has been overall bullish , trading within the flat wedge pattern in red.
Currently, INJ is in a correction phase, approaching the lower bound of the wedge.
Moreover, it is retesting a strong support at $31.5.
🏹 Thus, the highlighted blue circle is a strong area to look for buy setups as it is the intersection of the blue support and lower red trendline.
📚 As per my trading style:
As #INJ approaches the blue circle zone, I will be looking for bullish reversal setups (like a double bottom pattern, trendline break , and so on...)
📚 Always follow your trading plan regarding entry, risk management, and trade management.
Good luck!
All Strategies Are Good; If Managed Properly!
~Rich
Trend

EURUSD - Bearish Control Soon⏱Hello TradingView Family / Fellow Traders. This is Richard, also known as theSignalyst.
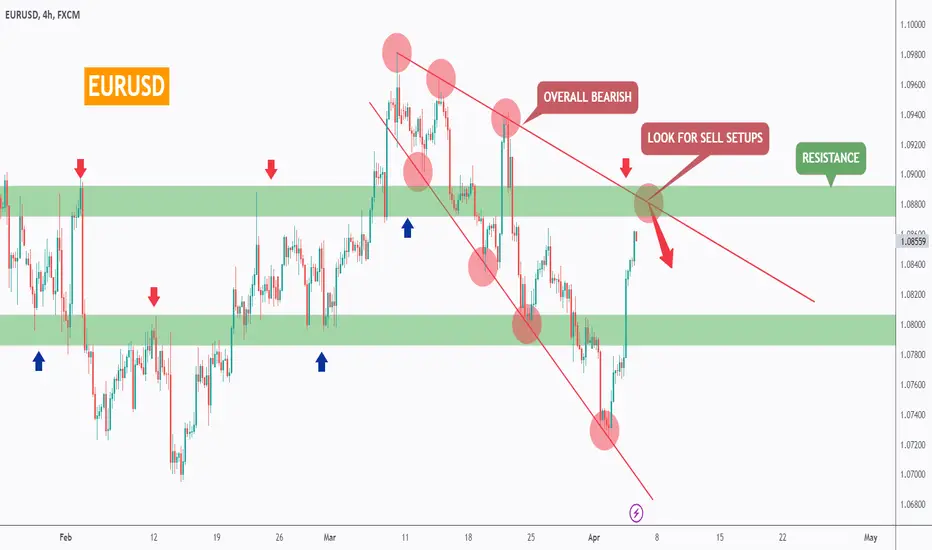
📈 EURUSD has been overall bearish , trading within the falling wedge pattern in red.
Currently, EURUSD is approaching the upper bound of the wedge acting as a non-horizontal resistance.
Moreover, it is retesting a strong resistance zone at 1.088 marked in green.
🏹 Thus, the highlighted red circle is a strong area to look for sell setups as it is the intersection of the green resistance and upper red trendline.
📚 As per my trading style:
As #EURUSD approaches the red circle zone, I will be looking for bearish reversal setups (like a double top pattern, trendline break , and so on...)
📚 Always follow your trading plan regarding entry, risk management, and trade management.
Good luck!
All Strategies Are Good; If Managed Properly!
~Rich
CKB NEW VOLUME INCREASEThank you for reading this update.
Depending on our study we see that CKB has a good chance of volume increase.
This updates depending on day trade, And the market should confirm with time the right market way.
#Nottradingadvice
#For Day traders take always profits when the market increase
#Expect nothing from the markets, but follow what it shows.

EUR/USD Week 14 Analysys/OutlookTime dive into the whirlwind that was Week 14 in the EUR/USD market.
Last week was nothing short of intense, with each trading day bringing its own set of surprises and challenges. Despite the rollercoaster ride, the overall price range remained relatively stable compared to the previous week. It's fascinating to see how the market dynamics played out amidst the volatility. When we look at the order book, it's clear that both buyers and sellers were actively engaged. Buyers were eager for lower prices, while sellers seemed content with slightly lower values for profits, compare to initial volume levels.
Now, let's talk about resistance levels. Bears had set up some formidable resistance in the order book, but as history has shown, Bulls have a knack for breaking through even the toughest barriers. Looking ahead, while we may not see significant changes in the overall price range, I anticipate some fluctuations within that range. It's all part of the ebb and flow of the market. On a longer-term basis, the market has shown remarkable stability since January 15th. It's a testament to the underlying trends that have been driving the market.
So, what does this mean for traders? Well, there's no one-size-fits-all answer, but strategies like grid trading and trend-following could prove fruitful. Of course, proper risk management and strategy testing are crucial. So, while last week may have been exciting, the name of the game is slow and steady profits. It's all about consistency in the trading world.

W NEW INCREASE VOLUMEThank you for reading this update.
Depending on our study we see that W has a good chance of volume increase.
This updates depending on day trade, And the market should confirm with time the right market way.
#Nottradingadvice
#For Day traders take always profits when the market increase
#Expect nothing from the markets, but follow what it shows.

ENA NEW INCREASE VOLUMEThank you for reading this update.
Depending on our study we see that ENA has a good chance of volume increase.
This updates depending on day trade, And the market should confirm with time the right market way.
#Nottradingadvice
#For Day traders take always profits when the market increase
#Expect nothing from the markets, but follow what it shows.

MUBI NEW INCREASE VOLUMEThank you for reading this update.
Depending on our study we see that MUBI has a good chance of volume increase.
This updates depending on day trade, And the market should confirm with time the right market way.
#Nottradingadvice
#For Day traders take always profits when the market increase
#Expect nothing from the markets, but follow what it shows.

Reversal Descending Triangle pattern in GODREJCPGODREJ CONSUMER PRODUCTS LTD
Key highlights: 💡⚡
📈 On 1 Day Time Frame Stock Showing Reversal of Descending Triangle Pattern.
📈 It can give movement upto the Reversal Final target of Above 1251+.
📈 There have chances of breakout of Resistance level too.
📈 After breakout of Resistance level this stock can gives strong upside rally upto Above 1370+.
📈 Can Go Long in this stock by placing a stop loss Below 1150-.

Pump Up the JamMonthly Chart of CBLS. Bullish! Little Island Reversal w./ a double bottom. Expecting to C higher monthly Close(s). Higher lows on each month.

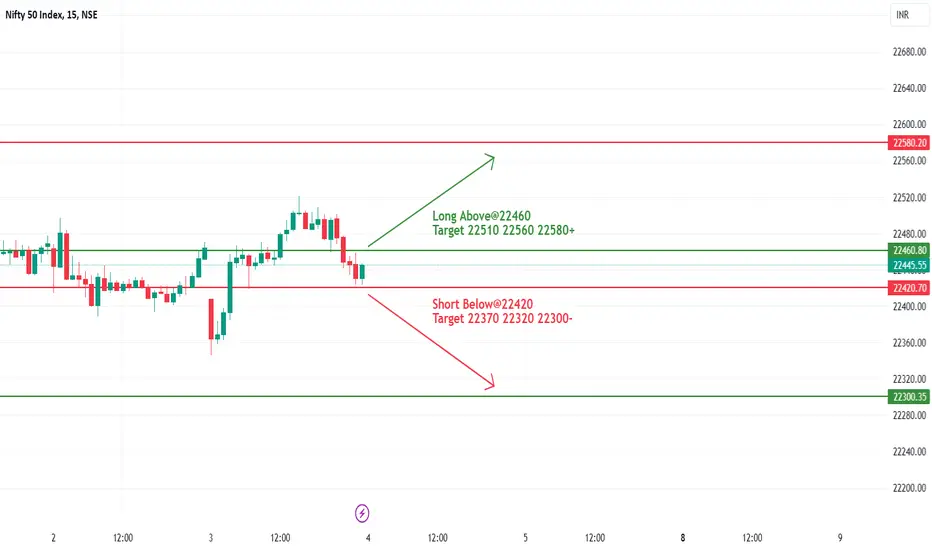
#NIFTY Intraday Support and Resistance Levels -04/04/2024Nifty will be gap up opening in today's session. After opening nifty sustain above 22460 level and then possible upside rally up to 22580 level in today's session. in case nifty trades below 22420 level then the downside target can go up to the 22300 level.
IOTX TREND BREAKIOTX has a good chance to break in the coming time since the IOTX has at this moment, is building a view that could show interesting results soon.
We will follow IOTX for the possibility of breaking in the coming times.

BTC enters the parabolic stage of the bullmarketPredicting the tops and bottoms of Bitcoin - in a macro sense - is not that easy. But some indicators can give us a clue or kind of sense of caution warning when to exit or enter the market.
One of them is the "MVRV Z" indicator. It is a chart indicator that uses blockchain analysis to identify periods where BTC is extremely over or undervalued relative to its "fair value".
Historically it has been very effective in identifying periods where market value is moving unusually high above realised value. It also shows when market value is far below realised value, highlighted by the green lines. Buying Bitcoin during these periods has historically produced outsized returns.
This chart indicator is generally useful for predicting Bitcoin price at the extremes of market conditions. It is able to forecast where price may need to pull back when the score enters the upper red hot periods and also when price may rally after spending time in the lower green band.
Historically it has picked major Bitcoin price highs to within 2 weeks.
So far BTC has done a great job holding in the middle value band. It's in the stage of taking the next leap breaking out of it to the upside completing the bullmarket, also referring to past historical breakouts which happenend in similar fashion after a long lasting bearmarket.

JTO NEW INCREASE VOLUMEThank you for reading this update.
Depending on our study we see that JTO has a good chance of volume increase.
This updates depending on day trade, And the market should confirm with time the right market way.

Gold is moving above $2,200...in this case (read-caption)Gold is moving above $2,200...in this case, it will head towards $2,300
Gold prices did not witness noticeable movements during these moments of trading today, Thursday, after they ended yesterday’s trading at record levels, with investors looking forward to more US economic data to obtain evidence of the course of monetary policy.
Ilya Spivak, head of global macro at Tastylive, said: “The Fed has signaled it wants to lower interest rates, and there are geopolitical risk concerns that remain in the markets around the wars going on right now, whether in Ukraine or in the Middle East, which is... Supports gold.
Spivak added: “Gold prices are range-bound most of the time this month, and a break above the current resistance level at $2,225 per ounce could send prices heading towards the $2,300 level.”
Like support and follow bundle of thanks for your love.

SELLI think EURUSD can be BEARISH down the red zone
we can enter to a SELL after the CONFIRMATION.
according to drawn TREND.

MANY CONFLUENCES IN REGARDS TO THE DOWNSIDE FAVOR- Previous liquidation of previous lows taken out
- Overall structure is bearish
- No sign of break of major previous highs
- No willingness to go higher
- FVG/In-balance on the way upwards---taking out minor
liquidity to then fall/die.
ETC, ETC.

MKR NEW INCREASE VOLUMEMKR shows a new volume trend which could be confirmed in the coming time.
We will follow MKR to see if it's able to confirm.
This is a basic daily trend where we check the confirmation possibility.

PENDLE BREAK TO UP $5 HIGH POSSIBLITYPENDLE showing on cycle trend important data for the high possibility to increase to up $5 in the coming time frames.
we will follow this to see if it can get confirmed.
The last data of this coin shows a high interest in the break trend.
Next time frames could be very important for the trend.

CEL ON BREAK POINT TO HIGH LEVELCEL seems to have made an important change in the trend that will be able to break with more than 30% in uptrend.
The volume of CEL looks interesting for the next break.

RVN NEW BREAK TRENDRVN seems to enter a new break trend which could get new confirmations with new time frames. we will follow the data in the coming time
This coin building a new volume, we will wait for the trend-building confirmation.
When we check it at large view we see important trend levels

Exxon Mobil Exxon Mobil is going up strong to the all time high,
Expecting strong reaction from that area,
Volume is going down in the last 2 3 weeks witch means bulls are getting weaker,
If we look into the valuation ratios , the company is getting overvalued,
If we look at the 10 Ma on weekly we can see that price is getting away from MA fast witch indicates that the company is getting overvalued quickly,
It will be interesting to see how price will react from that area when it goes up, But overall trend is bullish,

Boeing The company is on massive area of support, but technically the trend is still down and strong , momentum is down and strong too, next quarterly result will be crucial , if price breaks down it will go even further down , The company is not undervalued , but is getting there if you look closely into the valuation ratios. Volume is going down witch indicates that downtrend is losing power. Important weeks ahead for Boeing.

GBP/USD Analysis: Support Channel Breaks as Dollar Strengthens,GBP/USD Analysis: Support Channel Breaks as Dollar Strengthens, Retest of Demand Zone Imminent
The GBP/USD pair has experienced a significant shift in momentum as the support channel, marked by the crucial level of 1.28063, has been breached. This breach comes amidst a notable surge in the value of the US dollar, which has exerted downward pressure on the GBP pair.
Moreover, recent data indicates a pronounced strengthening of the dollar against various currencies, including the British pound. This strengthening has intensified the bearish sentiment surrounding the GBP/USD pair.
In light of these developments, market sentiment suggests that the GBP/USD pair is now poised for a retest of the demand zone, situated around the level of 1.25030. This zone represents a critical area of support where buying interest could potentially resurface, leading to a temporary halt or reversal of the downward movement.
Traders and investors are closely monitoring the price action around the demand zone for potential signs of bullish reversal or further downside continuation. Factors such as economic data releases, central bank statements, and geopolitical developments will likely play a crucial role in shaping the near-term trajectory of the GBP/USD pair.
Overall, the breach of the support channel coupled with the prevailing strength of the US dollar indicates a bearish outlook for the GBP/USD pair, with attention now turned towards the retest of the demand zone for potential trading opportunities.
