Trend

Gold - Correction Phase Extended!Hello TradingView Family / Fellow Traders. This is Richard, also known as theSignalyst.
📈 As per our latest Gold analysis, price rejected the $3,100 – $3,150 support zone and traded higher.
However, Gold is still in a correction phase, moving within a falling red channel.
This week, it has been rejecting the upper bound of the channel, reinforcing bearish pressure.
⛔ As long as the upper red trendline holds, the bears remain in control.
✅ For momentum to shift back in favor of the bulls, a clear break above the upper red trendline is needed.
📚 Always follow your trading plan regarding entry, risk management, and trade management.
Good luck!
All Strategies Are Good; If Managed Properly!
~Rich
Disclosure: I am part of Trade Nation's Influencer program and receive a monthly fee for using their TradingView charts in my analysis.

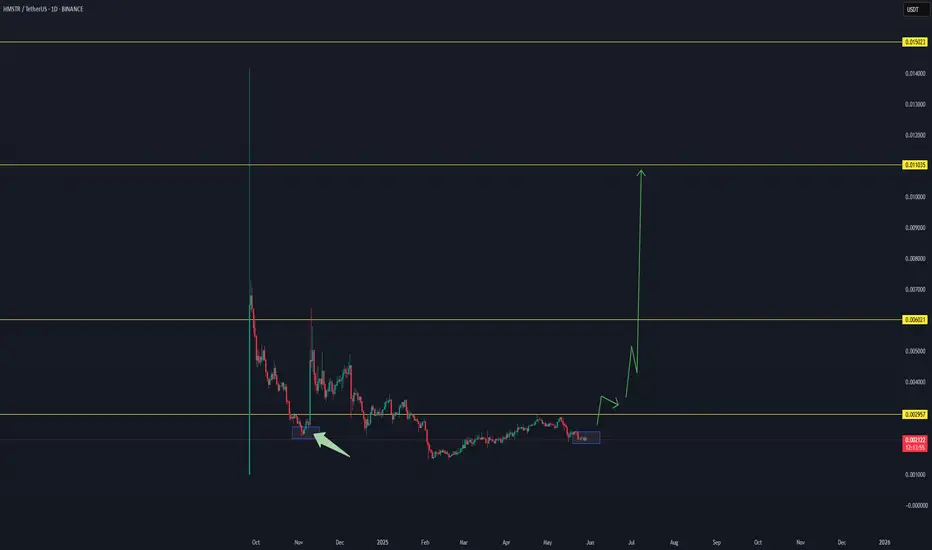
HAMSTER CAN EXPLODE TO THE MOON AS NEVER BEFORE..Depending on our study and trends, we expect with high chance that hamster is going to see a new volume in the upcoming time, which will allow this coin to increase to new levels.
These are our expected targets.
$0,0.0024
$0,006
$0,011
$0,015
This coin is at this moment in a stable time frame, and can build unexpectedly in the coming time a new break followed by a whale's increase in volume.
Time will tell if this coin will act as we expect.
There are some important reasons based on data that let us expect this coin is going to break, at last its a market, which has never 100% guarantee.
ETH - Long Anyway, Short-term and Long-term!Hello TradingView Family / Fellow Traders. This is Richard, also known as theSignalyst.
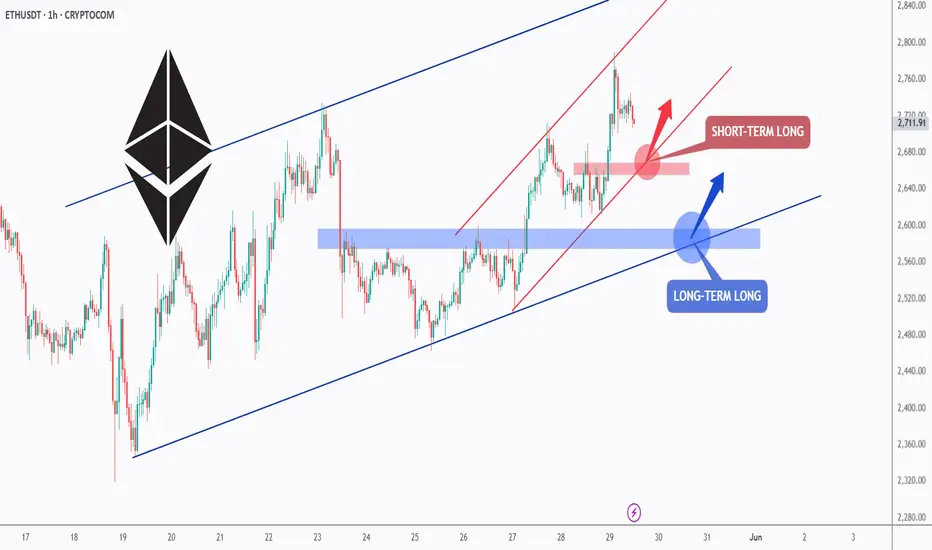
📈ETH has been overall bullish trading within the rising blue channel from a long-term perspective and within the rising red channel from a short-term perspective.
Moreover, the red and blue zones are strong support and structure!
🏹 Thus, the highlighted blue and red circles are strong areas to look for buy setups as it is the intersection of the lower zone(s) and trendline(s).
📚 As per my trading style:
As #ETH approaches one of the circles, I will be looking for bullish reversal setups (like a double bottom pattern, trendline break , and so on...)
📚 Always follow your trading plan regarding entry, risk management, and trade management.
Good luck!
All Strategies Are Good; If Managed Properly!
~Rich
GBPJPY - Bearish Control, Again!Hello TradingView Family / Fellow Traders. This is Richard, also known as theSignalyst.
📉As per our last GBPJPY analysis (attached on the chart), it rejected the upper red trendline and traded lower.
What's next?
GBPJPY is currently retesting the upper bound of the falling red channel again.
Moreover, the green zone is a strong structure and resistance.
🏹 Thus, the highlighted red circle is a strong area to look for sell setups as it is the intersection of structure and upper red trendline acting as a non-horizontal resistance.
📚 As per my trading style:
As #GBPJPY is around the red circle zone, I will be looking for bearish reversal setups (like a double top pattern, trendline break , and so on...)
📚 Always follow your trading plan regarding entry, risk management, and trade management.
Good luck!
All Strategies Are Good; If Managed Properly!
~Rich
Disclosure: I am part of Trade Nation's Influencer program and receive a monthly fee for using their TradingView charts in my analysis.

BTC - Let's Do It Again!!Hello TradingView Family / Fellow Traders. This is Richard, also known as theSignalyst.
📈 As per our last analysis (attached on the chart), BTC rejected the lower orange trendline and moved higher as expected! ✅
🔄 BTC is now retesting the lower trendline again, so we’ll be looking for new trend-following buy setups as long as the red structure at $105,000 holds!
📚 Always follow your trading plan regarding entry, risk management, and trade management.
Good luck!
All Strategies Are Good; If Managed Properly!
~Rich

HMSTR/USDT NEW BREAK ON WAYHMSTR/USDT has good chance to get a new break in the coming time frames, there are some trend data that shows that HMSTR/USDT has a good change for new time frame confirmation

S/USDT Potential UpsidesHey Traders, in today's trading session we are monitoring S/USDT for a buying opportunity around 0.4300 zone, S/USDT is trading in an uptrend and currently is in a correction phase in which it is approaching the trend at 0.4300 support and resistance area.
Trade safe, Joe.

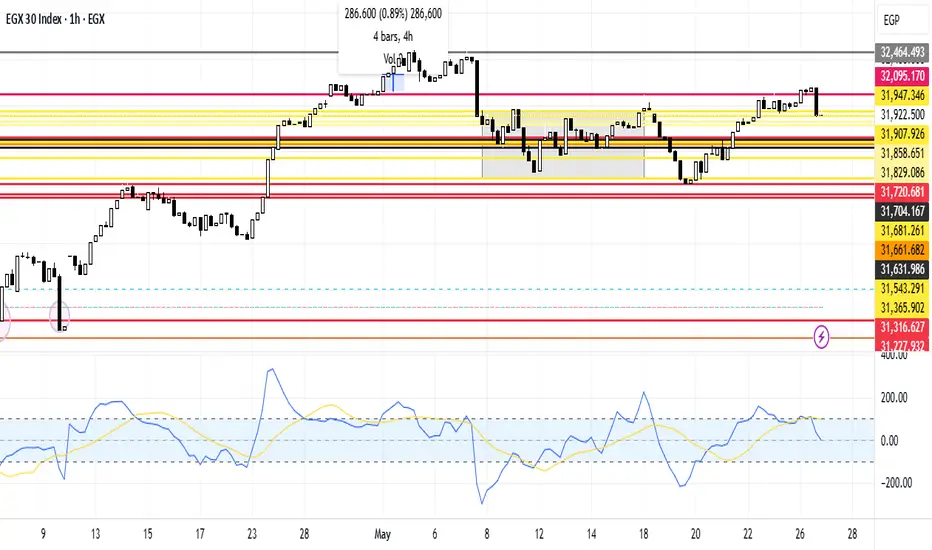
EGX30 Movement AnalysisEGX30 stock is currently in a higher region than before. Unfortunately it rebounded to the support line 31,907.926. In the case of continuing downward it's expected to reach the support line 31,858.651 then break the support line 31,829.086. In case of taking an upward trend, it is expected to breach the resistance line at 31,907.926 and then reach the resistance line at 31,947.346. And reach the third resistance line at 32,095.170 points.
CHESS.USDT NEW INCREASE ROUNDEAs a trader, it's important to follow the market and the unexpected trends.
CHESS/USDT shows a possibility for a new increase in the coming time frames, after the long-term breakdown.
Let's follow the data and see if this coin is able to increase as the chart shows.
interesting to follow for the coming time frames for new confirmations.
$0,10 is an important target that this coin could hit in the coming time.
If the cycle gets confirmed, this coin could go to $0,25 as a high target and $0,35 as a best target.
In trading, never expect instant results; the market goes as it needs to go.
Risk management is the key.

ETH - BBB - Bullish Building Block!Hello TradingView Family / Fellow Traders. This is Richard, also known as theSignalyst.
🏢 ETH Building Blocks:
📈 Short-Term Bullish:
ETH is currently bullish trading within the second floor in the shape of a rising channel marked in green.
As ETH retests the lower green trendline and $2,550 structure, we’ll be looking for short-term trend-following long setups!
📈 Long-Term Bullish:
For the bulls to remain in control medium-term and push towards the $3,000 mark, a break above the last major high at $2,750 is needed.
📉 Short-Term Bearish:
If the $2,550 structure is broken downward, ETH's momentum will be shifted from bullish to bearish leading to a correction phase towards the $2,300 support.
📚 Always follow your trading plan regarding entry, risk management, and trade management.
Good luck!
All Strategies Are Good; If Managed Properly!
~Rich

$SNOW $200 target, sooner than laterHello. Not much analysis here besides a monster gut feeling. NYSE:SNOW has earnings May 21. I’m looking to get in $200c for May 16 expiration. For some reason this name can’t scorch $200 and I believe it should. If NASDAQ:CRWD moves the way it does so can $SNOW. I think it’s made a strong support and mental level at $150. I was apart of the latest push to $180-$190 before its most recent earnings which jolted it from $150s to $180 AND it got sent back to that $150 to $160 level. I think this is a high conviction swing especially into earnings; premiums can go up off the IV.
NFA.
WSL.

BTC - New Impulse Soon!Hello TradingView Family / Fellow Traders. This is Richard, also known as theSignalyst.
📈 BTC has been bullish, trading within the rising channel marked in orange. 🟧
In a typical trend, corrections are usually bearish. 🔻
However, in BTC’s case, the correction phases marked in red are flat — a strong signal that the bulls are in control 💪 and not allowing the bears to trigger a classic pullback.
As long as BTC holds within the rising orange channel, we expect the next impulse phase to kick off soon 🚀 — aiming for the $115,000 round number. 🎯
This move will be confirmed once BTC breaks above the current flat correction zone marked in red. ✅
📚 Always follow your trading plan regarding entry, risk management, and trade management.
Good luck!
All Strategies Are Good; If Managed Properly!
~Rich

NEAR is here to stay!Hello TradingView Family / Fellow Traders. This is Richard, also known as theSignalyst.
After breaking above the falling wedge pattern, CBOE:NEAR has been overall bullish, trading within a rising broadening wedge 🔼 marked in blue and red.
📉 As it approaches the lower bound of the wedge — which perfectly intersects with the green support zone — we’ll be watching for short-term long opportunities 🎯.
From a long-term perspective, for the bulls to fully take control, a break above the $3.6 resistance is needed to confirm the next bullish wave 🚀.
📚 Always follow your trading plan regarding entry, risk management, and trade management.
Good luck!
All Strategies Are Good; If Managed Properly!
~Rich

USDCHF - Bulls Are Almost Ready! Are You?Hello TradingView Family / Fellow Traders. This is Richard, also known as theSignalyst.
📈USDCHF has been overall bullish trading within the rising channel marked in blue.
Moreover, the green zone is a strong support and structure!
🏹 Thus, the highlighted blue circle is a strong area to look for buy setups as it is the intersection of support and lower blue trendline acting as a non-horizontal support.
📚 As per my trading style:
As #USDCHF is around the blue circle zone, I will be looking for bullish reversal setups (like a double bottom pattern, trendline break , and so on...)
📚 Always follow your trading plan regarding entry, risk management, and trade management.
Good luck!
All Strategies Are Good; If Managed Properly!
~Rich
Disclosure: I am part of Trade Nation's Influencer program and receive a monthly fee for using their TradingView charts in my analysis.

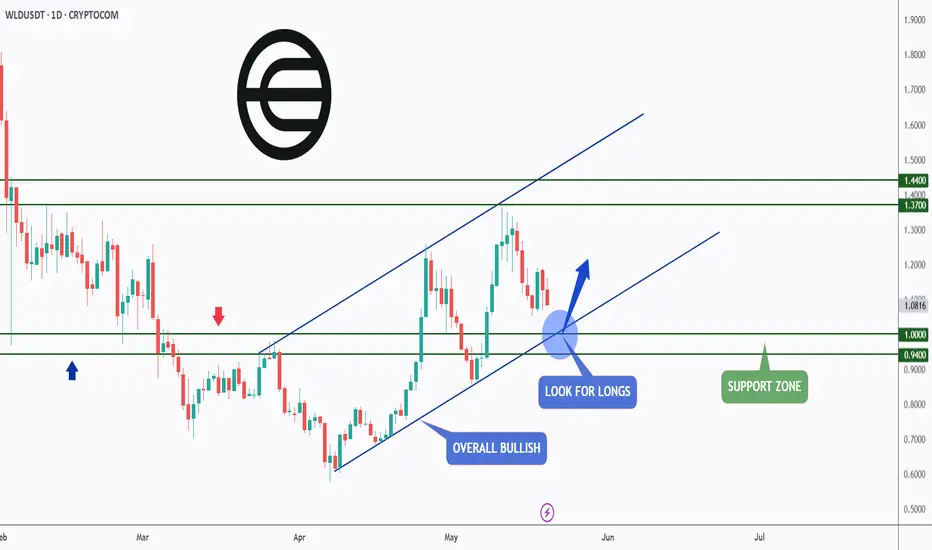
WLD - AI Cycle Is Back!Hello TradingView Family / Fellow Traders. This is Richard, also known as theSignalyst.
📈WLD has been in a correction phase. However it is still overall bullish long-term trading within the rising channel marked in blue.
Moreover, the green zone is a strong support and round number $1.
🏹 Thus, the highlighted blue circle is a strong area to look for buy setups as it is the intersection of support and lower blue trendline acting non-horizontal support.
📚 As per my trading style:
As #WLD retests the blue circle zone, I will be looking for bullish reversal setups (like a double bottom pattern, trendline break , and so on...)
📚 Always follow your trading plan regarding entry, risk management, and trade management.
Good luck!
All Strategies Are Good; If Managed Properly!
~Rich
EURUSD - The Bears Are Getting Started!Hello TradingView Family / Fellow Traders. This is Richard, also known as theSignalyst.
📈EURUSD has been bullish trading within the rising blue channel.
However, it is currently retesting the upper bound of both red and blue channels.
🏹 The highlighted red circle is a strong area to look for sell setups as it is the intersection of the upper trendlines and orange resistance zone.
📚 As per my trading style:
As #EURUSD is around the red circle zone, I will be looking for bearish reversal setups (like a double top pattern, trendline break , and so on...)
📚 Always follow your trading plan regarding entry, risk management, and trade management.
Good luck!
All Strategies Are Good; If Managed Properly!
~Rich
Disclosure: I am part of Trade Nation's Influencer program and receive a monthly fee for using their TradingView charts in my analysis.

Based on macd and SMA ready to shortBased on macd and SMA ready to short first profit @204 soon. Simple moving average is ready and supportedby MACD also

DOTUSDT Potential UpsidesHey Traders, in today's trading session we are monitoring DOTUSDT for a buying opportunity around 4.20 zone, DOTUSDT is trading in an uptrend and currently is in a correction phase in which it is approaching the trend at 4.20 support and resistance area.
Trade safe, Joe.

USDJPY - New Impulse Soon!Hello TradingView Family / Fellow Traders. This is Richard, also known as theSignalyst.
📈USDJPY has been overall bullish trading within the rising broadening wedge pattern marked in blue and it is currently hovering around the lower bound of it.
Moreover, the orange zone is a strong structure and support.
🏹 Thus, the highlighted blue circle is a strong area to look for buy setups as it is the intersection of structure and lower blue trendline acting as a non-horizontal support.
📚 As per my trading style:
As #USDJPY is around the blue circle zone, I will be looking for bullish reversal setups (like a double bottom pattern, trendline break , and so on...)
📈The bullish impulse will begin after a break above the last minor high and upper red trendline.
📚 Always follow your trading plan regarding entry, risk management, and trade management.
Good luck!
All Strategies Are Good; If Managed Properly!
~Rich
Disclosure: I am part of Trade Nation's Influencer program and receive a monthly fee for using their TradingView charts in my analysis.

USDJPY - Long Done, Soon Short!Hello TradingView Family / Fellow Traders. This is Richard, also known as theSignalyst.
📈As per our last USDJPY analysis, it rejected the orange support zone and has been trading higher.
What's next? As USDJPY approaches the upper blue trendline, we will be looking for shorts.
🏹 The highlighted red circle is a strong area to look for sell setups as it is the intersection of the upper blue trendline and green supply zone.
📚 As per my trading style:
As #USDJPY retests the red circle zone, I will be looking for bearish reversal setups (like a double top pattern, trendline break , and so on...)
Meanwhile, USDJPY would remain bullish medium-term and a bullish continuation towards the red circle is expected.
📚 Always follow your trading plan regarding entry, risk management, and trade management.
Good luck!
All Strategies Are Good; If Managed Properly!
~Rich
Disclosure: I am part of Trade Nation's Influencer program and receive a monthly fee for using their TradingView charts in my analysis.

NZDJPY - Off We Go... Again!Hello TradingView Family / Fellow Traders. This is Richard, also known as theSignalyst.
📈NZDJPY has been overall bullish trading within the rising channel marked in red.
Moreover, the green zone is a strong demand!
🏹 Thus, the highlighted blue circle is a strong area to look for buy setups as it is the intersection of demand and lower red trendline acting as a non-horizontal support.
📚 As per my trading style:
As #NZDJPY approaches the blue circle zone, I will be looking for bullish reversal setups (like a double bottom pattern, trendline break , and so on...)
📚 Always follow your trading plan regarding entry, risk management, and trade management.
Good luck!
All Strategies Are Good; If Managed Properly!
~Rich
Disclosure: I am part of Trade Nation's Influencer program and receive a monthly fee for using their TradingView charts in my analysis.

SWDY Trend AnaylsisSWDY stock is in a downward trend. In case of falling, it's expected to break the first support line at 78.025 points, till it reaches the second support line at 76.249 points. In case of rising, it's expected to reach the first support line 78.687, the second support line 78.928, and the third support line at 79.019, which is highly anticipated due to its latest acquisition.
