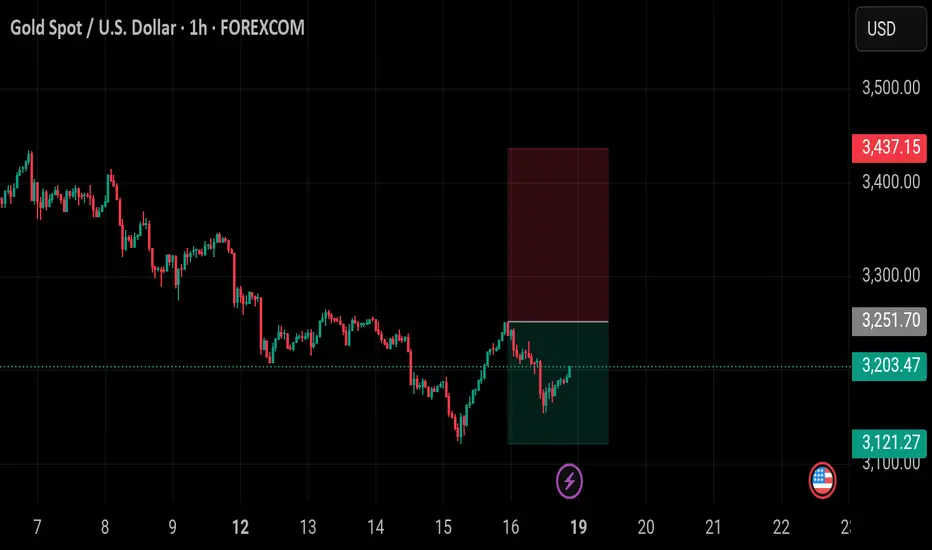
Xauusd down trendTye xauusd has been on a downtrend this week. It will probably continue and it has a pull down on Friday before the market close. It will continue on a downtren definitely.
Take profit is at 3121.27
Trend
Bitcoin Potential UpsidesHey Traders, in today's trading session we are monitoring BTCUSDT for a buying opportunity around 100,000 zone, Bitcoin is trading in an uptrend and currently is in a correction phase in which it is approaching the trend at 100,000 support and resistance area.
Trade safe, Joe.

ETH is still Bullish!!Hello TradingView Family / Fellow Traders. This is Richard, also known as theSignalyst.
📈This week, ETH has been in a correction phase. However it is still overall bullish long-term trading within the rising channel marked in blue.
Moreover, the green zone is a strong demand and structure.
🏹 Thus, the highlighted blue circle is a strong area to look for buy setups as it is the intersection of structure and lower blue trendline acting non-horizontal support.
📚 As per my trading style:
As #ETH retests the blue circle zone, I will be looking for bullish reversal setups (like a double bottom pattern, trendline break , and so on...)
📚 Always follow your trading plan regarding entry, risk management, and trade management.
Good luck!
All Strategies Are Good; If Managed Properly!
~Rich

Ripple Potential UpsidesHey Traders, in today's trading session we are monitoring XRP/USDT for a buying opportunity around 2.50 zone, XRP/USDT is trading in an uptrend and currently is in a correction phase in which it is approaching the trend at 2.50 support and resistance area.
Trade safe, Joe.

BTC 15M APEX ENTRY Confirmed by 1H TrendThis 15-minute Apex Entry aligned with the 1H trend, avoiding fakeouts and confirming direction.
The Tenoris Apex Suite uses real-time support/resistance detection and multi-timeframe logic to identify breakout entries with zero lag.
I use this method to focus only on trades that align across key timeframes.
Not financial advice – just sharing how I trade.
For access, see profile bio.

BTC - New Short-Term Long!Hello TradingView Family / Fellow Traders. This is Richard, also known as theSignalyst.
📈BTC has been overall bullish trading within the rising channel marked in blue.
Moreover, the green zone is a strong demand and structure.
🏹 Thus, the highlighted blue circle is a strong area to look for buy setups as it is the intersection of structure and lower blue trendline acting non-horizontal support.
📚 As per my trading style:
As #BTC retests the blue circle zone, I will be looking for bullish reversal setups (like a double bottom pattern, trendline break , and so on...)
📚 Always follow your trading plan regarding entry, risk management, and trade management.
Good luck!
All Strategies Are Good; If Managed Properly!
~Rich

DOTUSDT Potential UpsidesHey Traders, in today's trading session we are monitoring DOTUSDT for a buying opportunity around 5.030 zone, DOTUSDT is trading in an uptrend and currenty is in a correction phase in which it is approaching the trend at 5.030 support and resistance area.
Trade safe, Joe.

SUSHI - History Repeating Itself!Dear TradingView community and fellow traders,
I am Richard, also known as theSignalyst.
I find the SUSHI 🍣 daily chart intriguing , as it seems to be following the classic Wyckoff Cycle 📈.
If history repeats itself, we’ve just broken out of the accumulation phase ✅, highlighted in green 🟩.
As long as the bulls 🐂 remain in control, the markup phase may have just begun—potentially pushing SUSHI as high as $2.5 🚀.
❓ What's next?
Will SUSHI continue to trade higher from here, or will this cycle play out differently?
I hope you find this post useful, and I would appreciate your likes and support.
Which scenario do you think is more likely to happen first? and why?
📚 Always follow your trading plan regarding entry, risk management, and trade management.
Good luck!
All Strategies Are Good; If Managed Properly!
~Richard

USDCAD 1 MIN Chart Sell TrendHello,
I’m like a ghost, I come every so and so. Ready for some free trades?
USDCAD 1 MIN chart is showing a sell trend.
Please use risk management as sometimes they trends keep going up or down until they go with the trade.
I will advise you at the comments below when to close the trades.
So please follow for any notifications.
Thanks,
P.S… Should I start a trading community within TradingView? What’s your thoughts?

GBPUSD - Bearish Pressure Soon!Hello TradingView Family / Fellow Traders. This is Richard, also known as theSignalyst.
📈As per our last GBPUSD analysis, it rejected the $1.27 - $1.28 support zone and has been trading higher.
This week, GBPUSD is approaching the upper bound of its rising wedge pattern marked in red.
Moreover, the blue zone around $1.34 is a strong resistance and previous weekly high.
🏹 Thus, the highlighted red circle is a strong area to look for sell setups as it is the intersection of the upper red trendline and resistance.
📚 As per my trading style:
As #GBPUSD retests the red circle zone, I will be looking for bearish reversal setups (like a double top pattern, trendline break , and so on...)
📚 Always follow your trading plan regarding entry, risk management, and trade management.
Good luck!
All Strategies Are Good; If Managed Properly!
~Rich
Disclosure: I am part of Trade Nation's Influencer program and receive a monthly fee for using their TradingView charts in my analysis.

my idea about btc in secound half of 2025Dear followers,
I’ve analyzed BTC’s recent price movements and on-chain indicators, and I’d like to share my outlook for the second half of 2025. Based on my technical and macroeconomic assessment, I anticipate a significant correction before a strong rebound later in the year.
Key Highlights:
Sell Zone: I expect BTC to reach around $108,000 during a bullish run, where I recommend taking profits and initiating a short position.
Correction Phase: Following the peak, I foresee a correction bringing BTC down to approximately $69,000. This presents a deep buy opportunity for those looking to accumulate at lower levels.
Target for Rebound: Post-correction, I project a strong rally towards $140,000, driven by renewed institutional interest and market fundamentals.
Trading Strategy:
Consider selling or reducing holdings near the $108K level.
Be prepared to accumulate during the dip around $69K.
Aim for the $140K target on the rebound, aligned with overall bullish momentum.
Please note that all trading involves risk, and it's essential to manage your positions carefully. Stay tuned for updates, and always do your own research before making trading decisions.
Let me know your thoughts or if you'd like a deeper analysis!

QNT - The Bulls are Leading!Hello TradingView Family / Fellow Traders. This is Richard, also known as theSignalyst.
📈After breaking above the last major high marked in red, QNT has been overall bullish trading within the rising wedge pattern marked in blue.
Moreover, the green zone is a strong demand and structure.
🏹 Thus, the highlighted blue circle is a strong area to look for buy setups as it is the intersection of structure and lower blue trendline acting non-horizontal support.
📚 As per my trading style:
As #QNT retests the blue circle zone, I will be looking for bullish reversal setups (like a double bottom pattern, trendline break , and so on...)
📚 Always follow your trading plan regarding entry, risk management, and trade management.
Good luck!
All Strategies Are Good; If Managed Properly!
~Rich

EURNZD - The Bull of the Week!Hello TradingView Family / Fellow Traders. This is Richard, also known as theSignalyst.
📈EURNZD has been overall bearish trading within the falling channel marked in red.
However, it is retesting the lower bound of the channel acting as an over-sold area.
Moreover, the blue zone is a strong demand!
🏹 Thus, the highlighted blue circle is a strong area to look for buy setups as it is the intersection of demand and lower red trendline acting as a non-horizontal support.
📚 As per my trading style:
As #EURNZD approaches the blue circle zone, I will be looking for bullish reversal setups (like a double bottom pattern, trendline break , and so on...)
📚 Always follow your trading plan regarding entry, risk management, and trade management.
Good luck!
All Strategies Are Good; If Managed Properly!
~Rich
Disclosure: I am part of Trade Nation's Influencer program and receive a monthly fee for using their TradingView charts in my analysis.

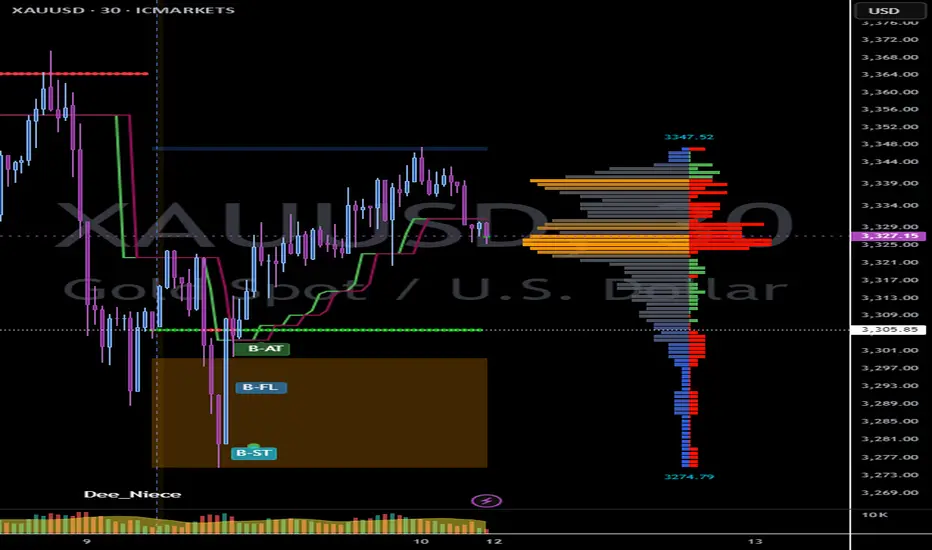
A little bit of tiny help that offer great resultsprnt.sc
As always I based my charting on trend following method, but knowing where the exhaustion is crucial in helping when to take profit or make a sniper entry.
As I always rely on periodic Volume Profile, recently I switch to using Luxalgo Liquidity and Sentiment Profile. For timeframe 30 mins and lower, I used the fixed range with a total of bars per timeframe as my range. For 1 hour and 2h, I will used the weekly setup.
So far it brings great combination results. Check above link for my current open trade.
DOGE - 1$ NextDoge is getting ready for the next wave. Based on the previous trend we are looking at the next target around 1.1$.
Doge can break 1$ easily based on the current trend and overall interested in DOGE.
Entry: 0.1766
TP1: 0.22086
TP2: 0.30439
TP3: 0.40104
TP4: 0.53436
TP5: 1.13587
Stop Loss: 0.1143
Follow us for more such ideas.
Cheers
GreenCrypto

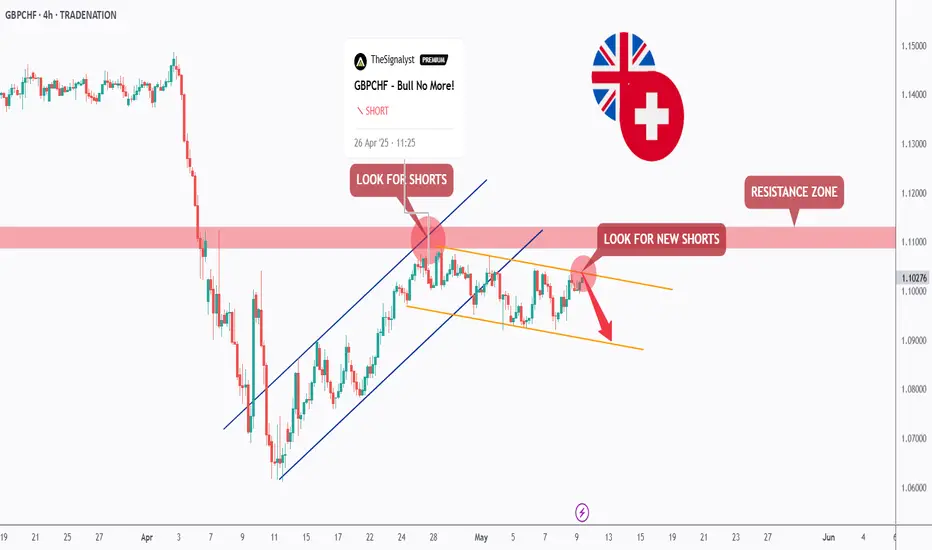
GBPCHF - Short Again!Hello TradingView Family / Fellow Traders. This is Richard, also known as theSignalyst.
📉As per our last GBPCHF analysis (attached on the chart), it rejected the red resistance zone and has been trading lower.
Short-term, GBPCHF has been trading within the falling channel marked in orange and today, it has been rejecting the upper bound of the orange channel.
🏹 Thus, the highlighted red circle is a strong area to look for sell setups as it is the intersection of the upper orange trendline aligned with the previous long-term analysis/trend.
📚 As per my trading style:
As #GBPCHF is hovering around the red circle zone, I will be looking for bearish reversal setups (like a double top pattern, trendline break , and so on...)
📚 Always follow your trading plan regarding entry, risk management, and trade management.
Good luck!
All Strategies Are Good; If Managed Properly!
~Rich
Disclosure: I am part of Trade Nation's Influencer program and receive a monthly fee for using their TradingView charts in my analysis.
Uptrend Stock / Swing and Run Trend / SE (NYSE)Uptrend Stock / Swing and Run Trend
SE (NYSE)
Fundamental
Sea Limited operates in three highly attractive business segments:
Sea Money – The company’s digital financial services arm offers consumer and SME lending, mobile wallets, and payment processing services.
Shopee – The largest e-commerce platform in Southeast Asia and Taiwan, with strong market presence and growth.
Garena – The company’s digital entertainment division, providing access to popular mobile and PC games. It also promotes eSports. Garena has developed its own successful game titles such as Free Fire, a globally popular battle royale game.
Sea Limited's key strength lies in its integrated platform that combines e-commerce, digital finance, and digital entertainment under one umbrella. This synergy allows the company to cross-leverage its customer base—for example, using Shopee users to promote Sea Money's financial services.
Technical
The price has been forming accumulation patterns at the bottom and gradually rallying upwards.
It’s showing a sideways-up structure, where the price bases sideways and then continues to rally upward in steps.
This setup allows for buy-the-dip opportunities using an indicator called Regression Trend to identify the trading channel.
For swing trading, one could buy on dips near the lower support band and sell at resistance on the upper band.
As shown in the chart (with circles marked), I’ve been buying on dips along the way.
In the most recent phase, you can consider buying around $139. If the price breaks out, the next support levels to watch would be around $143 and $147.
Target prices:
First target: $150
Next targets: $160 and $170
Stop Loss:
If the price drops below $120 and breaks the price structure, that would be the stop level.
As the quarterly earnings announcement approaches, the price is rallying in anticipation, and it's showing strong momentum within an uptrend—very positive sign.

EURAUD - Overall Bearish Medium-Term!Hello TradingView Family / Fellow Traders. This is Richard, also known as theSignalyst.
📈EURAUD has been overall bearish trading within the falling wedge pattern marked in red.
Moreover, the green zone is a strong structure and resistance.
🏹 Thus, the highlighted red circle is a strong area to look for sell setups as it is the intersection of the upper red trendline and resistance.
📚 As per my trading style:
As #EURAUD retests the red circle zone, I will be looking for bearish reversal setups (like a double top pattern, trendline break , and so on...)
📚 Always follow your trading plan regarding entry, risk management, and trade management.
Good luck!
All Strategies Are Good; If Managed Properly!
~Rich
Disclosure: I am part of Trade Nation's Influencer program and receive a monthly fee for using their TradingView charts in my analysis.

EURAUD - Long-Term Correction in the Making!Hello TradingView Family / Fellow Traders. This is Richard, also known as theSignalyst.
📈EURAUD has been bullish trading within the rising channel in blue.
Currently, EURAUD is retesting the upper bound of the channel.
Moreover, the $1.84 - $1.87 is a strong weekly resistance zone.
🏹 Thus, the highlighted red circle is a strong area to look for sell setups as it is the intersection of the upper blue trendline and green resistance zone.
📚 As per my trading style:
As #EURAUD is hovering around the red circle zone, I will be looking for bearish reversal setups (like a double top pattern, trendline break , and so on...)
📚 Always follow your trading plan regarding entry, risk management, and trade management.
Good luck!
All Strategies Are Good; If Managed Properly!
~Rich
Disclosure: I am part of Trade Nation's Influencer program and receive a monthly fee for using their TradingView charts in my analysis.

Fartcoin: Is the Smell of a Downtrend in the Air? 📉 Fartcoin: Is the Smell of a Downtrend in the Air? 💨
🚨 Alert: The RSI is holding its nose... and so should we.
After a suspiciously bubbly rally, $FARTCOIN is now showing bearish RSI divergence on the 4H chart — and let’s be honest, it’s starting to stink. 🦨
The recent price action looks like someone tried to pump it... but forgot to ventilate. 💣💨
🧻 Support is about to get wiped.
💩 MACD says momentum is going down the drain.
🚽 Volume drying up like gas after Taco Tuesday.
TA Summary:
RSI Divergence ✅
Rising wedge (aka clogged pipes) ✅
Community still in denial? ✅

USDJPY Potential UpsidesHey Traders, in today's trading session we are monitoring USDJPY for a buying opportunity around 143.500 zone, USDJPY is trading in an uptrend and currently is in a correction phase in which it is approaching the trend at 143.500 support and resistance area.
Trade safe, Joe.

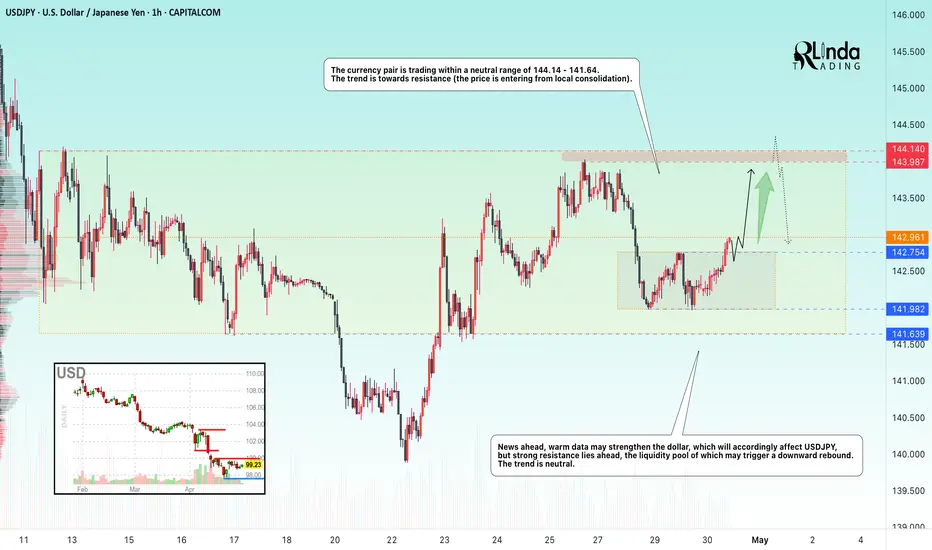
USDJPY → Price in range, retest of resistanceFX:USDJPY is emerging from local consolidation in hopes of seeing economic data that could support the dollar. The target for this movement could be the liquidity zone at 144.00.
The currency pair is trading within a neutral range of 144.14 - 141.64. However, a local consolidation has formed within the range, from which the price has broken out. The main task for the bulls is to hold the defense above 142.75, in which case we will be able to catch the price distribution to the upper border of the global range of 144.14.
News ahead, positive data may strengthen the dollar, which will accordingly affect USDJPY, but there is strong resistance at 144.14, whose liquidity pool may trigger a downward rebound. The trend is neutral.
Resistance levels: 143.9, 144.14
Support levels: 142.75, 141.98
There are no reasons to exit the global range. Over the past two weeks, this will be the first retest of the 144.14 zone, which in general only increases the chances of a false breakout and correction.
Best regards, R. Linda!
$16.50 to $39 in less than 24 hours Uptrend was too good to pass on at $16 so I said this could continue uptrending to $30, $40.
The next morning it goes on a power vertical into $40 area NASDAQ:CEP
Congrats if you saw my messages and jumped in!
