ETH - Longs on the Go!Hello TradingView Family / Fellow Traders. This is Richard, also known as theSignalyst.
📈ETH has been overall bullish from a medium-term perspective trading within the rising channel marked in blue.
Moreover, the red zone is a strong resistance turned support!
🏹 Thus, the highlighted blue circle is a strong area to look for buy setups as it is the intersection of support and lower blue trendline acting as a non-horizontal support.
📚 As per my trading style:
As #ETH approaches the blue circle zone, I will be looking for bullish reversal setups (like a double bottom pattern, trendline break , and so on...)
📚 Always follow your trading plan regarding entry, risk management, and trade management.
Good luck!
All Strategies Are Good; If Managed Properly!
~Rich
Trend

GBPNZD - Marco Trend Still Up!Hello TradingView Family / Fellow Traders. This is Richard, also known as theSignalyst.
📈GBPNZD has been overall bullish from a macro perspective trading within the rising channels in blue and orange.
Moreover, the green zone is a strong support, structure and demand.
🏹 Thus, the highlighted blue circle is a strong area to look for buy setups as it is the intersection of support and lower orange/blue trendlines acting non-horizontal support.
📚 As per my trading style:
As #GBPNZD approaches the blue circle zone, I will be looking for bullish reversal setups (like a double bottom pattern, trendline break , and so on...)
📚 Always follow your trading plan regarding entry, risk management, and trade management.
Good luck!
All Strategies Are Good; If Managed Properly!
~Rich
Disclosure: I am part of Trade Nation's Influencer program and receive a monthly fee for using their TradingView charts in my analysis.

Bitcoin Bullish for ShortermBitcoin currently trade around $93,911 having broken resitance above $88,000-$89,000 zone. The breakout, supported by strong volume, positions Bitcoin favorably for further gains, although a short-term pullback appears likely.
Technical indicators remain bullish:
Price holds above the 21-EMA and 30-SMA, both beginning to slope upward.
Quarterly VWAP levels at $89,485 and $84,484 provide strong support.
The Volume Profile suggests heavy buyer interest around $84,000–$86,000.
A minor retracement toward $88,000–$89,000 could precede a consolidation phase before Bitcoin targets $96,000 and eventually the psychological $100,000 mark.
Bitcoin remains in a strong position. Tactical patience and disciplined risk management will be key to capitalizing on the next major move.

NVDIA Death Cross Quant Perspectives (Light Case Study)NASDAQ: Nvidia (NVDA ) has recently experienced an uptrend after a death cross formed consisting of the 65 and 200 EMAs on the 1 Day chart.
If we analyze back on Nvidia starting in 1999 , we can count a total of 10 death crosses that have occurred, and 9 have been immediately followed by downtrends. Although a single death cross did not have an immediate downtrend, shortly after this event (approx. 282 days) another death cross formed and price then fell roughly twice as it historically has , almost appearing to make up for the missed signal.
From a quantitative perspective:
If we calculate the raw historical success rate using:
Raw Success Rate = 9/10 = 90
With this calculation the observed success of 65/200 EMA death crosses correlating to an immediate downtrend is 90%
In order to avoid overconfidence we can apply Laplace smoothing using:
Smoothed Probability = 9+1/10+2 = 10/12 or 0.8333
With this calculation the observed success of 65/200 EMA death crosses correlating to an immediate downtrend is 83%
Given the results of the data I personally feel that there is a Very High (83%) chance this death cross that recently formed on the 1 Day chart (around 04/16/2025) will immediately lead to a downtrend. And a Low (17%) chance it does not. Furthermore these results support a technical analysis hypothesis that I formed prior.
Many different systemic factors can contribute to the market movement, but mathematics sometimes leave subtle clues. Will the market become bearish? Or will Nvidia gain renewed bullish interest?
Disclaimer: Not Financial Advice.

INJ Is Nearing An Important SupportHey Traders, in today's trading session we are monitoring INJ/USDT for a buying opportunity around 9.90 zone, INJ/USDT is trading in an uptrend and currently is in a correction phase in which it is approaching the trend at 9.90 support and resistance area.
Trade safe, Joe.

USDJPY - Already Over-Sold!Hello TradingView Family / Fellow Traders. This is Richard, also known as theSignalyst.
📈USDJPY has been overall bearish trading within the falling wedge pattern marked in blue and it is currently hovering around the lower bound of it.
Moreover, the orange zone is a strong weekly support.
🏹 Thus, the highlighted blue circle is a strong area to look for buy setups as it is the intersection of support and lower blue trendline acting as a non-horizontal support.
📚 As per my trading style:
As #USDJPY approaches the blue circle zone, I will be looking for bullish reversal setups (like a double bottom pattern, trendline break , and so on...)
📚 Always follow your trading plan regarding entry, risk management, and trade management.
Good luck!
All Strategies Are Good; If Managed Properly!
~Rich
Disclosure: I am part of Trade Nation's Influencer program and receive a monthly fee for using their TradingView charts in my analysis.

Gold is still Strong; Long-Term!Hello TradingView Family / Fellow Traders. This is Richard, also known as theSignalyst.
📈GOLD has been overall bullish from a macro perspective trading within the rising wedge pattern in orange.
After rejecting the $3,500 round number and upper bound of the wedge, XAUUSD signaled the start of the correction phase.
Moreover, the $3,100 - $3,150 zone is a strong support.
🏹 Thus, the highlighted blue circle is a strong area to look for buy setups as it is the intersection of support and lower orange trendline acting non-horizontal support.
📚 As per my trading style:
As #XAUUSD approaches the blue circle zone, I will be looking for bullish reversal setups (like a double bottom pattern, trendline break , and so on...)
📚 Always follow your trading plan regarding entry, risk management, and trade management.
Good luck!
All Strategies Are Good; If Managed Properly!
~Rich
Disclosure: I am part of Trade Nation's Influencer program and receive a monthly fee for using their TradingView charts in my analysis.

LanzaTech (LNZA). Extremely oversold! Rally incoming?NASDAQ: LanzaTech (LNZA) , based in Illinois, USA, has recently has seen a price low of $0.1401 . This waste management company in recent times, has been featured as a top pick for buys by various news outlets. Although in an extremely bearish slump, I have a bullish prediction.
In the technicals on the 1 Day Chart , the RSI appears to be indicating oversold , with a slight potential of more of a dip to come. The Stochastic seems to also be indicating oversold market conditions. A long time frame bullish RSI divergence also appears to be forming starting at the middle of Feb 2023.
LanzaTech recently declined a "lowball" offer for $0.02 a share, which could signal insider bullish sentiment. LanzaTech FY25 Q1 earnings are forecasted to be significantly higher than FY24 Q4 at this time (RH). Their website, marketing and twitter appear to show no real signs of slowing business operations in my opinion.
Analysis also appears shows that there is very little open interest on put options at this time. Conversely there seems to be a large number of call options from $1-$7 expiring in the near future signaling institutions and high profile traders may be entering the market quietly.
Given the above signals and analysis I personally am setting a speculative stretch price target of $7 with various other orders taking profit along the way at key strike price cluster levels. With LanzaTech at a discounted price, a buy now could yield significant results.
Anything can happen in the markets. What do you think? Will LanzaTech recover? Or will value become completely wiped out?
Disclaimer: Not Financial Advice

BTC - Bullish Control, Confirmed!Hello TradingView Family / Fellow Traders! This is Richard, also known as theSignalyst.
🚀 As per my last two setups (highlighted on the chart), BTC rejected the $72,000 support and pushed higher with strength.
📈 This week, BTC broke above the $90,000 structure, confirming a shift in momentum from bearish to bullish.
🟢 For the bulls to stay in control, a break above the $95,200 resistance is still needed.
📊 In the meantime, as BTC retests the $89,000–$90,000 zone, we’ll be looking for medium-term trend-following longs to catch the next impulsive move.
📚 Reminder:
Always stick to your trading plan — entry, risk management, and trade management are key.
Good luck, and happy trading!
All Strategies Are Good, If Managed Properly!
~Rich

Victorias Secret (VSCO) Bull Run Incoming? Insider Signals?Victorias Secret & Co. (VSCO) Based in Ohio, USA has recently seen a dip in asset value to $16, but recovery could be imminent.
On the 1 Day chart both a bullish RSI divergence and CVD divergence seems to be forming. The DMI appears to show the bearish directional movement is slowing, and the ADX still remains above 20.
In march Insiders were reported to have purchased 1.92M shares. Conversely only 20,000 shares were sold by Insiders (Robinhood Analytics). Insider activity may indicate undisclosed company confidence.
The order book shows a decent number of open interest for $25.00. Subsequently this price target is located near key resistance areas that in my opinion, price will most likely touch in the near future.
Earnings are set to be released in May and traders and institutions may begin to price in fundamental factors before the report .
Given the above technical and fundamental signals, insider activity, and approaching earnings report. My hypothesis is bullish with a price target of $25.00 before 06/20/2025.
Will tariffs and politics stop VSCO's upwards movement? Or do the technicals and Insider moves signal a current discounted buy?
Disclaimer: Not financial advice.

NZDJPY - Following the Bears...Hello TradingView Family / Fellow Traders. This is Richard, also known as theSignalyst.
📈From a long-term perspective, NZDJPY has been overall bearish trading within the falling wedge pattern in red.
Moreover, the orange zone is a strong supply.
🏹 Thus, the highlighted red circle is a strong area to look for sell setups as it is the intersection of the upper red trendline and supply.
📚 As per my trading style:
As #NZDJPY approaches the red circle zone, I will be looking for bearish reversal setups (like a double top pattern, trendline break , and so on...)
📚 Always follow your trading plan regarding entry, risk management, and trade management.
Good luck!
All Strategies Are Good; If Managed Properly!
~Rich
Disclosure: I am part of Trade Nation's Influencer program and receive a monthly fee for using their TradingView charts in my analysis.

BTC - Bulls Charging... However!Hello TradingView Family / Fellow Traders. This is Richard, also known as theSignalyst.
As per our last analysis (attached on the chart), BTC rejected the blue trendline support and has been bullish in the medium term. 📈
However, the overall sentiment remains bearish, as BTC is still trading within the falling channel marked in red. 📉
For the bulls to take over long term and initiate the next impulsive wave, a break above the $91,000 major high in blue is needed. 🔵
Meanwhile, BTC may still retest the blue trendline — where we’ll be looking for new short-term longs. 🎯
📚 Always follow your trading plan regarding entry, risk management, and trade management.
Good luck!
All Strategies Are Good; If Managed Properly!
~Rich

NEAR/USDT is Nearing The Daily TrendHey Traders, in today's trading session we are monitoring NEAR/USDT for a selling opportunity around 2.55 zone, NEAR/USDT is trading in a downtrend and currently is in a correction phase in which it is approaching the trend at 2.55 support and resistance area.
Trade safe, Joe.

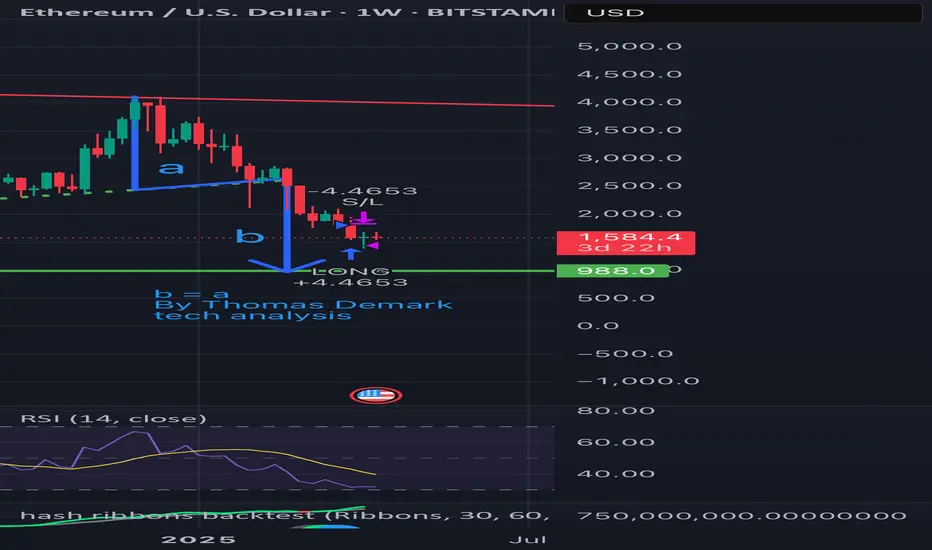
ETH is falling per Demark’s technical analysis: Target at $988?According to Thomas Demark’s method — when b = a, the next target for ETH is around $988.
📉 Price broke the ascending support
🔻 Wave “a” from $4000 to $2500 has already played out
📏 Wave “b” is projected downward — target aligns with a strong historical support zone
📊 Weekly RSI is nearing oversold territory
Conclusion: The $988 area is critical. A reversal may occur there if selling pressure weakens.
Stay sharp.
#ETH #Demark #CryptoAnalysis #TechnicalAnalysis #Ethereum
$RKLB preparing for takeoff? 3...2...1... NASDAQ:RKLB : Good support in the $15 area, good volume in that buy zone and floating above it's 200EMA/SMA, 50EMA/SMA and a nice weekly candle. Targets: $21.80, $22.50 and mega momentum towards $25.
WSL.

Update to Dow Jones Industrials Time At Mode Back in 2015 I had published a chart with annual data for the Dow Jones Industrials. I will provide a link at the bottom.
The research for this patterning is something I did myself by hand using pencil and paper back in the 1980's. These patterns show up in all time frames.
There is plenty of room to enhance the research on this technique and a group of us gather in the chat rooms here at TradingView to discuss new trades that set up and point out when trades expire.
Notice how these two grey boxes (which are both 50% drops in price) that expand wider in time from the 1960's to the 1980's and the 2000-2010's had a multi-year trend, followed by a monster crash (1987 was 40% and 2000 was 37%) and then just two+ years later there was a secondary bear market of 20% in 1990 and 22% in 2022. Keep in mind this is just for the DJ:DJI and not the Nasdaq Composite or S&P500 which were greater corrections.
The 11-year time frame of the 1999-2011 pattern allows for an 11-year rally from 2012 (which was year 1 of the 11-year rally) shows that time expired. As you can see from the 1943-1962 trend, a smaller 5-year mode formed at the end of the 20 year trend and then the market peaked in 1972-1973 when time expired for the second, smaller mode.
I had to reconstruct this chart after the data for the previous chart changed symbol. See the link below to see the original.
I look forward to your additional research onto this pattern and its implications to the idea that we are in a similar period to 1993-1994 with rally years of 1996, 1997, 1998, 1999 and 2000 ahead of us.
All the best,
Tim
October 19, 2024 3:31PM EST

USDCAD - Long-Term Long!Hello TradingView Family / Fellow Traders. This is Richard, also known as theSignalyst.
📈USDCAD has been overall bullish from a macro perspective trading within the rising blue channel.
This week, USDCAD has been in a correction phase trading within the falling red channel.
Moreover, the green zone is a strong resistance turned support.
🏹 Thus, the highlighted blue circle is a strong area to look for buy setups as it is the intersection of support and lower red/blue trendlines acting non-horizontal support.
📚 As per my trading style:
As #USDCAD approaches the blue circle zone, I will be looking for bullish reversal setups (like a double bottom pattern, trendline break , and so on...)
📚 Always follow your trading plan regarding entry, risk management, and trade management.
Good luck!
All Strategies Are Good; If Managed Properly!
~Rich
Disclosure: I am part of Trade Nation's Influencer program and receive a monthly fee for using their TradingView charts in my analysis.

Why make it too complicated?!!Find the trend, follow the trend and stay on the trend. If can't find the trend then wait, trading is a marathon and not sprint.

BTC | BEARISH Cycle Begins | $71KThere are a few tell signs that BTC has entered the bearish market.
If the price fails to maintain closing daily candles ABOVE the 70k area, there is a likelihood for a nasty Head and Shoulders pattern to form.
A key point to watch are the Bollinger Bands, which gives you an indication of the next possible zone to watch.
_____________________
BINANCE:BTCUSDT

EURUSD - Trade The Impulse!Hello TradingView Family / Fellow Traders. This is Richard, also known as theSignalyst.
📈EURUSD has been bearish trading within the falling wedge pattern marked in red.
Currently, EURUSD is retesting the upper bound of the wedge.
Moreover, the $1.12 is a strong weekly supply zone.
🏹 Thus, the highlighted red circle is a strong area to look for sell setups as it is the intersection of the upper red trendline and supply.
📚 As per my trading style:
As #EURUSD is hovering around the red circle zone, I will be looking for bearish reversal setups (like a double top pattern, trendline break , and so on...)
📚 Always follow your trading plan regarding entry, risk management, and trade management.
Good luck!
All Strategies Are Good; If Managed Properly!
~Rich
Disclosure: I am part of Trade Nation's Influencer program and receive a monthly fee for using their TradingView charts in my analysis.

BTC at a Critical Inflection Point – Bulls vs. BearsBitcoin is currently trading around $77,644, sitting right between two major trendlines:
🟢 Long-Term Bullish Support – This green ascending trendline has held since late 2023, providing key support throughout BTC’s macro uptrend.
🔴 Medium-Term Bearish Resistance – The red descending trendline has capped price since the 2025 highs, forming a clear structure of lower highs.
We're now at a pivotal confluence zone where these two trendlines intersect. Price recently bounced off the green support, but it's struggling to decisively break above the red resistance.
🔍 Key Scenarios:
✅ Bullish Breakout:
A strong daily close above the red trendline could confirm bullish continuation.
Targets: $84K, GETTEX:92K , and potentially ATH breakout above $100K.
❌ Bearish Rejection:
Rejection at resistance may lead to a retest of the green trendline (~$74K).
A breakdown from there opens the door to GETTEX:64K –$60K, or even deeper pullbacks.

BTC - One More Leg...Hello TradingView Family / Fellow Traders!
This is Richard, also known as theSignalyst.
📉 BTC has been overall bearish , trading within the falling channel marked in red.
But the big question is — where could the potential bottom be?
👉 I’m watching the $70,000 zone!
Here’s why:
The $70,000 area is a key confluence zone — it aligns with the lower red trendline, horizontal support, a psychological round number, and a potential demand zone.
📚 According to my trading style:
As #BTC approaches the blue circle zone, I’ll be looking for bullish reversal setups — such as a double bottom pattern, trendline break, and more.
📚 Reminder:
Always stick to your trading plan — entry, risk management, and trade management are key.
Good luck, and happy trading!
All Strategies Are Good, If Managed Properly!
~Rich

LONG AMD: Keep it simple trends, time and duration3 Positions in AMD from 2018-2025
Duration of trades: 106 - 1,064 days
Gains: +217% - +917%
Closing in on the trend line, look for a bounce at the line or likely if it goes under, wait for a rally back above the line. This chart is set at the daily timeframe. If you trade on the minor volatility within the major trend, I've found the 2 hour timeframe using a combination of indicators, Relative Trend Index and HH and LL, net favorable results.
